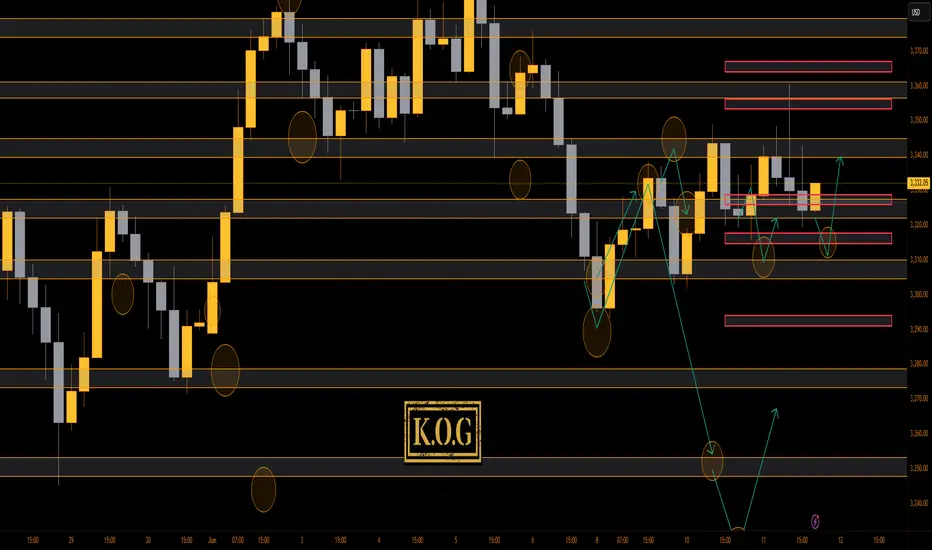
THE KOG REPORT - UpdateEnd of day update from us here at KOG:
Price moved well today sticking to the bias level and completing the first two TP levels we had shared. The path illustrated yesterday also worked well giving the move into the support level, then the bounce upside into resistance before then resuming the move.
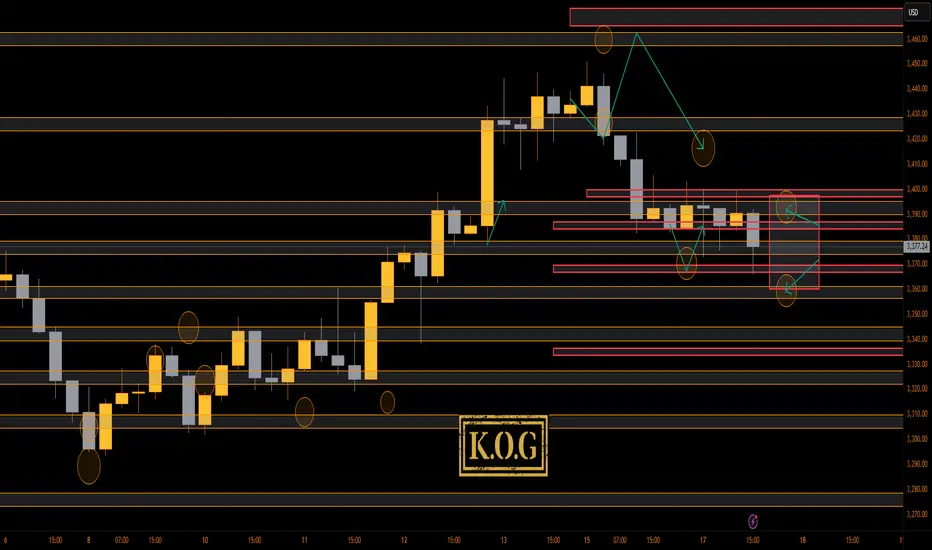
With FOMC tomorrow we can expect any sharp movement to happen in the late session and Asia, otherwise the pre-event price action has begun, we have a range in play with resistance above at the 3395 level and support below 3355-60 which has been highlighted. The bias will stand for now but we're going to take a back seat.
Price: 3382
KOG’s Bias of the day:
Bearish below 3401 with targets below 3365, 3358 and below that 3350
Bullish on break of 3401 with target above 3410 and above that 3425
RED BOXES:
Break above 3395 for 3406, 3410, 3416 and 3419 in extension of the move
Break below 3378 for 3368✅ and 3355 in extension of the move
As always, trade safe.
KOG
GOLD trade ideas
XAUUSD Builds Higher Floors – 3350 Under Pressure1. Recap of Yesterday’s View
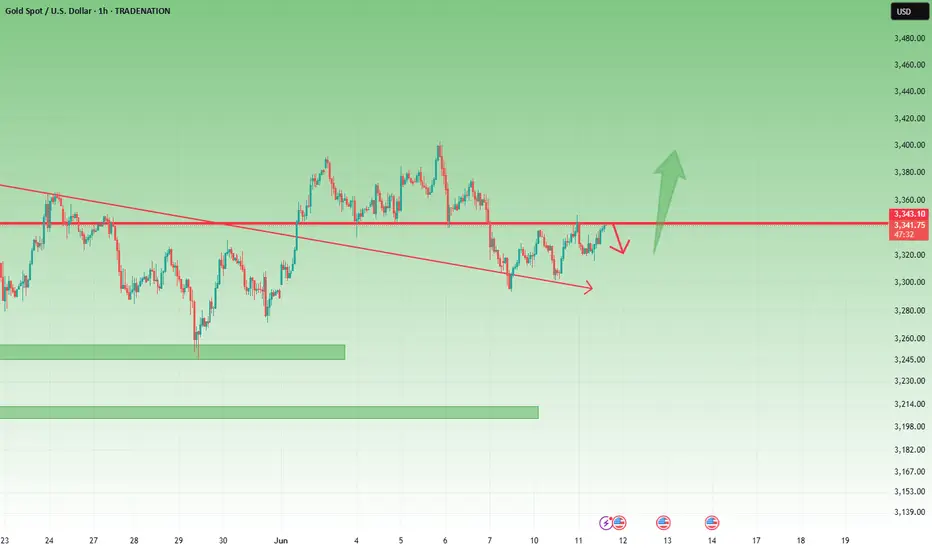
In yesterday’s analysis, I noted that Gold appeared to have built a strong floor around 3300, and while the 3340–3350 resistance zone was still capping the upside, the structure hinted at a potential breakout.
2. What Happened Since?
✅ Price once again rallied into resistance and was rejected.
But here’s the key shift:
🔹 This time, the drop only reached 3315, and it was quickly bought back.
🔹 A new higher base around 3320 is now visible.
🔹 Gold is already back into the resistance zone.
3. Technical Implication
This evolving structure signals bullish pressure is building.
Every dip is being bought higher than the last — a classic sign of demand stepping in.
We are now closer than ever to a confirmed breakout.
4. Trading Strategy
📌 A clear break and close above 3350 = breakout confirmed
🎯 Target: 3400 and above
📉 Until then, buying dips into 3315–3320 remains my preferred strategy.
5. Final Thoughts
The yellow metal is coiling tightly under resistance.
The higher floors are shouting one thing: buyers are in control.
Disclosure: I am part of TradeNation's Influencer program and receive a monthly fee for using their TradingView charts in my analyses and educational articles.
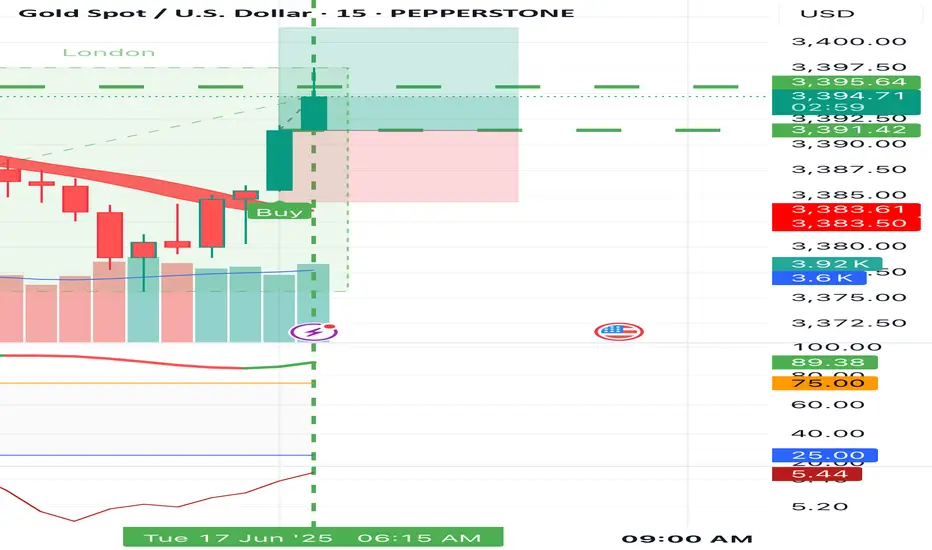
#GOLD Buy 3391.42#GOLD Buy 3391.42
SL 3384.42
TP 3393.42
TP 3401.42
TP 3415.42
Trade at your own risk
Protect your capital
The Wizard 🧙♂️ SWFX
THE KOG REPORT - UpdateEnd of day update from us here at KOG:
Yesterday we wanted that up move, then the tap of the low and the long which worked well from the red boxes which are now on the chart.
Focus was on the news today and we had not 1, not 2, but 3 active targets and a hotspot. Target was hit on the release, hotspot reacted and we got a nice short down to complete 2 short targets to end the day.
We would say resistance here is now the 3330 region which if held should give us an undercut low into that lower red box to potentially stretch those wick chasers out a little. That wick however is concerning, Gold doesn't like leaving them behind!
As always, trade safe.
KOG
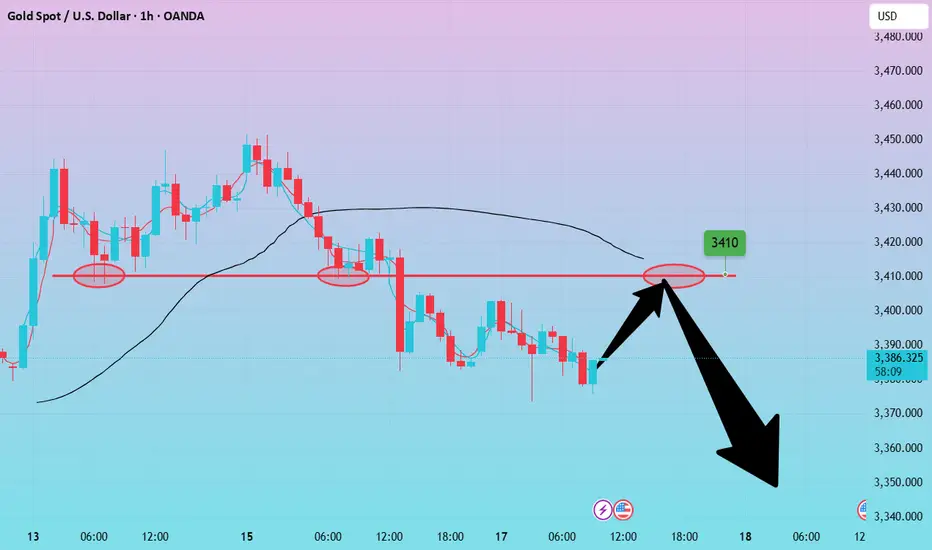
Gold-----Sell near 3405, target 3390-3360Gold market analysis:
Yesterday's daily line closed with a big negative line, which was basically a day to kill the buying. Today's idea is to sell in the short term. The daily and weekly trends have not yet turned to selling. Although the daily line closed with a big negative line yesterday, its shape and indicators have not completely turned to selling. There is still motivation to buy in the later stage. In addition, Iran and Israel are still fighting. It is still difficult to see a deep decline in the short term. We estimate that today's Asian session will rebound slightly and then fall. If today's daily line continues to fall again, it may enter a new short-term selling mode. We are just a follower. We follow the short-term. If the short-term trend is bearish, we will rebound and sell. The daily line closes the negative Asian session and waits for the opportunity to sell.
In the Asian session, we pay attention to the suppression of the 3410 position. It is the suppression position of the shape, the suppression position of the 1-hour moving average, the central axis position of yesterday's big drop, and the suppression position of the daily line. If the Asian session stands on 3410, it may bring a new technical rise in buying. After all, the shape of the daily line is still buying. Secondly, if it breaks 3382, it can continue to sell it with a small rebound. 3405 is also a suppression, and it is also considered to sell when it is close.
Pressure 3405 and 3410, support 3282, the strength and weakness dividing line 3400.
Fundamental analysis:
Yesterday, Iran and Israel started bombing each other again, and the situation began to escalate.
Operation suggestion
Gold-----Sell near 3405, target 3390-3360
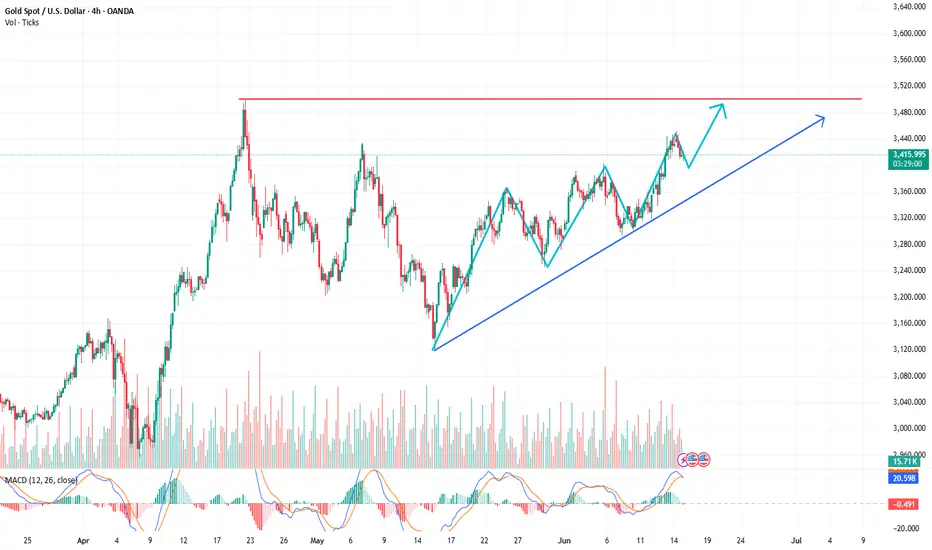
Will gold continue to rise after a pullback?As for gold: the trend of daily, weekly and monthly cycles has remained unchanged, and the bulls remain unchanged; and the weekly line has started to rise continuously, and there is a high probability that it will gradually break upward; the daily line temporarily maintains 3245-3293 as the two low points of support at the bottom, and 3382-3452 as the two top high points of resistance to form an upward channel. The upper track is currently suppressed. Although Iran and Iran are still fighting fiercely over the weekend, the market has digested a lot, because today's Asian and European sessions did not continue the strong attack, but there was a wave of continuous declines; but this does not mean that it will fall back too much, and risk aversion will still be triggered at any time. Besides, leaving aside the news, the technical form is also bullish, and the highs and lows are gradually rising. The secondary high point was also broken, and there is a high probability of testing 3500 this week;
For today, due to the weakness of the European session and the rebound before and after the US session, pay attention to the 618 resistance 3436 and other pressures to go bearish first, and then continue to choose bullish when the two supports of 3404-3390 below are touched and stabilized; if the price cannot give the support position after 22:00 to the early morning, it is not ruled out that it will stabilize in advance;
Specific operation plan: It is recommended to go long and bullish at 3410, add more positions at 3408, target 3430-3440, stop loss 3400; short near 3443 above, add more positions at 3448, target 3430-3420, stop loss 3455.
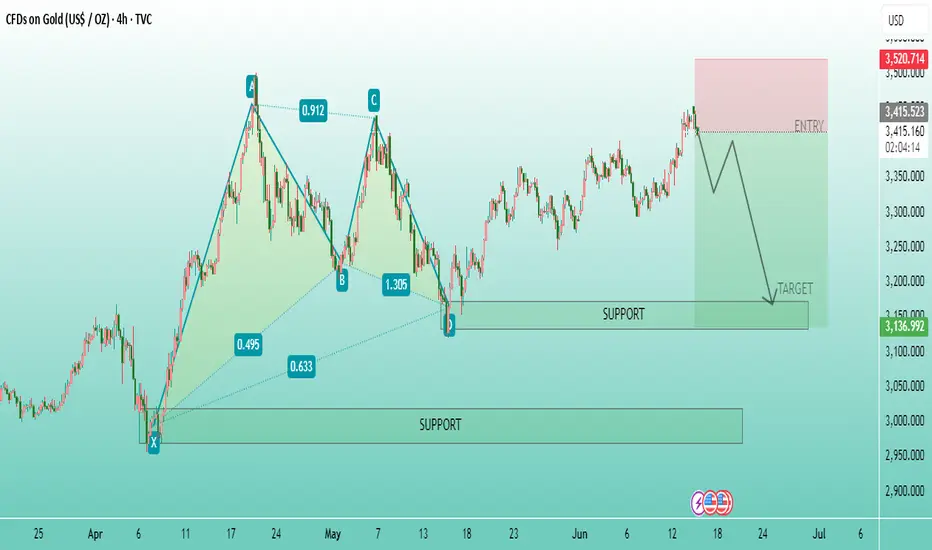
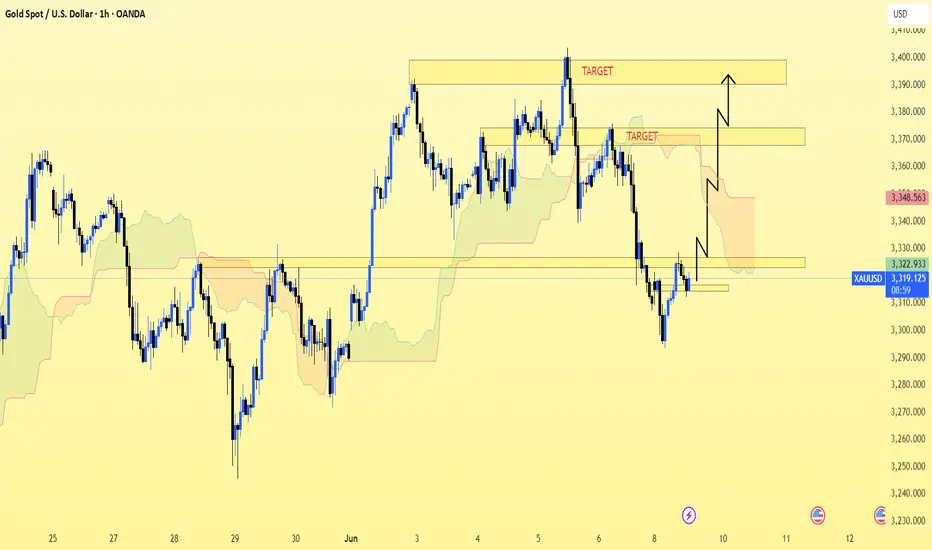
GOLD/USD suggests a potential reversal from point D downward.🟢 Chart Instrument
Symbol: CFDs on Gold (US$/OZ) – XAU/USD
Timeframe: 4H (4-hour candles)
Platform: TradingView
---
📐 Harmonic Pattern
The chart displays a Bearish Gartley pattern, typically identified by the labeled points X-A-B-C-D.
This pattern suggests a potential reversal from point D downward.
Fibonacci ratios are visible:
AB = 0.618 retracement of XA
BC = 0.886 retracement of AB
CD = 1.27–1.618 extension of BC
Pattern completes at point D (where the short trade is suggested).
---
📉 Trade Setup (Short/Sell Bias)
Entry Zone: Around 3,415 – 3,520 USD (highlighted red zone)
Target Zone: Near 3,135 USD (marked “TARGET”)
Stop Loss Zone: Above 3,520 USD (indicated in red box)
Expected Movement: Sharp drop from resistance area to target support zone.
---
🧱 Support Zones
Two key support levels are marked:
1. First target zone at ~3,135
2. Broader support range: 3,000 – 3,080
These support levels are likely areas where price could reverse or consolidate after falling.
---
📆 Timeframe Focus
The projection extends toward Wednesday, June 25, suggesting this is a medium-term swing setup over the coming 1–2 weeks.
---
✅ Summary
Pattern Type: Bearish Gartley
Action Plan: Wait for price to hit entry zone (point D), then short with target at 3,135.
Risk/Reward: Clearly defined with stop-loss and target zones
XAUUSD(GOLD): +1874 PIPS Target| Touching $3600? Gold experienced a significant price surge, driven by the ongoing conflict between Iran and Israel. This heightened uncertainty among global investors led to a price touch of $3445. The current price is accumulating, and we anticipate a strong bullish distribution in the near future. Please prioritise accurate risk management during trading.
Good luck,
Team Setupsfx_
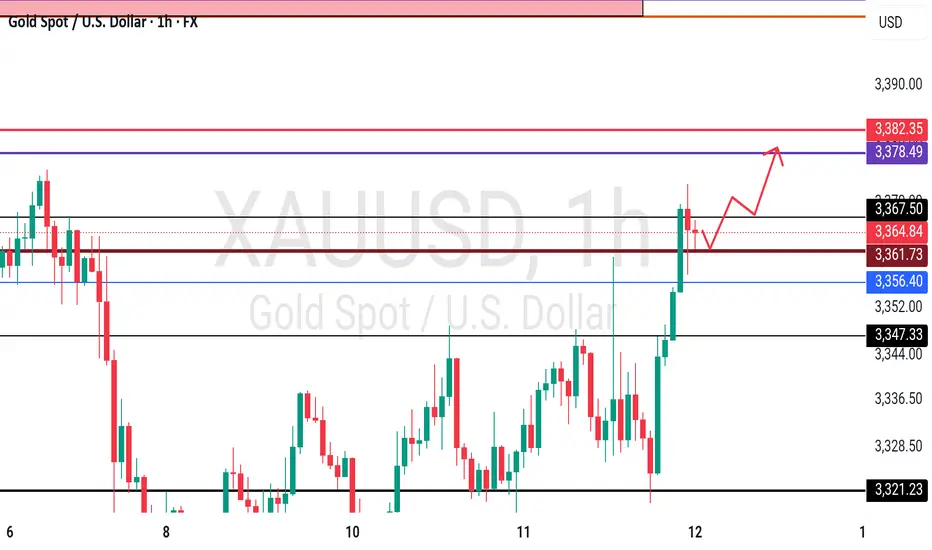
GOLD - at support ? What's next??#GOLD... perfect bounce as per our discussion.
Now market have 3360-61 as immediate supporting area.
Keep close and if market hold it in that case we can expect further push to upside.
Good luck .trade wisley
GOLD/USD – Bullish Reversal Pattern FormingGOLD/USD – Bullish Reversal Pattern Forming 🟢📈
📊 Chart Analysis:
The chart shows a strong Inverse Head and Shoulders pattern forming, which is a classic bullish reversal signal:
🔹 Left Shoulder and Right Shoulder – Marked with orange circles, both found support near the 3,263 level (purple line), suggesting strong buying interest at this zone.
🔹 Head – The lowest point in between the shoulders, also bouncing from support.
🔹 Resistance Zone – Marked with red arrows around 3,500–3,520. This zone has rejected price action multiple times in the past.
🔹 Support Zone – Marked below 3,200, where previous consolidation and buying took place.
📈 Projected Move:
The neckline breakout suggests a potential move toward the 3,520+ level. A minor pullback is expected before continuation. If price breaks above resistance, we could see a strong bullish rally.
📌 Key Levels:
Support: 3,263 🟩
Resistance: 3,500–3,520 🟥
Potential Target After Breakout: 3,550+ 🎯
✅ Bias: Bullish above 3,263 support
⚠️ Invalidation: A break below the neckline would cancel the bullish setup

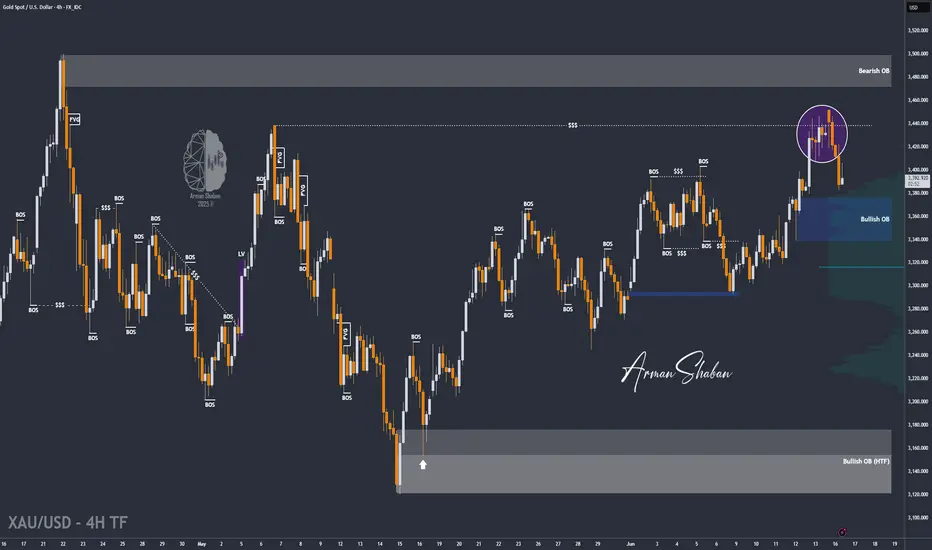
Gold Cooling After Spike – $3375 Key Level to WatchBy analyzing the gold chart on the 4-hour timeframe, we can see that after surging to $3450 amid the Iran–Israel conflict, gold faced a pullback following a liquidity sweep above that level.
Currently, gold is trading around $3392, and after a potential correction down to $3375, I expect to see further upside movement.
⚠️ Stay cautious — gold remains highly volatile and sudden moves are likely!
XAUUSD - Overtrading and Revenge Trading - Trading PsychologyFrom Chaos to Control: Mastering the Art of Balanced Trading on Gold
Trading gold is exhilarating. It’s fast, volatile, emotional — and addictive.
But what most traders don’t realize is this: it’s not the market killing your account.
It’s you, pressing buy and sell like it’s a video game.
Over-trading is the silent account killer. It doesn’t scream. It whispers:
“Just one more entry.”
“Maybe this one will finally run.”
“Let me scalp this quick pullback…”
Before you know it, you’ve taken 12 trades by noon and your brain’s fried.
🧠1. Why Over-Trading Happens: The Dopamine Delusion
Over-trading isn’t just a strategy flaw. It’s chemical. Your brain rewards anticipation of profit — not just actual wins.
So every setup, every near-miss, every “maybe I missed the move” spikes your dopamine.
That’s why you keep clicking. Not because you saw a valid setup.
Because your brain craves the rush of imagining one.
This is why traders enter in zones they never marked, skip confirmation, and rush into impulsive entries.
The market didn’t give a signal. Your nervous system did.
📉2. The Real Damage: Not Just Losing Trades — Losing Discipline
Over-trading ruins more than your account. It ruins your edge.
• You stop following your plan
• You chase liquidity like a gambler
• You get shaken out of clean zones
• You increase risk, just to “make it back faster”
And worst of all? It feels productive.
But profits don’t come from activity. They come from precision.
If you don’t reflect about your actions, you repeat the bad ones.
💸3. The Financial Fallout: Over-Trading Blows Up Accounts
Over-trading nukes your capital.
• One extra trade becomes five
• SL gets wider or invisible because your entry was rushed
• Lot size gets heavier to “speed up” recovery
• Now you’re emotional, and revenge mode kicks in...
You’re not compounding anymore.
You’re compounding mistakes.
This is how smart traders blow up challenge accounts.
This is how funded accounts get revoked.
This is how small accounts die before they grow.
Over-trading is a trap with a $0 exit.
✅4. Tactical Fixes: Trade Smart, Live Smarter
✔️ Set a daily trade cap.
Limit yourself to 2–3 trades. If you keep entering, it’s not analysis — it’s compulsion.
✔️ Split your daily risk.
Risking 0.3% total? That doesn’t mean 0.3% per trade. Break it down, or you’ll break your account.
✔️ Set alerts — not alarms in your brain.
Stop watching every candle like it’s a soap opera.
Set TradingView alerts at your key zones and walk away.
The market doesn’t move faster just because you're glued to the screen.
✔️ Take real breaks — not just chart scrolling.
Go outside. Call someone or send time with family and friends. Eat good food.
Most traders come home from work and go right back into charts like it’s their second shift.
That’s not discipline. That’s burnout.
✔️ Build a life that doesn't revolve around entries.
The more you lose, the more you trade. The more you trade, the more you spiral.
It’s just like alcohol, drugs, gambling. Dopamine up. Reality down.
And the worst part? It looks like hard work from the outside — but it feels like slow death inside.
🧨5. From Over-Trading to Revenge Mode
If over-trading is the first crack in your foundation, revenge trading is the wrecking ball.
And it never starts from logic. It starts from pain.
You had a clean setup.
You got stopped out — maybe twice.
Now you're frustrated, humiliated… embarrassed.
You’re no longer reacting to price.
You’re reacting to loss.
Revenge trading doesn’t feel chaotic in the moment.
It feels righteous.
You convince yourself, “I just need one win to get it all back.”
😵💫6. The Emotional Spiral Traders Don’t Talk About
Over-trading and revenge trading are addictive.
You’re showing up to work. You’re posting charts. You’re pretending it’s fine.
But deep down?
You're wrecked. Emotionally, financially, and mentally.
This is the side of trading no one glamorizes.
The isolation. The loneliness. The pressure. The self-blame.
This is how people burn out — not from one bad week.
But from trying to trade their way out of pain.
⚠️ Final Word
Over-trading is not a badge of hustle.
It’s the first step toward emotional dependence on the market.
And that’s the most expensive habit you’ll ever form.
If you don’t catch it early, you’ll keep blaming the market, the spread, the broker…
when the real damage was done by your own reaction.
The market doesn’t owe you anything.
So be kind to yourself and build discipline, you will win in the long run.
If this lesson helped you today and brought you more clarity:
Drop a 🚀 and follow us✅ for more published ideas.
DeGRAM | GOLD aim to test the lower boundary📊 Technical Analysis
● Hourly price is defending the channel’s lower half: three consecutive wicks bounced at 3 360, forming a descending flag whose base coincides with the dynamic support.
● OBV is edging higher while the flag narrows; a close above 3 408 would unlock the flag-measured move toward the upper rail / horizontal target at 3 444–3 450.
💡 Fundamental Analysis
● World Gold Council reports India’s jewellery demand rebounded 8 % w/w as monsoon concerns eased, while CME data show fresh 6 K-lot COMEX short-covering after the latest FOMC testimony tempered rate-hike talk.
✨ Summary
Long 3 360–3 380; flag break > 3 408 eyes 3 444 → 3 450. Bull view void on an H1 close below 3 343.
-------------------
Share your opinion in the comments and support the idea with a like. Thanks for your support!

XAU/USD.1h chart pattern.
📈 Trade Setup (Long Position on Gold)
Entry: 3320
Target 1: 3370 (💰 +50 points)
Target 2: 3400 (💰 +80 points)
Stop-Loss (suggested): You haven’t specified, but a technical stop-loss around 3290–3300 could be prudent, depending on volatility and timeframe.
Risk-Reward Ratio:
Target 1: 1:2 (assuming 25-point SL)
Target 2: 1:3.2 (approx.)
🧠 Key Considerations
Technicals: Check if 3320 is near a support zone. A bounce from support strengthens the setup.
Fundamentals: Watch for:
Fed announcements
US Dollar Index (DXY)
Inflation data (CPI, PPI)
Geopolitical risks (which can spike gold)
Would you like:
A chart analysis?
An updated gold price?
Risk/reward calculation for your capital?
Let me know how I can assist further.
Gold may rise due to CPI and falling dollarMay CPI in the US rose by 2.4% - just below the forecast of 2.5%. This reinforced expectations of a Fed rate cut despite continued pressure from tariffs. The dollar is weakening, gold may gain in this situation
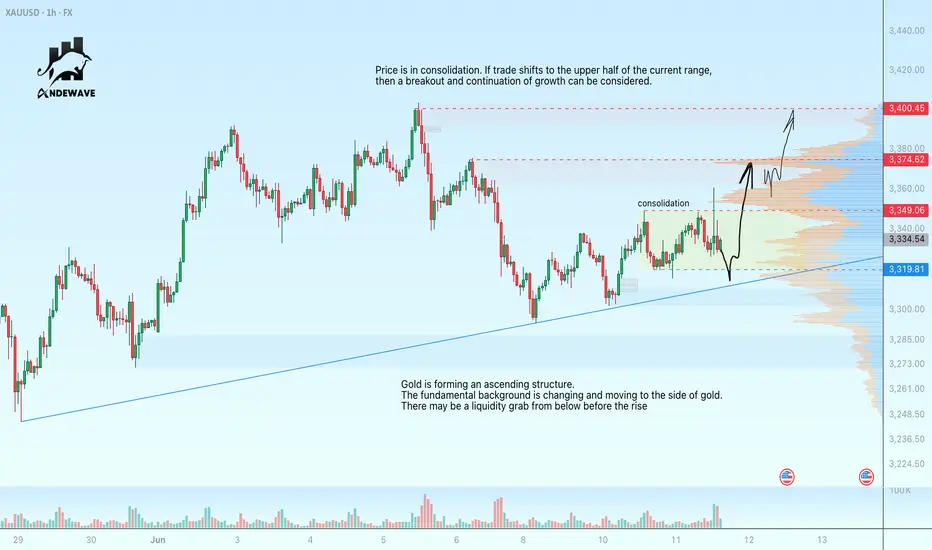
Gold is forming an upward structure. The fundamental background is changing and moving to the side of gold. Before the rise there may be a liquidity grab from below
Price is in consolidation. If trading shifts to the upper half of the current range, then a breakout and continued growth can be considered in this case
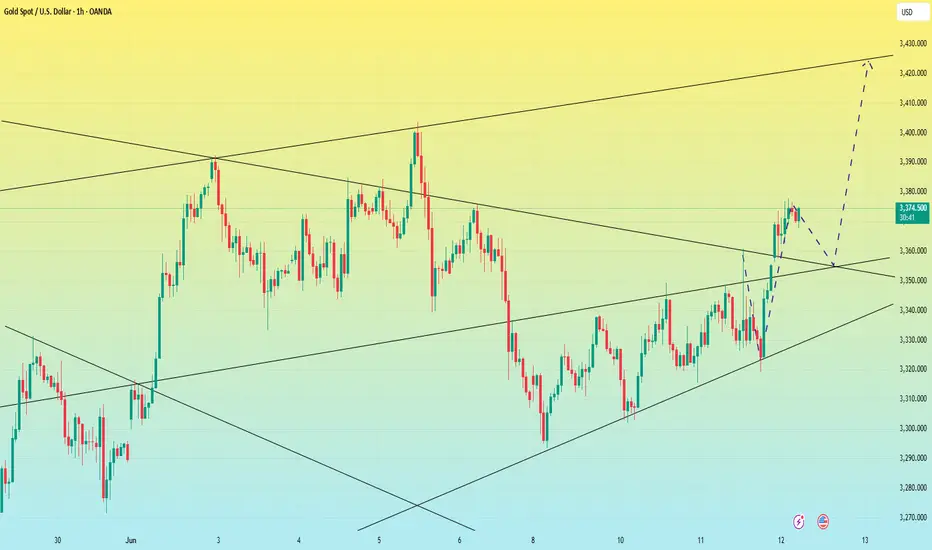
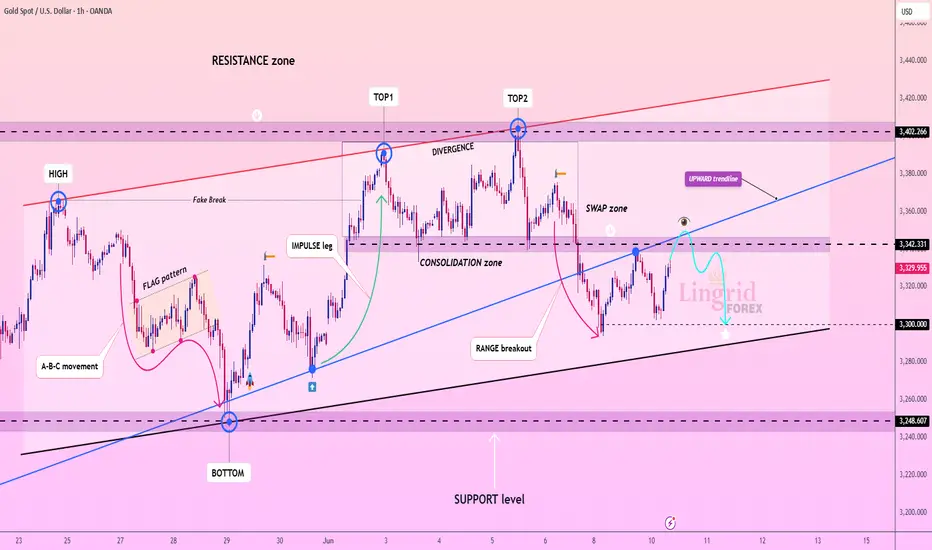
Lingrid | GOLD resistance Swap Zone Shorting OpportunityOANDA:XAUUSD is approaching a critical retest of the broken upward trendline and swap zone near 3342 after failing to maintain resistance above the 3400 area. The prior double top pattern and bearish divergence signal weakening momentum. If the price is rejected at the retest level, a move toward 3300 becomes likely.
📉 Key Levels
Sell trigger: rejection from 3340-3350 with lower high
Buy zone: 3295–3300
Target: 3300 and potentially 3245
Buy trigger: reclaim of 3342 with strong bullish candle
💡 Risks
Breakout above 3342 could reverse structure
Support at 3300 may hold firm on the first test
Weak volume could lead to fake moves in tight consolidation
Traders, if you liked this idea or if you have your own opinion about it, write in the comments. I will be glad 👩💻
Gold Poised for Bullish Continuation Within Rising ChannelGold (XAU/USD) is trading within an ascending channel, indicating a bullish trend. Price recently bounced off the lower boundary of the channel and a demand zone, showing strong buyer interest. The Ichimoku cloud also suggests bullish momentum resuming. A clear breakout above the minor resistance zone aligns with the channel’s mid-line, suggesting price may continue higher. If momentum sustains, a push toward the upper resistance zone is likely. The structure indicates healthy retracement and continuation behavior, supported by institutional buying interest. As long as the channel and support zone hold, bullish continuation remains the most probable outcome in the short term.
Entry: 3330
1st Target: 3375
2nd Target: 3402
If you found this analysis helpful, don’t forget to drop a like and comment . Your support keeps quality ideas flowing—let’s grow and win together! 💪📈
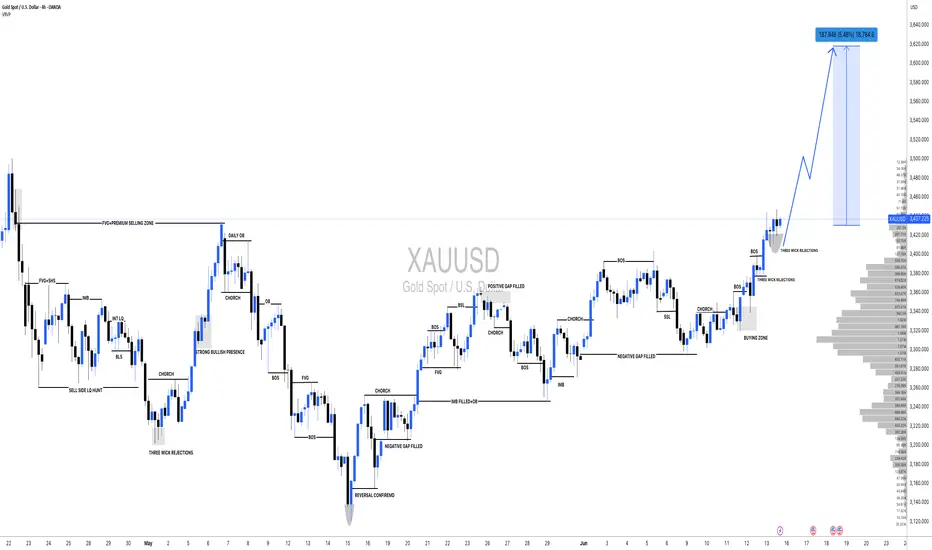
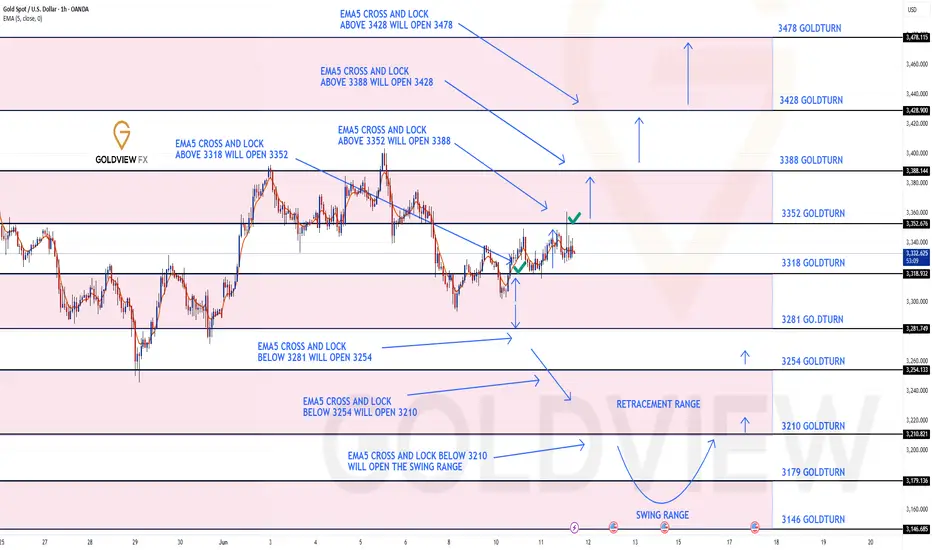
GOLD ROUTE MAP UPDATEHey Everyone,
Another solid day on the charts, with our analysis unfolding exactly as anticipated.
As mentioned yesterday, after the cross and lock above 3318, we identified a gap at 3352 that remained unfilled, acting as a magnet for price action. Since then, price has been consolidating in a tight range between 3318 and 3352.
Today, we saw a perfect move up, completing the target at 3352. From here, we’ll be watching for a confirmed cross and lock above 3352 for a continuation. If price fails to lock above, we could see rejections leading back into the lower Goldturns, where we’ll look for support and bounce.
We will keep the above in mind when taking buys from dips. Our updated levels and weighted levels will allow us to track the movement down and then catch bounces up.
We will continue to buy dips using our support levels taking 20 to 40 pips. As stated before each of our level structures give 20 to 40 pip bounces, which is enough for a nice entry and exit. If you back test the levels we shared every week for the past 24 months, you can see how effectively they were used to trade with or against short/mid term swings and trends.
The swing range give bigger bounces then our weighted levels that's the difference between weighted levels and swing ranges.
BULLISH TARGET
3318 - DONE
EMA5 CROSS AND LOCK ABOVE 3318 WILL OPEN THE FOLLOWING BULLISH TARGETS
3352 - DONE
EMA5 CROSS AND LOCK ABOVE 3352 WILL OPEN THE FOLLOWING BULLISH TARGET
3388
EMA5 CROSS AND LOCK ABOVE 3388 WILL OPEN THE FOLLOWING BULLISH TARGET
3428
EMA5 CROSS AND LOCK ABOVE 3428 WILL OPEN THE FOLLOWING BULLISH TARGET
3478
BEARISH TARGETS
3281
EMA5 CROSS AND LOCK BELOW 3281 WILL OPEN THE FOLLOWING BEARISH TARGET
3254
EMA5 CROSS AND LOCK BELOW 3254 WILL OPEN THE FOLLOWING BEARISH TARGET
3210
EMA5 CROSS AND LOCK BELOW 3210 WILL OPEN THE SWING RANGE
3179
3146
As always, we will keep you all updated with regular updates throughout the week and how we manage the active ideas and setups. Thank you all for your likes, comments and follows, we really appreciate it!
Mr Gold
GoldViewFX
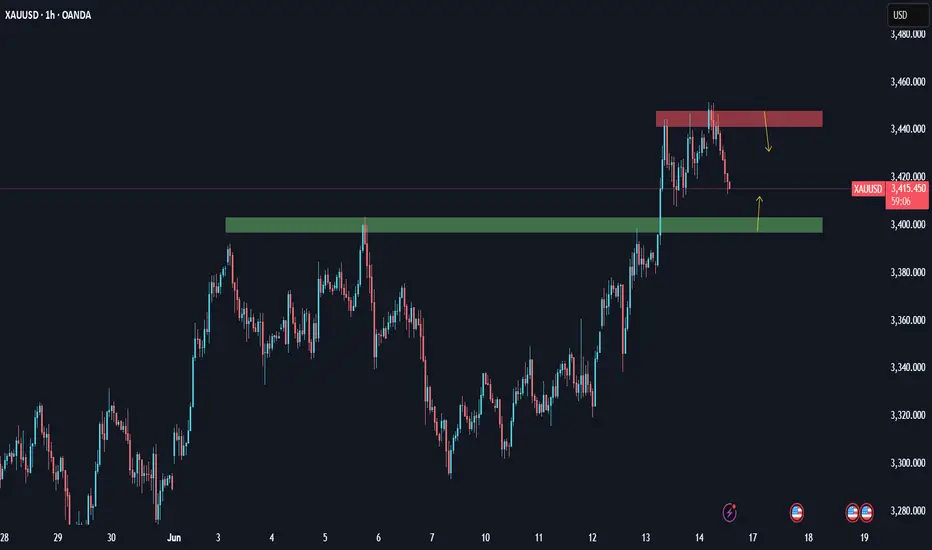
XAUUSD: Analysis June 16Gold has a lot of momentum to increase and could head towards testing the all-time high around 3500 as there are too many risks emerging, from geopolitical developments to interest rate outlook, and tariffs. Major conflicts in the Middle East, Russia - Ukraine, trade war between the US and the rest of the world, ... are all sudden risk support that makes gold likely to surge in the short term.
Gold, after increasing around 3450 this morning, is currently correcting down. But overall, the uptrend with gold is still solid after breaking the downtrend channel. However, we should avoid buying in strong corrections.
The support area around 3400 will be the ideal place for us to BUY today.
And the resistance area 3440 - 3445 will be where we SELL.
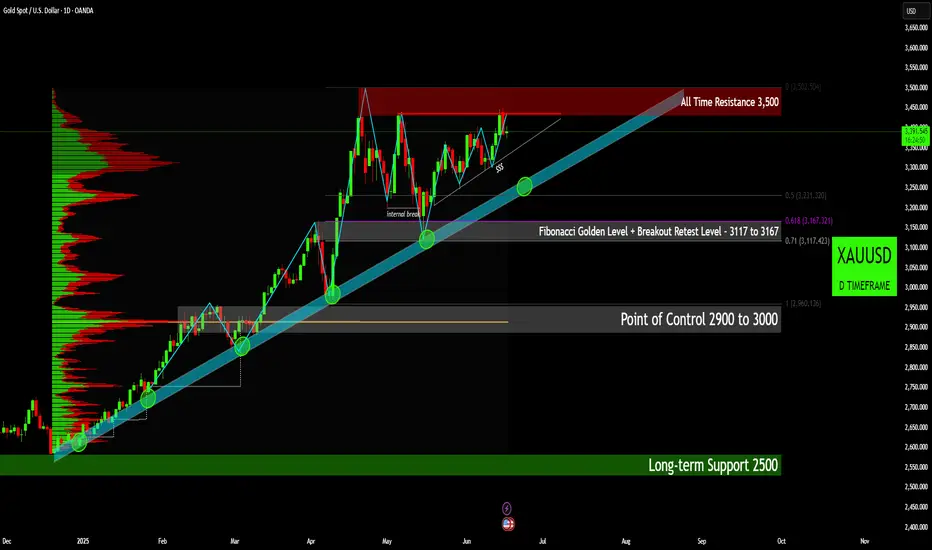
Gold (XAUUSD) Market Outlook - Long Term TrendGold (XAUUSD) Market Outlook: Bullish Trend, Critical Resistance, and Macro Drivers
Technical Analysis:
Looking at the daily timeframe, Gold has been absolutely on fire.
Overall Trend and Market Structure:
• Strong Uptrend: We've seen a remarkably robust and sustained uptrend for Gold since late 2024. It's a textbook example of a healthy rally, consistently printing higher highs and higher lows. This bullish momentum is clear as day, with the candles comfortably riding above that rising blue trendline channel.
• Trendline Support: That prominent blue diagonal band has been a fantastic dynamic support. Gold has bounced off this trendline multiple times (you can spot those green circles), which really solidifies its strength and confirms it as a key support level for this rally.
Key Resistance Level:
• All Time Resistance 3,500: Gold's currently bumping up against a major hurdle: its "All Time Resistance" zone right around 3,500, marked in red. This isn't just a number; it's a huge psychological and technical barrier. Price has poked at this level a few times lately, suggesting there's some serious selling pressure or profit-taking happening up there. A clean, decisive break and close above 3,500 would be a massive bullish signal, likely opening the door to new, uncharted price discovery.
Key Support Levels:
• Fibonacci Golden Level + Breakout Retest Level (3117 to 3167): Now, if we see a pullback, this grey rectangular zone looks like a crucial area of confluence for support.
o Fibonacci Golden Level: This zone perfectly aligns with the 0.618 and 0.71 Fibonacci retracement levels (pulled from that big swing up from the initial low). These are well-known as powerful support and resistance points.
o Breakout Retest: What makes it even stronger is the idea of a "breakout retest." It suggests a previous resistance level that Gold powered through is now expected to act as solid support if tested from above. It’s a classic chart pattern we always look for.
o This entire zone is definitely a critical area to watch if price starts correcting. A strong bounce from here would keep the bullish structure perfectly intact, but a break below it would signal a deeper correction.
• Point of Control (2900 to 3000): This broader grey zone, with the orange line highlighting the exact Point of Control (POC), tells us where the most trading volume occurred over this period (check out the Volume Profile on the left). It's a high-liquidity zone, meaning a lot of buyers and sellers found agreement there in the past. If Gold were to see a more significant correction, this area would likely offer very robust support, simply because so many market participants have a vested interest at these levels.
Volume Profile:
• Glancing at the volume profile on the left, it neatly shows us where the trading action has been heaviest. The big hump around 2900-3000, marked as the "Point of Control," really emphasizes just how important that support area is. What's interesting is the relatively lower volume as we've moved higher, suggesting less resistance on the way up. But if we fall back towards the POC, expect to see trading activity really pick up again.
Price Action & Candlestick Patterns:
• The candlestick patterns consistently show powerful bullish pushes followed by more measured pullbacks. Right now, near the All-Time Resistance, we're seeing some consolidation or perhaps a bit of indecision. The bulls are certainly trying to push through, but they're clearly meeting some stiff resistance.
• That "$" label near the trendline? That often points to areas where liquidity, like clusters of stop-losses or pending orders, might have been "swept" by larger players – a concept often discussed in Smart Money Concepts (SMC).
________________________________________
Fundamental Factors & Macro Impact:
This strong, persistent bullish trend in Gold isn't just random; it's being supercharged by a mix of powerful fundamental and macroeconomic forces:
1. Safe-Haven Demand:
o Geopolitical Tensions: Look around the world – ongoing conflicts like the Russia-Ukraine war and Middle East tensions, plus general geopolitical instability, are sending investors straight to safe havens like gold. It's seen as the ultimate store of value when the world feels unpredictable.
o Economic Uncertainty: There’s a lingering sense of unease about the global economy, whispers of potential recessions, and general market volatility. All of this naturally increases gold's appeal.
o Banking Sector Stability: Any fresh concerns about the health of the financial system or regional banking troubles can instantly boost gold's allure as a secure asset.
2. Inflation Hedge:
o While inflation has eased a bit from its peak, it's still proving quite stubborn in many major economies, higher than what central banks would prefer. Gold has a long history as a reliable hedge against inflation; it tends to hold its value or even increase when fiat currencies lose purchasing power.
3. Central Bank Buying Spree:
o This is a massive, often under-appreciated, driver. Central banks, especially those in emerging markets, have been aggressively buying gold. They're looking to diversify their foreign exchange reserves away from the US Dollar, reduce their reliance on Western financial systems, and simply add another layer of protection against global risks. This consistent, institutional demand provides a very strong underlying bid for gold.
4. Interest Rate Expectations & US Dollar Weakness:
o Federal Reserve Policy: Gold typically moves in the opposite direction of real (inflation-adjusted) interest rates and the strength of the US Dollar.
o Rate Cut Anticipation: Markets are increasingly pricing in interest rate cuts from the Federal Reserve and other major central banks. When interest rates are expected to fall, holding non-yielding gold becomes much more attractive compared to assets that pay less interest. The opportunity cost of gold goes down.
o Weaker US Dollar: A softer US Dollar makes gold cheaper for anyone holding other currencies, which naturally boosts demand. Persistent concerns about the US national debt and fiscal health can also put pressure on the dollar, thereby supporting gold.
5. Global De-dollarization Efforts:
o This also supports in terms of De-dollarization or reducing the country’s dependence on the US Dollar for international trade and as a reserve currency. Gold plays a significant role in this strategic shift, adding another layer to its demand.
________________________________________
Conclusion & Outlook:
Gold (XAUUSD) is absolutely in a powerful, well-established bullish trend, having racked up some impressive gains since late 2024. Right now, it's staring down its "All Time Resistance" at 3,500 – a truly critical moment.
• Bullish Scenario: If we see a decisive breakout and a sustained close above 3,500, it would confirm incredibly strong bullish momentum. This could easily lead to a swift move into new, uncharted territories. We'd expect this to be fueled by ongoing safe-haven demand, continued aggressive central bank buying, and/or growing conviction that significant rate cuts are on the horizon.
• Correction Scenario: On the flip side, a strong rejection from that 3,500 resistance could trigger a correction. We'd likely see it head back towards the trendline support, and possibly even that "Fibonacci Golden Level + Breakout Retest Level" zone (3117-3167). As long as these key support levels hold firm, the overall bullish structure stays perfectly intact. However, a clear break below that golden zone would signal a deeper pullback, with the "Point of Control" (2900-3000) waiting as the ultimate strong support.
From a fundamental perspective, the broader macroeconomic landscape – thinking about geopolitical tensions, persistent inflation concerns, the insatiable central bank demand, and the future path of monetary policy – continues to lean very much in gold's favor. Going forward, traders and investors will be keeping a very close eye on central bank statements, inflation reports, and any new geopolitical developments for the next big cues on Gold's direction.
Disclaimer:
The information provided in this chart is for educational and informational purposes only and should not be considered as investment advice. Trading and investing involve substantial risk and are not suitable for every investor. You should carefully consider your financial situation and consult with a financial advisor before making any investment decisions. The creator of this chart does not guarantee any specific outcome or profit and is not responsible for any losses incurred as a result of using this information. Past performance is not indicative of future results. Use this information at your own risk. This chart has been created for my own improvement in Trading and Investment Analysis. Please do your own analysis before any investments.
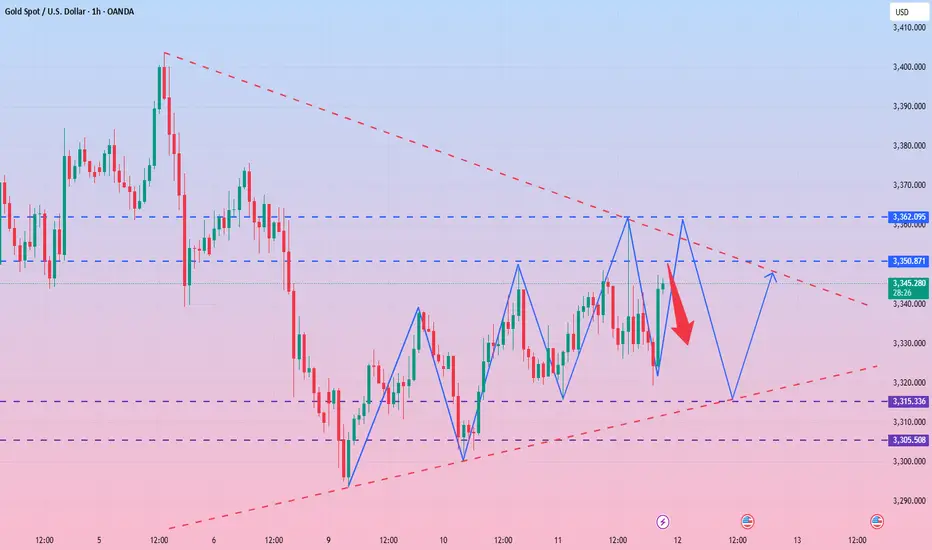
The gold trend is perfectly in line with expectations.The recent trend of gold is consistent with my expectations. Overall, the rebound is mainly based on fluctuating downward, and the rhythm of the oscillation between long and short positions is perfectly grasped. The upper resistance is still strong, and gold can still be shorted if the rebound is not broken.
From the current analysis of the gold trend, the lower support focuses on the area around 3315-3305. If it falls back to this position range, continue to look at the continuation of the rebound upward; the upper resistance focuses on the area around 3350-3362. The overall rhythm of the high-altitude and low-multiple range is still maintained, and the strategy is mainly to participate in the range back and forth.
1. Go long when gold falls back to 3315-3305, and the target is 3330-3340;
2. Go short when gold rebounds to 3350-3360, and the target is 3340-3330.
XAUUSDXAUUSD on a daily its on a uptrend, we will have probably on lowertimeframe a pullback but in mid-term we going for 3500.

Gold surged, what will be the trend today?Information summary:
On Wednesday, the US dollar index plunged during the session as the CPI data that was lower than expected boosted the market's expectations of interest rate cuts. As of now, the lowest point is near 98.2.
After the release of the CPI data, gold rose in the short term and touched the 3360 US dollar mark, and then quickly gave up the gains and retreated to around 3320. However, it rose again due to the sharp escalation of the situation in the Middle East. As of now, the highest is around 3380.
Market analysis:
From the current 4-hour chart:
Yesterday's 3360 pressure level has been broken, and the Asian market has successfully stood above this position in the early trading. Then the suppression position of 3360 has turned into a support level. Therefore, the position we should pay close attention to next should be 3360-3350. If the price falls back to around 3350, it is possible to enter the market and do more. If the price rises again, it is very likely to break through 3400. Once it breaks through 3400, it will most likely reach around 3420.
Secondly, from the hourly chart, there are some signs of head and shoulders bottom. It would be perfect if it can fall back and then go up again. But gold cannot fall below 3345 again. If it falls below 3345 again, it cannot be long.
Operation strategy:
Go long when the price falls back to around 3350, stop loss at 3340, profit range 3375-3400.