Very Strong Short!Hello all. as you see market needs a new lower low. a little above we have an Strong level that in throw the market down. be happy and Trade it if your method confirm. (wink)
GOLD trade ideas

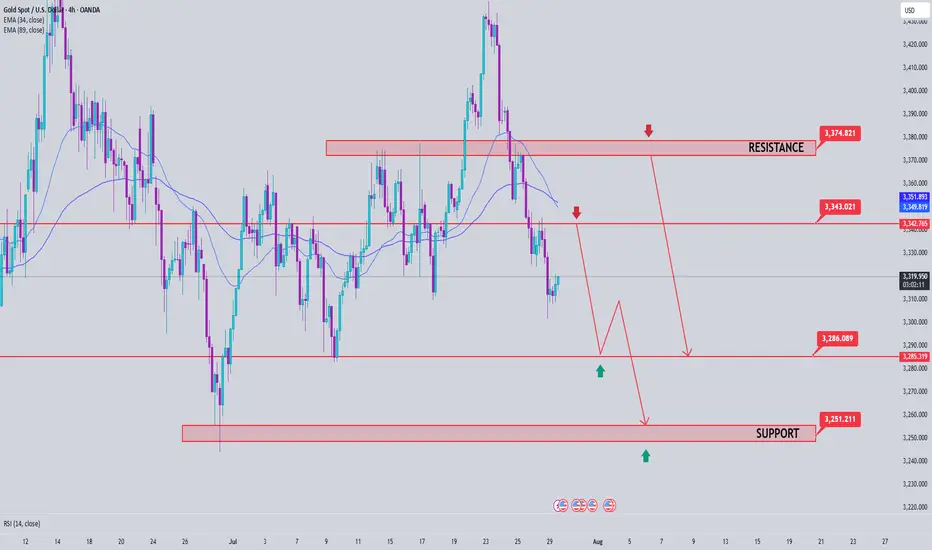
Gold Price Analysis July 29📉 XAUUSD ANALYSIS – IS THE CORRECTION OFFICIALLY STARTING?
Gold has officially broken out of the bullish wave structure and left the rising price channel – an important technical signal that the bearish correction trend has been activated. This development opens up the possibility of retests of the broken trendline, and if that happens in today's session, this could be a good opportunity to look for SELL entry points in the new trend.
📌 Short-term trading strategy:
Potential selling zone: 3343 – 3345
Downside target: 3283 first, followed by the strong liquidity zone around 3250
Confirmation of bearish force: Price continues to maintain below the 3375 area – which will act as an important resistance level. Only when the daily candle closes back above this zone will the uptrend be re-established.
✅ Reverse buying strategy if there is a strong support signal:
Buy trigger zone: Observe the price reaction around the 3285 area - there needs to be a clear bearish rejection signal (pin bar/bullish engulfing candle...)
Deeper buying zone: 3251 - where liquidity is concentrated and there is a possibility of bottom-fishing demand appearing.
Report - 25 jully, 2025U.S.–EU Tariff Negotiations Stabilizing Markets
Reports confirm the U.S. and EU are nearing a deal for 15% reciprocal tariffs—lower than the initially threatened 30% by President Trump. This easing of tensions led to moderate equity gains in both blocs, with the Stoxx 600 reaching a 6-week high before closing +0.2%. Pharmaceutical and auto stocks outperformed (Volkswagen +2.3%, Bayer +2.3%).
Forecast: If the 15% deal is finalized by the August 1 deadline, it would remove a key overhang on equities and boost cyclical sectors reliant on transatlantic trade. A failure, however, risks escalation, triggering retaliatory tariffs by the EU on $93bn of U.S. goods, dragging risk assets sharply lower.
DXY Outlook: Tariff de-escalation boosts safe-haven flows and investor optimism, supporting USD strength.
S&P 500: Short-term relief rally expected if the 15% tariff framework is signed. However, margin compression risks remain from lingering supply chain disruptions.
Tesla vs Trump: Policy Shock Rattles EV Sector
Elon Musk warned that Trump's anti-EV stance and trade war posture will sharply erode Tesla’s regulatory credit revenue and remove the $7,500 EV tax credit. Tesla's stock has cratered 37% since December, with a sharp 8% drop yesterday. Adjusted Q2 net income was down 22%, revenue -12%.
Risk Forecast: Loss of EV subsidies + political fallout between Musk and Trump could drag Tesla further and dampen broader EV sector growth.
XAUUSD: Rising political uncertainty and risks to the U.S. tech sector may drive safe-haven flows into gold.
Dow Jones: Tesla's underperformance and anti-EV policies could limit industrial sector gains.
ECB Holds Rates Amid Trade Risk Fog
The European Central Bank paused its easing cycle, holding the benchmark rate at 2%. Lagarde emphasized a "wait-and-watch" stance, signaling uncertainty due to unresolved trade talks and tariff volatility.
Market Implication: Eurozone government bond yields rose (10Y Bund at 2.70%), paring rate-cut bets. The euro softened to $1.1760.
EURUSD: Lack of further ECB accommodation and weaker consumer confidence amid trade frictions.
Fed Independence in Jeopardy? Market Confidence Wobbles
Pimco warned that White House pressure on Fed Chair Powell—including potential firing and scrutiny over $2.5bn HQ renovations—could destabilize markets. Trump continues pushing for aggressive 1% rates, diverging from current 4.25–4.5% levels.
Fiscal/Political Implication: Undermining Fed autonomy risks flight from U.S. bonds, undermining monetary policy credibility and capital inflows.
USDJPY: Yen may gain if markets lose faith in U.S. institutional integrity, despite rate differentials.
DXY: Temporary support from yields, but structural downside if Fed credibility erodes.
Deutsche Bank and BNP: Diverging Strengths in Volatile Landscape
Deutsche Bank posted its strongest Q2 in 18 years, driven by litigation charge reversals and stable investment banking performance. BNP Paribas also reported solid FICC trading (+27%), though equity trading lagged due to weak derivatives demand.
Equity Implication: Strong capital returns and stable European banking profitability support DAX resilience amid trade noise.
DAX: Boosted by banking and auto outperformance.
China–EU Trade Strains Escalate
Von der Leyen directly confronted Xi Jinping over trade imbalances and support for Russia. EU exports to China are down 6% YoY while Chinese imports to the EU are up 7%. Xi defended Beijing’s stance, warning against "decoupling" rhetoric.
Geostrategic Implication: EU may escalate anti-dumping and export control measures. Markets may see renewed volatility in European industrials and luxury sectors reliant on China.
XAUUSD: Rebalancing of power and heightened East–West tensions favor gold.
Oil Oversupply Warning from TotalEnergies
Total warned of an oil glut due to OPEC+ production increases and weakening global demand. Q2 profits fell 30% YoY. Brent now likely to stay within $60–70 range barring major geopolitical flare-ups.
Crude Oil: Short- to medium-term downside risk with soft demand and oversupply fears.
Energy Stocks: Dividend maintenance remains but debt levels and margin pressures may weigh.
AI Spending Surges – Alphabet and SK Hynix
Alphabet posted a 19% Q2 profit jump as AI integration boosts search volumes. Google’s cloud revenues rose 32%. Capex raised to $85bn. SK Hynix also posted record revenues from high-bandwidth memory chip sales, extending its lead over Samsung.
S&P 500: AI-driven earnings upside bolsters tech sector. Expect multiple expansion in mega-cap AI-exposed names.
XAUUSD : Robust AI investment supports risk appetite but inflationary fears could lift gold marginally.

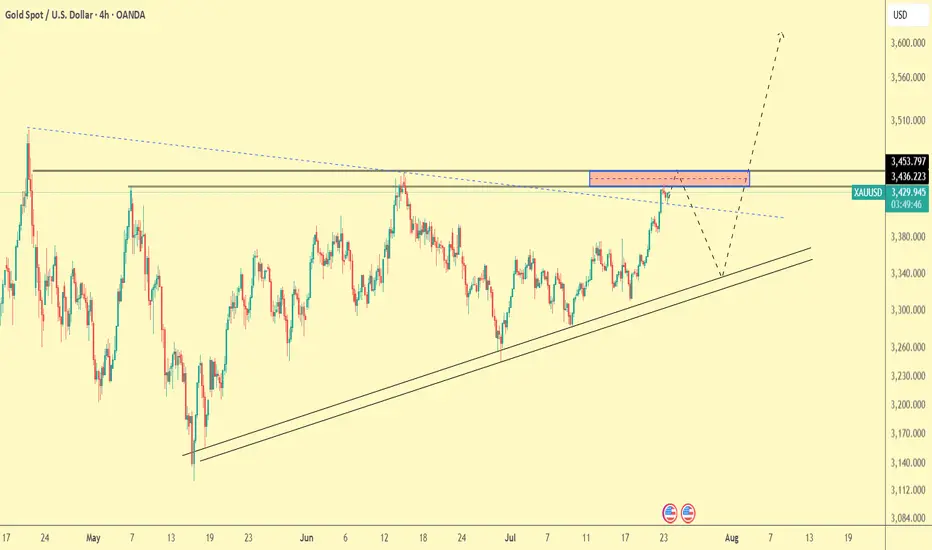
Gold Trade Plan 23/07/2025Dear Traders,
What we see on the chart is that the price is trying to reach the previous pivot around the 3450 area. I expect a correction from this level towards the 3370 area.
Regards,
Alireza!
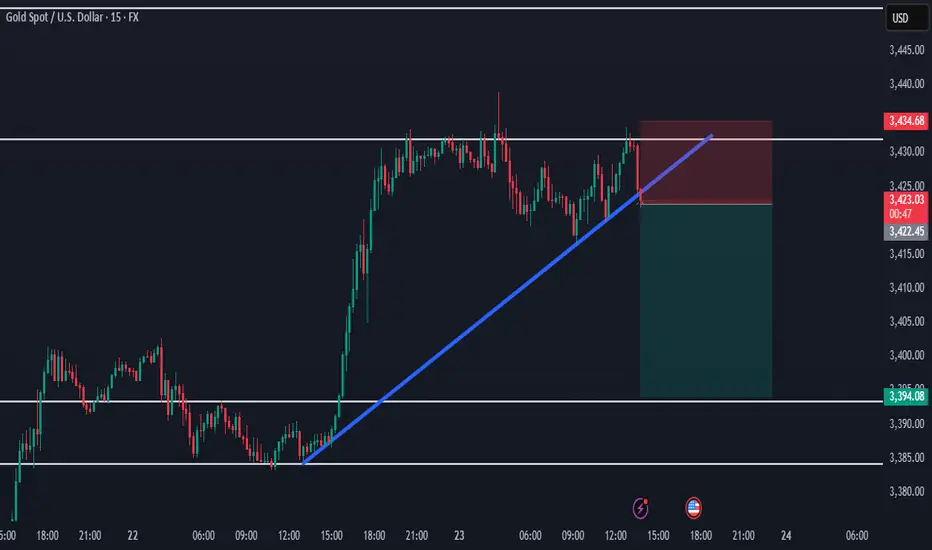
Gold Hits Supply Zone — Short-Term Sell OpportunityHello traders!
Gold has reached a supply zone and is starting to bounce back from it.
With the overall trend still bullish, we can look for a short-term sell position here.
The target is around 3394.
Manage your risk and trade safe!
gold in retracement gold in retracement and will find a strong resistance to continue its downtrend there after.

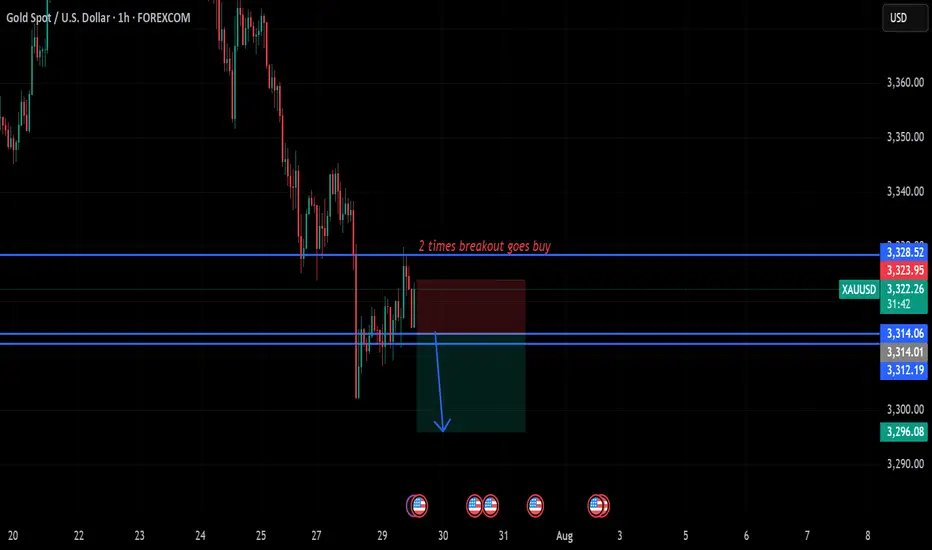
gold on sideways#XAUUSD price await double breakout above 3328.6 for bullish to take place. But now we await for any breakout to take trade.
Below 3314 holds sell continuation, target 3296, stop loss 3324.
Above 3328.6 on 2 times breakout will start bullish till 3340.
XAUAUSD ideaWe are waiting for our asset to reach our action zone, and based on the reaction, we’ll decide on our next moves.ALWAYS WAIT FOR A CONFIRMATION TO SEE IF THE PRICE VALIDATES THE ZONE.and you what is your vision of the EURUSD its interests me! i wait you in the commentary

XAUUSD ShortElite Analysis
Noticed price came to structural liquidity
Obtain confirmations to short
Executed from 3m OB
Targeting Lower liquidity pools, main target London low
Xausd techinical analysis.Xausd techinical analysis next move posibale at h1 time frame not finchinal advice.

Excellent Profit on my Selling ordersAs discussed throughout my Friday's session commentary: "My position: I am Highly satisfied with recent results and will take early weekend break (no need to Trade more). If however you decide to Trade today, Sell every High's on Gold / no Buying until Monday's session (my practical suggestion)."
I have successfully re-Sold Gold from #3,338.80 with set of Selling orders, first batch I have closed around #3,327.80 Support for the fractal and second batch on #3,320.80 / another Support in extension / Highly satisfied with my Profits. I was aware that if Gold invalidates #3,318.80 Support / #3,310.80 extension can follow my Profit was already great to allow myself to Risk more which can backfire anytime.
Technical analysis: Not a bad start of the Trading week overall as the Price-action followed yesterday's session Gravestone Doji reversal formation into series of Bearish Hourly 4 chart’s candles, Gold is settling for a new Higher Low’s within former Hourly 4 chart’s Descending Channel. Despite this, the Weekly (#1W) candle remains on a (# -1.83%) and mostly Bearish values on my instruments. Daily chart continues to pile heavy Selling pressure on Gold so Technically my Short positions will see their value. The current Price-action is exactly on the Higher Low’s Upper zone as there is significantly more potential on the downside and as a results I do expect #3,300.80 psychological benchmark test as current decline is directly correlated with uptrend extension on DX (# +1.03%) and will most likely close the week in green values.
My position: I will continue re-Sells starting with #3,332.80 Resistance and my continuation will be re-Sell every High's on Gold unless Gold closes the market above #3,352.80 benchmark.

The latest trend analysis and layout of the day,flexible adoptio#XAUUSD
⚠️News focus on the Sino-US trade talks, which may affect the gold trend.
Since the opening of the market today, gold has been fluctuating in a narrow range in the short term, without giving a clear trading direction🤔, and the short-term trend has not changed much.📊
🚦It remains constrained by resistance and a downward trend. In the short term, we need to pay attention to the 3300 mark below and the support of 3295-3285📈. On the upside, we should pay attention to the short-term suppression level of 3321-3333 and yesterday's high of 3345-3350.📉
In the short term, as long as it does not break through yesterday's high point, the volatile downward trend will not change. 🐂Once it breaks through, the short-term decline will stop, and the market will continue the bull rebound to test 3370~3380 or even 3400 before falling again.
Therefore, short-term trading focuses on the 3300 mark below and the long trading opportunities at 3295-3285. On the upside, defend the 3345-3350 highs and establish short positions.🎯
🚀 BUY 3310-3330
🚀 TP 3321-3333
🚀 BUY 3295-3285
🚀 TP 3310-3330
🚀 SELL 3320-3330
🚀 TP 3310-3300
🚀 SELL 3345-3350
🚀 TP 3330-3285

Head and shorder Head and shorder
Conformation on three time frame
Take sell on the second shorder formation
Target 1:3
Daily gold analysisDaily gold analysis
A long position with the target and stop loss as shown in the chart
The trend is up, we may see more upside
All the best, I hope for your participation in the analysis, and for any inquiries, please send in the comments.
He gave a signal from the strongest areas of entry, special recommendations, with a success rate of 95%, for any inquiry or request for analysis, contact me

Gold----Sell near 3326, target 3300-3280Gold market analysis:
The recent gold daily line is still weak. It rebounded yesterday and fell again. It has touched the strong support of the weekly line. Today's idea is still bearish. Consider continuing to sell it if it rebounds. It is estimated that it will be repaired if there is support at 3300. The daily line was a cross star yesterday, and the upper shadow line was very long. The daily moving average suppression position was also around 3345, and the suppression position of the pattern was also around 3350. Today, the price is below 3345. We insist on being bearish. This week is a data week. The subsequent trend depends on the release of data. If the data is not strong and the weekly selling signal is added, it is very likely that gold will enter the 3200 era. After the weekly line breaks 3280, it basically opens up the weekly line's downward space, and will start a deep decline in the later period. In the Asian session of gold, we pay attention to the suppression of 3326. This position is the indicator suppression and the small suppression of the pattern. Consider selling it near this position. If it stands above 3326, don't sell it. The repair range will be 3345. Consider selling it at 3345. If the US market cannot break 3300, we should consider whether it will rebound. On the contrary, if it breaks 3300 directly in the Asian market, we should consider selling it directly.
Support 3300 and 3280, suppress 3326 and 3345, and the watershed of strength and weakness in the market is 3326.
Fundamental analysis:
This Monday and Tuesday are relatively quiet, and the big data will be released one by one starting from Wednesday.
Operation suggestion:
Gold----Sell near 3326, target 3300-3280

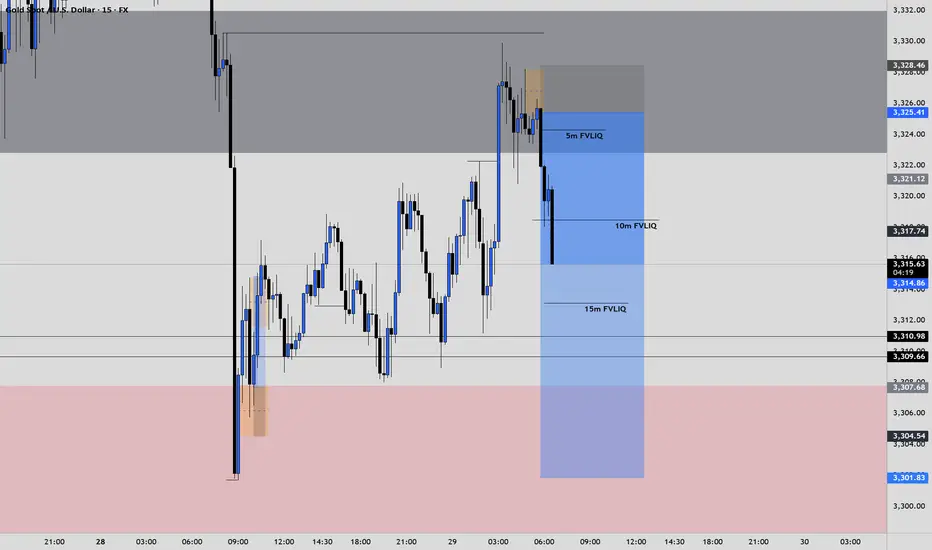
XAUUSD Analysis: Watching 3323.52 as Potential Support-Turn-ResiPrice action on XAUUSD suggests that the 3323.52 level may act as a key area of interest. Following the recent break below a structural low, I am anticipating a possible retracement toward this zone, where it could serve as a support-turned-resistance level.
Should price react to this area and fail to reclaim it, we may see a continuation of bearish momentum driving price lower.
📌 Key Level: 3323.52
📉 Bias: Bearish below this zone
🔍 Confirmation: Watching for rejection or bearish structure on lower timeframes around the level

Gold repeatedly tested lows. Will it break through?On Monday, the Asian market opened low and rose in the early trading. In the European trading, it rose to around 3345. The European trading was under pressure and fluctuated. The US trading began to accelerate its decline, and the lowest point reached around 3302. Then it continued to fluctuate in the range of 3300-3320.
On July 27, the United States and the European Union reached a framework trade agreement; the agreement reduced market concerns about the global economic recession, promoted the attractiveness of risky assets, and boosted the stock market and the US dollar. Although Trump has repeatedly pressured for a substantial interest rate cut, the market has strong expectations for a September interest rate cut. The current expectation of maintaining a stable interest rate dominates the market, coupled with the strength of the US dollar, which puts gold prices under downward pressure in the short term.
Gold opened low in the early trading on Monday and then rebounded to recover the losses, but then fell below the low again, and the daily line closed in the negative, and now it has formed a four-day negative decline. MA5 and 10-day moving averages form a dead cross, and there is a downward turn.
The focus on the upper side is around Monday's high of 3345, which is also near the current position of MA5, 20, and 30-day moving averages. Below this position, gold is weak; if it breaks upward, it is necessary to prevent the possibility of a rebound correction.
The lower support first focuses on the 3300 integer mark; secondly, focus on the area around 3285-3275.
Operation strategy:
Short near 3340, stop loss 3350, profit range 3320-3300;
Long near 3300, stop loss 3290, profit range 3320-3340.
Before the release of US data on Tuesday, you can maintain this operation strategy; after the data is released, adjust the strategy based on the impact of the data.
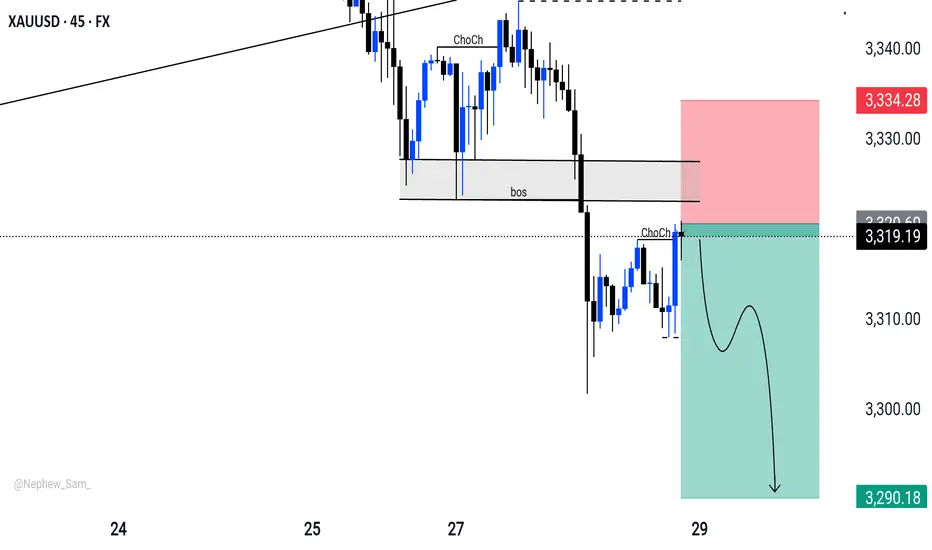
XAUUSD/GOLD 45M OUTLOOK 📉 XAUUSD Breakdown Play
Caught the Change of Character (ChoCh) and confirmed the Break of Structure (BoS) at premium supply.
Price tapped into the zone, printed another ChoCh – now targeting the next liquidity sweep.
🧠 Smart Money never chases – it positions.
📍Sell: 3320 | SL: 3334 | TP: 3290
Risk:Reward = 💰

GOLD BUY In the XAU/USD 2025 Forecast, FXStreet analyst Eren Sengezer suggests Gold’s 2025 outlook depends on Federal Reserve (Fed) policy, Donald Trump’s decisions and geopolitics. A bearish scenario could unfold if geopolitical tensions ease, inflation remains persistent and United States-China trade tensions weaken China’s economy, reducing Gold demand. A hawkish Fed could also pressure prices.
On the bullish side, continued global policy easing, a recovering Chinese economy or escalating geopolitical conflicts could boost safe-haven flows into Gold, supporting its resilience and pushing prices higher.
Gold's technical outlook suggests weakening bullish momentum, with the RSI at its lowest since February and XAU/USD. Key support lies at $2,530-$2,500, with further declines potentially targeting $2,400 and $2,300. On the upside, resistance at $2,900 could limit gains, with additional barriers at $3,000-$3,020 and $3,130 if Gold attempts a new record high.
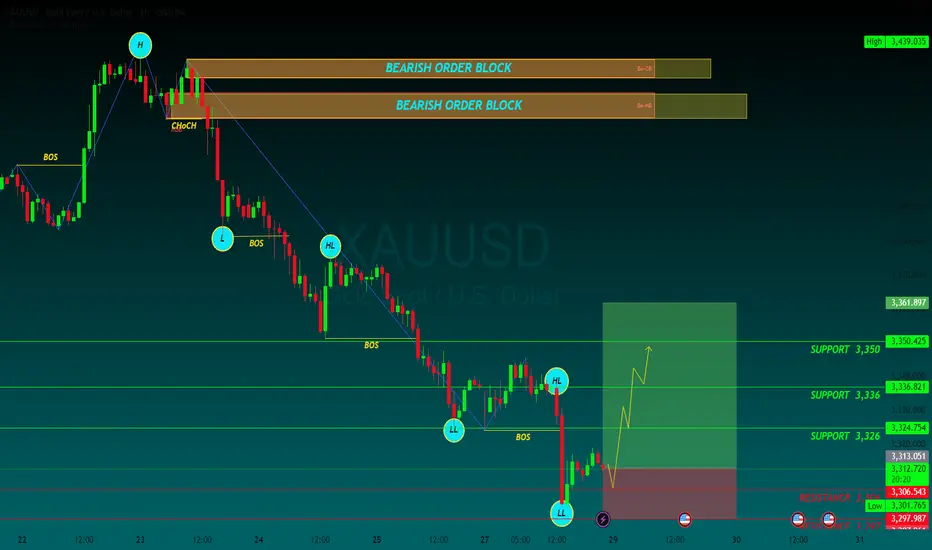
SUPPORT 3,326
SUPPORT 3,336
SUPPORT 3,350
RESISTANCE 3,306
RESISTANCE 3297
July 29, 2025 - XAUUSD GOLD Analysis and Potential OpportunitySummary:
The downtrend continues, but a technical rebound is possible today.
Keep a close eye on the 3310 level — if price holds, bulls may fight back and we look for long setups on pullbacks.
If 3310 is broken, the bearish momentum is likely to extend, and we shift to selling on failed rallies. The next significant support lies at 3283.
🔍 Key Levels to Watch:
• 3384 – Resistance
• 3375 – Key resistance
• 3365 – Resistance
• 3345 – Resistance
• 3320–3325 – Key resistance zone
• 3310 – Critical support
• 3300 – Psychological level
• 3283 – Major support
• 3275 – Support
• 3265 – Support
📈 Intraday Strategy:
• SELL if price breaks below 3310 → target 3305, then 3300, 3290, 3283
• BUY if price holds above 3320 → target 3325, then 3336, 3345, 3350
👉 If you find this helpful or traded using this plan, a like would mean a lot and keep me motivated. Thanks for the support!
Disclaimer: This is my personal view, not financial advice. Always use proper risk control.

Gold is fallingGold is in the neutral zone, and based on the candlesticks on higher time frames, trend line breakouts, etc., I see that it is correcting to the specified zone by the end of the week.

Daily chart gapThis gap will be closed in a week or two. I am gonna hold buy from now. At least set TP at 3400. We'll see if it goes as planned.
