Learn What is PULLBACK and WHY It is Important For TRADING
In the today's post, we will discuss the essential element of price action trading - a pullback.
There are two types of a price action leg of a move: impulse leg and pullback.
Impulse leg is a strong bullish/bearish movement that determines the market sentiment and trend.
A pullback is the movement WITHIN the impulse.
The impulse leg has the level of its high and the level of its low.
If the impulse leg is bearish , a pullback initiates from its low and should complete strictly BELOW its high.
If the impulse leg is bullish , a pullback movement starts from its high and should end ABOVE its low.
Simply put, a pullback is a correctional movement within the impulse.
It occurs when the market becomes overbought/oversold after a strong movement in a bullish/bearish trend.
Here is the example of pullback on EURJPY pair.
The market is trading in a strong bullish trend. After a completion of each bullish impulse, the market retraces and completes the correctional movements strictly within the ranges of the impulses.
Here are 3 main reasons why pullbacks are important:
1. Trend confirmation
If the price keeps forming pullbacks after bullish impulses, it confirms that the market is in a bullish bearish trend.
While, a formation of pullbacks after bearish legs confirms that the market is trading in a downtrend.
Here is the example how bearish impulses and pullbacks confirm a healthy bearish trend on WTI Crude Oil.
2. Entry points
Pullbacks provide safe entry points for perfect trend-following opportunities.
Traders can look for pullbacks to key support/resistances, trend lines, moving averages or Fibonacci levels, etc. for shorting/buying the market.
Take a look how a simple rising trend line could be applied for trend-following trading on EURNZD.
3. Risk management
By waiting for a pullback, traders can get better reward to risk ratio for their trades as they can set tighter stop loss and bigger take profit.
Take a look at these 2 trades on Bitcoin. On the left, a trader took a trade immediately after a breakout, while on the right, one opened a trade on a pullback.
Patience gave a pullback trader much better reward to risk ratio with the same target and take profit level as a breakout trader.
Pullback is a temporary correction that often occurs after a significant movement. Remember that pullbacks do not guarantee the trend continuation and can easily turn into reversal moves. However, a combination of pullback and other technical tools and techniques can provide great trading opportunities.
❤️Please, support my work with like, thank you!❤️
I am part of Trade Nation's Influencer program and receive a monthly fee for using their TradingView charts in my analysis.
GOLD trade ideas
XAUUSDPrice action trading is a methodology where traders make decisions based on the interpretation of actual price movements on a chart, rather than relying primarily on lagging indicators. It involves observing and analyzing candlestick patterns, trend lines, support and resistance levels, and volume to identify potential trading opportunities and manage risk. The focus is on understanding the story the market is telling through its price behavior.
buy idea xauusdxauusd buy scenario
demand created we can long xauusd untill we reach the next supply

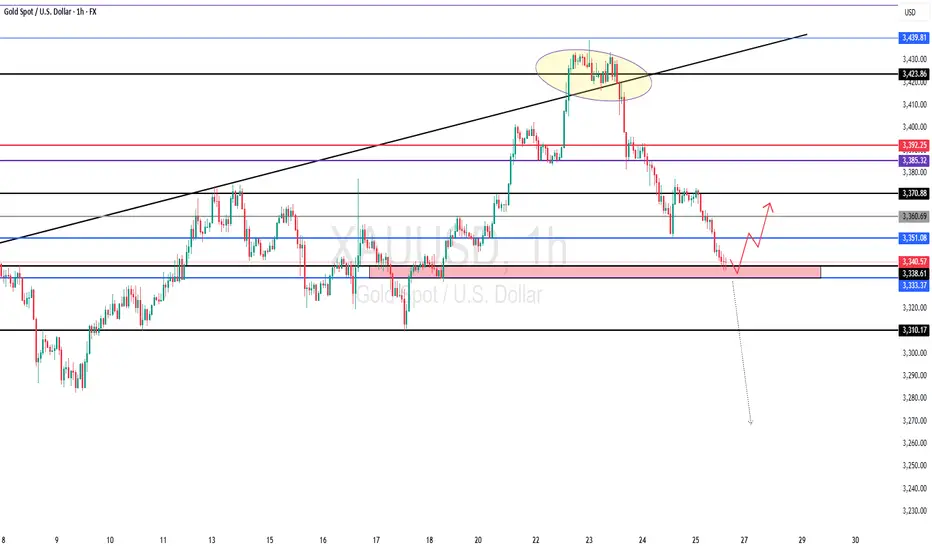
gold bearishgold has not respected any support ony to H4 3351.
will it make its way up from here. only candle stick reaction to tell us.
however the safest trade for today to end the week is shorts.

XAUUSD 4H Has Finished Triangle Pattern #elliotwaveXAUUSD has finished its ABCDE correction in triangle pattern. Price will soon to test the previous $3,500 all time high area. It will required some big news as fundamental to boost the gold price up.
At the time this idea published, price still making lower low and lower high which is the downtrend pattern, but I believe it will soon break the structure and see higher high and higher low as the uptrend confirmation.

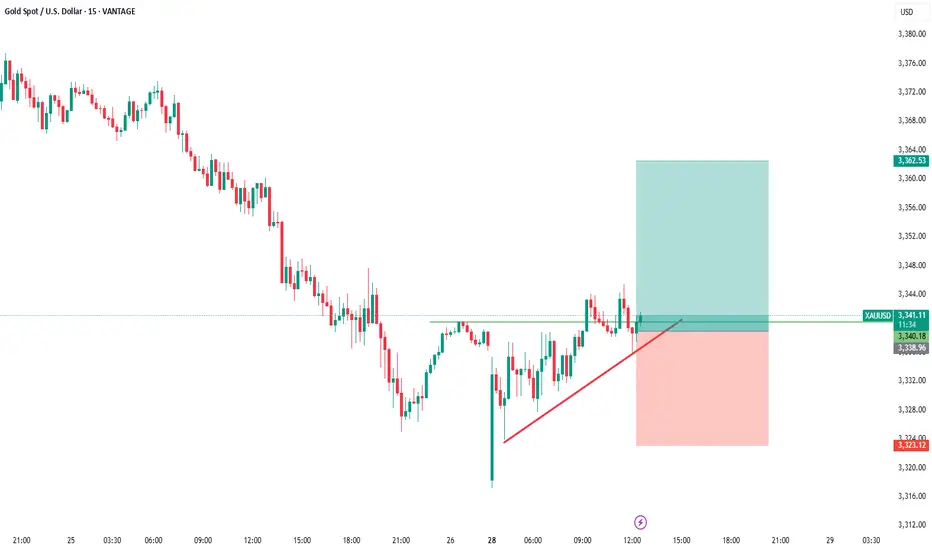
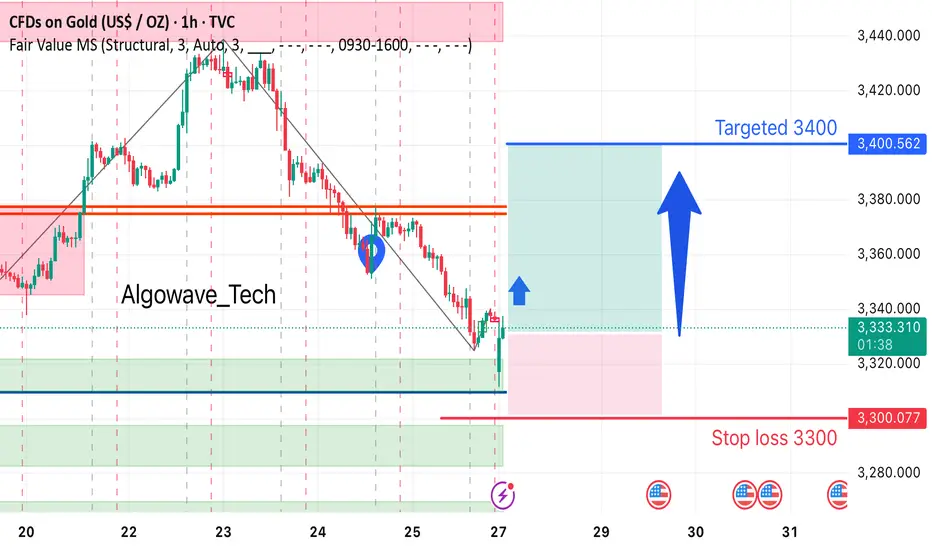
Gold Long Setup Alert!After a clean bounce from a strong demand zone, gold is showing potential for a bullish reversal.
🔹 Entry: Around 3331
🎯 Target: 3400
🛑 Stop Loss: 3300
Price has broken the bearish trendline, indicating possible momentum shift. Eyes on a push towards 3400 if bullish pressure sustains!
#GoldTrading #XAUUSD #AlgoWave_Tech #TechnicalAnalysis #BullishSetup #PriceAction #TradingSignals#Jasonwave_Fx1
XAUUSD about to trade downwardsToo many tries on the higher high created by Gold that have failed , now the price has broken a treblndline from months back signalling a bearish move down to 3000 with few breaks to lead it there if the dollar doent slip, which the decline might take up to November according to how I see the pattern formations

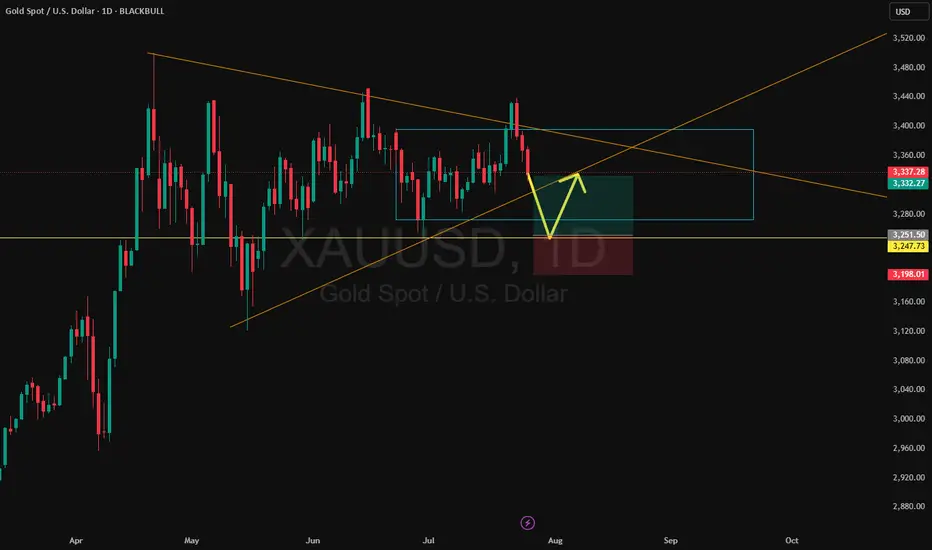
Gold – Range Break Incoming?Gold is still locked in a broad range, but recent price action suggests a possible breakdown. A break below the double bottom opens the door for a move toward the range midpoint.
Gold - The clear top formation!🪙Gold ( TVC:GOLD ) just created a top formation:
🔎Analysis summary:
Over the past four months, Gold has overall been moving sideways. Following a previous blow-off rally of about +25%, this cycle is very similar to the 2008 bullish cycle. Bulls are starting to slow down which will most likely result in the creation of at least a short term top formation.
📝Levels to watch:
$3.000
🙏🏻#LONGTERMVISION
Philip - Swing Trader

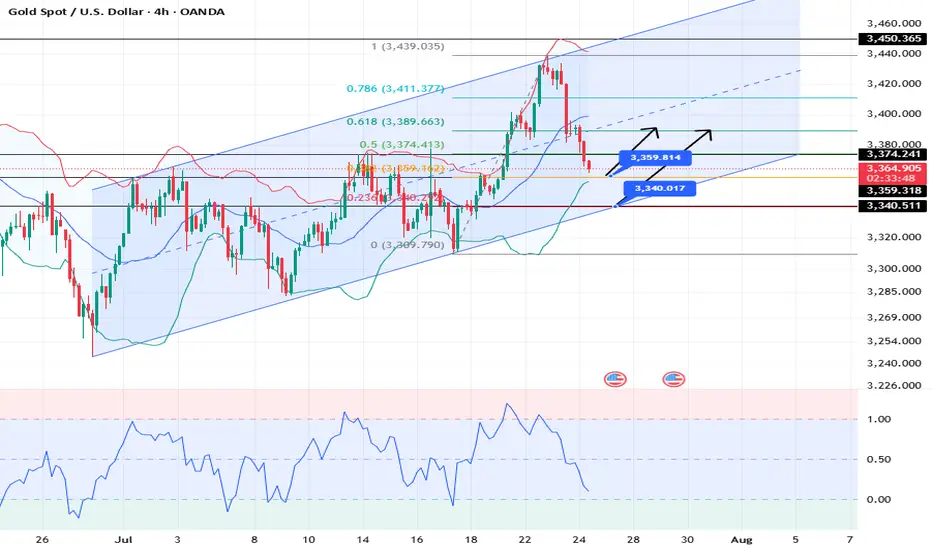
XAUUSD: Market analysis and strategy for July 24.Gold technical analysis:
Daily chart resistance 3440, support 3310
4-hour chart resistance 3390, support 3340
1-hour chart resistance 3375, support 3360.
Yesterday, according to news, the United States and the European Union were close to reaching a trade agreement, which led to the recent risk aversion sentiment to subside, and the bulls took profits. The gold price has fallen by nearly $80 from its peak.
From the current power comparison, the bears are temporarily dominant. Since yesterday, the candlestick chart of the 4-hour chart has completed 6 candles today (2 of which are sideways and 4 are falling sharply). It is expected that it will not rebound until today's NY market trading session.
Gold may reach 3359 or even 3340. At that time, we will observe the stabilization of the candlestick chart. Once the downward momentum is exhausted and it starts to close higher, we can buy. The upper pressure is 3380/3400.
Buy: 3359near
Buy: 3340near
Sell: 3380near
Sell: 3400near
Gold 30Min Engaged ( Bullish & Bearish Reversal Entry Detected )————-
➕ Objective: Precision Volume Execution
Time Frame: 30-Minute Warfare
Entry Protocol: Only after volume-verified breakout
🩸 Accurate Bullish Reversal : 3380
🩸 Accurate Bearish Reversal : 3314.5
➗ Hanzo Protocol: Volume-Tiered Entry Authority
➕ Zone Activated: Dynamic market pressure detected.
The level isn’t just price — it’s a memory of where they moved size.
Volume is rising beneath the surface — not noise, but preparation.
🔥 Tactical Note:
We wait for the energy signature — when volume betrays intention.
The trap gets set. The weak follow. We execute.

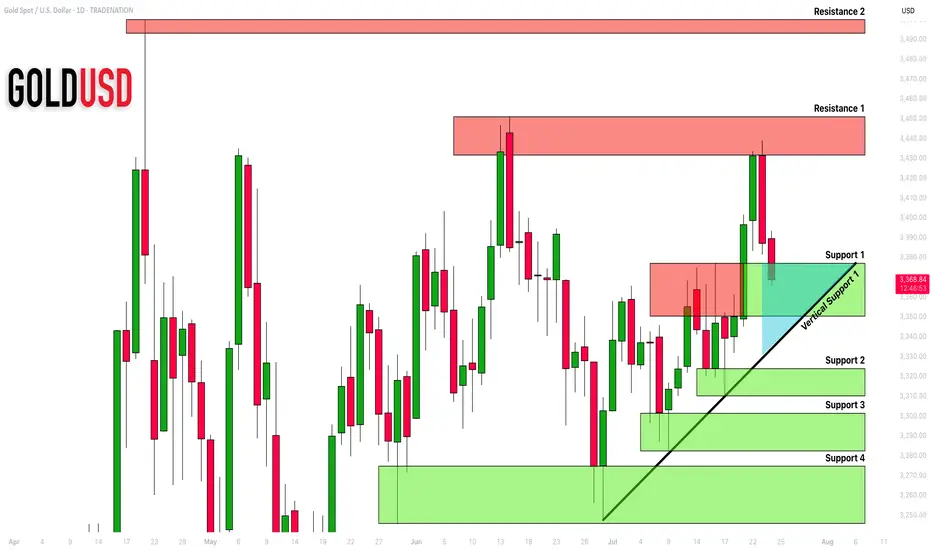
GOLD (XAUUSD): Important Demand Zone Ahead
Gold is currently retracing from a key daily horizontal resistance.
Here are important structures to watch.
Horizontal Structures
Support 1: 3350 - 3377 area
Support 2: 3310 - 3324 area
Support 3: 3282 - 3301 area
Support 4: 3245 - 3374 area
Resistance 1: 3431 - 3451 area
Resistance 2: 3493 - 3500 area
Vertical Structures
Vertical Support 1: rising trend line
Vertical and Horizontal Supports 1 compose a contracting demand zone.
Probabilities are high the price will pull back from that.
❤️Please, support my work with like, thank you!❤️
I am part of Trade Nation's Influencer program and receive a monthly fee for using their TradingView charts in my analysis.
GOLD - at Cut n Reverse Region, whats next ??#GOLD - market just reached at his ultimate area and keep in mind that if market break his current region than it will go further and nose dive..
NOTE: cut n reverse below our mentioned region..
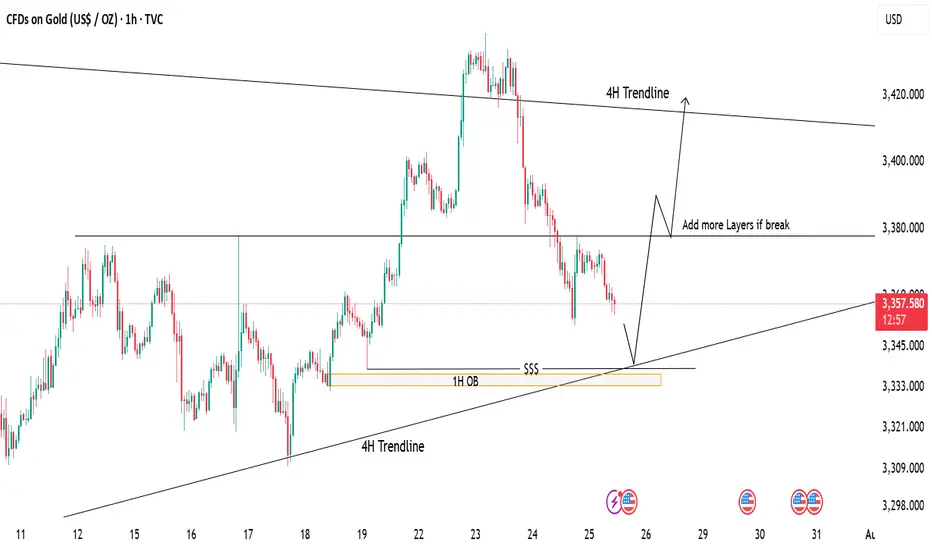
Gold Tapping Into Major Support – Eyes on Bullish ReversalPrice is currently retracing after a strong drop from recent highs. We're now approaching a key demand zone, aligning with:
📍 1H Order Block (OB)
📍 4H Trendline Support
📍 Liquidity Zone ($$$)
📉 If price taps into this area, it may offer a high-probability long setup.
📈 First target: 3380 (mid-range resistance)
🧱 If this breaks, we can look to scale in/add more positions, targeting the 4H trendline zone near 3420.
⚠️ Waiting for price reaction at support – patience is key!
Gold to Take Support Gold at key support level, There is two chances.. where it can grab the liquidity... we will wait and watch... Cheers
Elliott Wave Analysis – XAUUSD July 24, 2025📊
________________________________________
🔍 Momentum Analysis:
• D1 Timeframe: Momentum is currently in a downtrend, indicating that the dominant trend in the short term (at least until early next week) is likely to remain bearish or sideways.
• H4 Timeframe: Momentum has entered the oversold zone and is showing signs of a potential bullish reversal. This suggests that a corrective upward move may occur today.
• H1 Timeframe: Momentum is still declining and is expected to need around two more H1 candles before entering the oversold zone, implying that one more leg down may occur before a recovery begins.
________________________________________
🌀 Elliott Wave Structure Update:
Yesterday’s expectation of a breakout above the resistance zone at 3453 to confirm the start of a new bullish trend did not materialize. Instead, price dropped to the 3374 region, opening up two primary scenarios:
✅ Scenario 1: The correction is still unfolding
• Wave (d) in blue appears to be complete.
• The current leg is likely wave (e), the final leg in a contracting triangle correction.
• In this case, the lower boundary of the triangle and overlapping support zones will serve as key levels to watch for the completion of wave (e).
✅ Scenario 2: Wave 1 of a new bullish trend has completed
• The current decline is wave 2 in a new bullish impulsive sequence.
• The objective here is to identify the bottom of wave 2 to prepare for a potential buy entry into wave 3, which is expected to be stronger and longer than wave 1.
📌 Key difference between the two scenarios:
• Scenario 1 → Wave (e) completes, followed by wave 1 of wave 5.
• Scenario 2 → Wave 2 completes, followed by a powerful wave 3 of wave 5.
________________________________________
🧩 Current Wave Structure:
• A five-wave bearish structure is currently unfolding on the chart.
• According to Elliott Wave Theory, corrective patterns do not typically form five-wave structures.
• Therefore, this is likely wave A in a zigzag (5-3-5) formation.
• Possible targets for wave 5 within wave A:
o Target 1: 3374 – current reaction zone.
o Target 2: 3360 – next significant support level.
________________________________________
📌 Combining Wave Structure with Momentum:
The D1 momentum is firmly bearish, reinforcing the view that the market is undergoing a larger ABC correction.
On the H4 timeframe, momentum is oversold and showing early signs of reversal, aligning with the potential formation of wave B — typically a weak, sideways upward move. The likely resistance zone for the end of wave B lies between 3401 and 3410.
Meanwhile, H1 momentum is still falling and not yet in the oversold zone, suggesting there may be one more move down to complete wave 5. The ideal target for this final leg is around 3360.
Summary:
• D1 bearish → confirms ongoing major correction.
• H4 oversold → supports a potential weak wave B.
• H1 still declining → wave 5 may complete around 3360 before a recovery begins.
________________________________________
💼 Suggested Trading Plan:
For traders with limited experience or those not yet confident in reading live market signals, a Buy Limit strategy at clear support levels is recommended:
• Buy Zone: 3362 – 3360
• Stop Loss: 3352
• Take Profit:
o TP1: 3384
o TP2: 3400
🎯 For experienced traders, it is advised to observe price action at the target support zones and look for real-time reversal signals to optimize entry timing.
