The correction is quite surprise. What direction for GOLD price?✏️Quite surprised with the adjustment of gold at the end of the previous trading week. The rising price channel is still holding around the lower border of the price channel around 3316. A liquidity sweep and candle wick removal in this area is considered a good buying opportunity.
If h1 closes below this border, limit trading BUY signals until the bottom support of 3286. When the price can close the candle below 3316, gold will trade in a wide range and there is no main trend dominating the market.
📉 Key Levels
Support: 3316-3286
Resistance: 3372-3400-3418
Buy trigger: Reject and Trading above 3316
BUY DCA Break 3372
Target: 3400
SELL Trigger: Break bellow and Retest 3416
Leave your comments on the idea. I am happy to read your views.
GOLD trade ideas

Gold Poised to Rise on Looming Russia Sanctions!!Hey Traders, above is a breakdown of the current technical and fundamental setup for Gold, with a focus on key support zones and the macro landscape that could drive further upside.
From a technical standpoint, the first major support area to watch is around 3,334, which previously acted as a strong resistance level. Now that price has broken above it, we could see this zone retested as a support — a classic breakout-retest scenario that may offer a potential bounce opportunity.
The second key zone is located near 3,311, a historically significant support/resistance level. What makes this level even more critical is its confluence with the primary ascending trendline, reinforcing its importance as a structural support in case of a deeper retracement.
On the fundamental side, gold continues to benefit from its role as a safe-haven asset, especially amid rising geopolitical and economic tensions. There are two major catalysts in play right now:
Escalating trade tensions, particularly around new tariffs. Markets are pricing in a high baseline tariff risk of 15%, which adds a layer of uncertainty and supports defensive assets like gold.
Mounting geopolitical pressure on Russia, with the U.S. expected to announce secondary sanctions this week. These could further disrupt global markets and drive demand for hard assets.
In summary, gold is positioned well both technically and fundamentally. If price holds above the mentioned support zones, we could see renewed bullish momentum in the sessions ahead. Keep an eye on developments related to trade policy and sanctions, they could be key drivers of the next move.

Bearish Gold Outlook — Potential Flash Crash Imminent🔻 Technical Structure – Bearish Breakdown Brewing
Lower highs and lower lows forming on the daily and 4H timeframes — classic downtrend mechanics.
Price has rejected multiple times near $3,400–3,430, forming a strong resistance ceiling.
Support at $3,280–3,300 has been tested too many times— and each bounce is weaker. When support holds with less conviction, it's often about to break.
Volume spikes on red candles show smart money is exiting on down moves — signs of institutional distribution.
The **tightening consolidation range** looks like a **descending triangle** — usually resolves downward.
If $3,280 breaks, expect a **liquidity event**. Stops get swept, leading to a **sudden acceleration — possibly a flash crash** to $3,200 or lower.
🌍 **Fundamental Drivers – Macro Picture Is Turning Hostile for Gold**
1. Real Yields Are Climbing
U.S. real yields are up as inflation fades and the Fed stays hawkish.
Gold, being yieldless, suffers when investors can get positive returns from bonds.
2.The Dollar Is Gaining Strength
DXY is pushing higher, fueled by strong U.S. data and weak peers (euro, yen).
Gold priced in USD becomes more expensive globally — this suppresses demand.
3. **Rate Cuts Are Off the Table — or Delayed**
Market is pricing fewer and later rate cuts from the Fed.
This removes one of gold’s biggest bullish catalysts from earlier in the year.
4. Geopolitical Fear Is Cooling
No major escalation in Ukraine, Middle East, or Taiwan.
Without fear, gold loses its safe-haven premium.
5. Central Bank Buying May Have Peaked
Recent data from WGC shows some slowing in central bank accumulation.
If this institutional bid softens, gold could drop hard — few natural buyers remain above $3,300.
⚠️Conclusion: Gold Is Walking a Tightrope
The chart is a staircase down.
Macro fundamentals are no longer supportive.
A clean breakdown below $3,280 could trigger a **chain reaction** of automated selling and margin calls — **a flash crash is on the table**.
This isn’t just a correction — this feels like the calm before the storm.

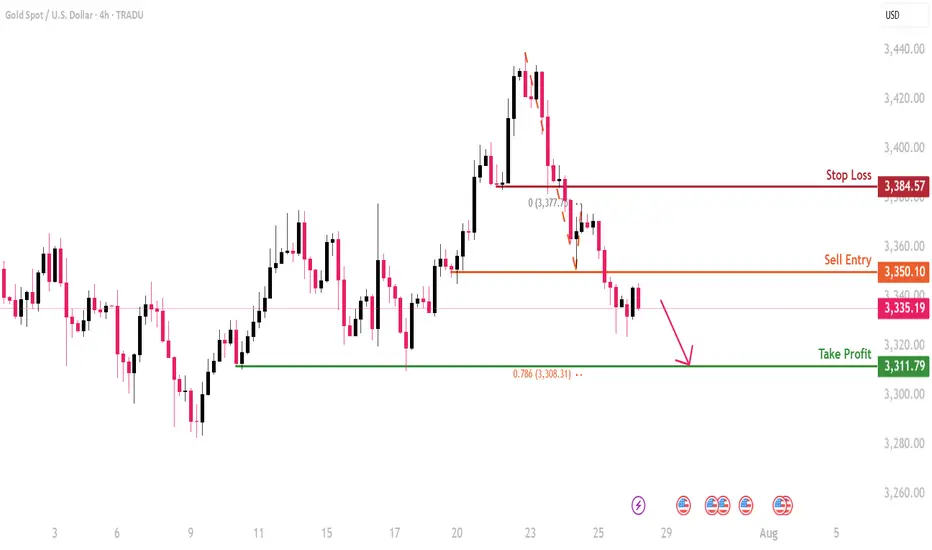
XAUUSD- Bearish Reversal OffBased on the H4 chart analysis, we can see that the price is rising toward our sell entry at 3350.10, which is a pullback resistance.
Our take profit will be at 3311.79, a swing low support level.
The stop loss will be placed at 3384.57, a pullback resistance.
Gold is Falling Sharply – Will It Keep Falling?Hello dear traders, what’s your view on XAUUSD?
Yesterday, XAUUSD continued its strong downtrend and is now trading around 3,296 USD.
The recent drop in gold is largely due to the strengthening U.S. dollar, following the Federal Reserve’s decision to hold interest rates steady as expected — despite sharp criticism from President Donald Trump.
Technically speaking, after breaking below the rising trendline, gold failed to retest successfully and plunged further, confirming that the bearish trend is now in control. Price is currently moving below key moving averages, and the structure has clearly formed a sequence of lower highs and lower lows — reinforcing the likelihood of continued downside.
If a pullback occurs before the next leg down, the Fibonacci 0.5 and 0.618 retracement zone — which aligns with the EMA 34 and 89 and a major resistance level — will be a key area to watch. This could present a prime opportunity for breakout and trend-following traders.
Looking ahead, the next key support sits near 3,220 USD. If this level breaks, gold may head toward the 3,162 USD zone.
What do you think? Will gold keep falling, or will buyers step in? Drop a comment and hit follow to catch the next big move!

GOLD BUYGold maintains its daily gains around $3,300
After retreating markedly on Wednesday, Gold rebounds moderately and remains positive at about $3,300 per troy ounce on Thursday. The precious metal’s rebound comes in response to the daily retracement in US yields across the curve and the so far irresolute price action in the Greenback
The US Federal Reserve kept its benchmark interest rate unchanged for the fifth consecutive meeting, in a range of 4.25% to 4.5%, despite intense pressure from US President Donald Trump and his allies to lower borrowing costs. The decision, however, met opposition from Fed Governors Michelle Bowman and Christopher Waller. This was the first time since 1993 that two governors had dissented on a rate decision.
In the accompanying monetary policy statement, the committee had a more optimistic view and noted that the economy continued to expand at a solid pace. Adding to this, Fed Chair Jerome Powell said during the post-meeting press conference that the central bank had made no decisions about whether to cut rates in September. This comes on top of the upbeat US macro data, and lifted the US Dollar to a two-month high.
Automatic Data Processing reported that private payrolls in the US rose by 104,000 jobs in July, following a revised 23,000 fall recorded in the previous month. Adding to this, the Advance US Gross Domestic Product (GDP) report published by the US Commerce Department showed that the economy expanded at a 3.0% annualized pace during the second quarter after contracting by 0.5% in the previous quarter
SUPPORT 3,346
SUPPORT 3,328
SUPPORT 3,309
RESISTANCE 3,283
RESISTANCE 3,273
Gold (XAU/USD) - Bullish Breakout Opportunity Above Golden ZoneGold (XAU/USD) has recently shown strong bullish momentum, moving upward from a "Strong Support Area" and a lower "Golden Zone." The price is currently consolidating just below a significant resistance area, the 1st TG (Target), which is also labeled as a "Golden Zone." This presents a potential high-probability setup.
My analysis suggests that the current consolidation is a period of accumulation before the next leg of the uptrend. The key to a successful trade here will be a confirmed breakout above the 1st TG. This would indicate that buyers have absorbed the selling pressure at this resistance and are ready to push the price higher.
Bullish Scenario: The primary scenario I'm watching is a breakout above the 1st TG and its corresponding "Golden Zone" resistance. A clear 4-hour candle closing above this area would be a strong bullish signal.
Bearish Scenario: A failure to break the resistance, followed by a sharp move back down below the current consolidation level (1st SUP), would invalidate the bullish thesis and suggest a potential deeper retracement.
Trading Plan:
Long Entry: Enter a long position on a confirmed breakout and close above the 1st TG (Golden Zone) resistance level.
Profit Target 1: The 2nd TG level, which sits at the top of the chart.
Stop Loss: A stop loss should be placed below the 1st SUP level to protect against a false breakout or a reversal.

Hellena | GOLD (4H): LONG to resistance area of 3448 (Wave 3).Dear colleagues, it seems that wave “2” has been formed and now we are seeing the development of wave ‘3’ of the higher order and wave “3” of the middle order.
I think we will see an update of the maximum of wave “1” at 3448.90. A slight correction to the support area of 3341.74 is possible, but there is also a possibility of a continuation of the upward movement without correction.
The target is the resistance area of 3448.
Manage your capital correctly and competently! Only enter trades based on reliable patterns!

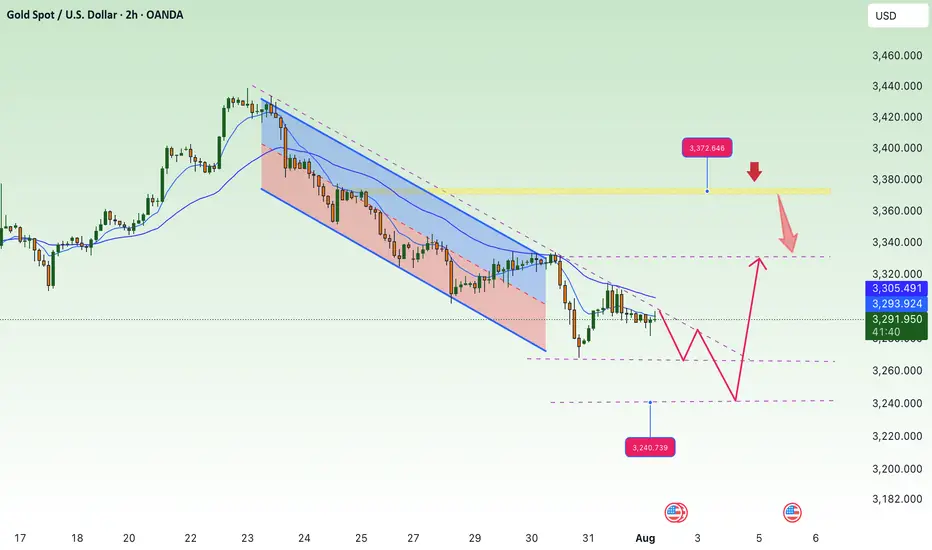
Gold next prediction Aug 4 onwardsAs you can see in this chart gold was moving in a downtrend channel and after a big breakout in Non-Farm Gold moves to 3362 so now it will make a new Bullish channel in which first hurdle will be 3374-3380 and then can retrace till 3H and 4H chock point and then can continue to bullish side overall move can be done upto 3452-3460 which is last resistance of the market as my analysis this can be plan A.I will update about Plan B in my next analysis.

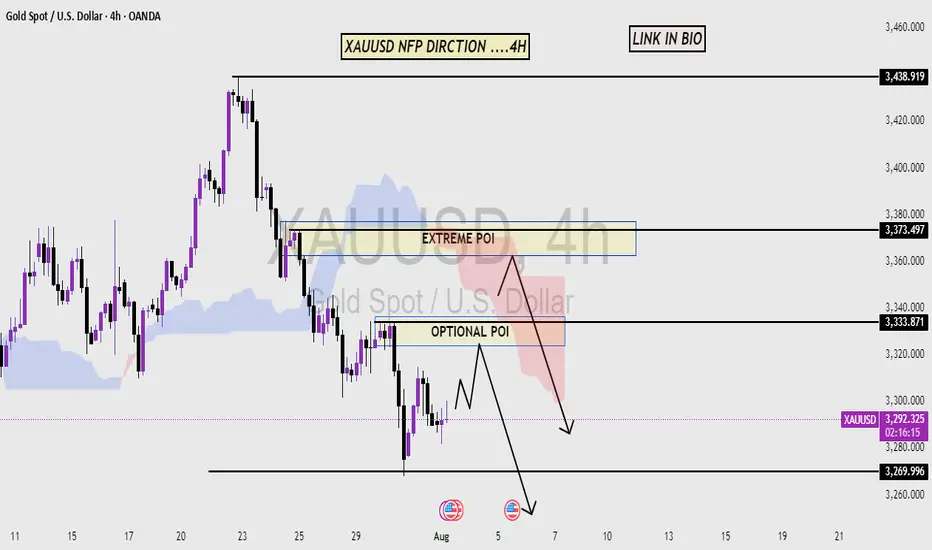
XAU/USD GOLD NFP DIRECTIONThis chart analysis is for XAU/USD (Gold vs. U.S. Dollar) on the 4-hour timeframe. The focus is on a bearish market structure, highlighting potential Price of Interest (POI) zones for a short (sell) setup.
Key Elements:
Market Structure: Clear downtrend with lower highs and lower lows.
POIs Identified:
Optional POI: An initial supply zone where price might react.
Extreme POI: A more significant supply zone marked for a stronger potential reversal.
Labels & Notes:
The price levels are marked between 3,320 – 3,340, showing where the reversal is expected.
Interpretation:
The chart anticipates a retracement upward into the POIs before continuing the bearish move. Traders may look to enter short positions around these zones, especially the Extreme POI, which is seen as a high-probability reversal area.

XAUUSD – Bullish Reversal or Just a Deep Correction?Last week was a wild one for Gold.
After a quiet start and some choppy price action, the market dropped hard on Wednesday, breaking not only the 3300 key level but also the 3280 horizontal support — and what followed was anything but calm.
As expected after a strong move, the price pulled back to retest the broken support.
But Friday changed everything.
Instead of continuing down, Gold reversed sharply, fueled by weaker-than-expected NFP data. Price surged 800 pips from low to high, breaking above both the 3310 resistance zone and the weekly high around 3335.
________________________________________
🧭 Key Question:
Are we back in the bullish trend, or is this just a strong correction of the 3440 → 3270 drop?
Since May, Gold has lacked a clear trend — so a step-by-step trading approach is the most advisable to adopt.
________________________________________
🔍 Outlook:
Given the strength of the reversal and the break above two important resistance levels, my bias is bullish.
• 📌 Support: 3335 — a pullback into this zone could offer a buy opportunity in line with the recent momentum.
• 📌 Resistance: 3375 is the next key level to watch.
• ❌ Invalidation: A drop below 3310 would cancel the current bullish scenario.
🧠 Final Thoughts
Gold’s recent move challenges both bulls and bears.
Yes, the bounce was strong. Yes, key resistance levels broke.
But with no clear trend since May, chasing long term direction can be risky.
That’s why a step-by-step approach is the most advisable to adopt — let the market confirm each move before committing to the next.
For now, the breakout above 3310 and 3335 leans the bias to the upside.
However, staying reactive — not being stuck with an idea — is the smartest approach.
Disclosure: I am part of TradeNation's Influencer program and receive a monthly fee for using their TradingView charts in my analyses and educational articles.

Accurate Price Model for Trading Smart Money Concepts SMC (=
If you trade Smart Money Concepts SMC, there is one single pattern that you should learn to identify.
In this article, you will learn an accurate price model that you can use to predict a strong bullish or bearish movement way before it happens.
Read carefully and discover how to track the silent actions of smart money on any market.
The only thing that you need to learn to easily find this pattern is basic Structure Mapping . After you map significant highs and lows, you will quickly recognize it.
This SMC pattern has 2 models: bullish and bearish ones.
Let's start with a bearish setup first.
Examine a structure of this pattern
it should be based on 2 important elements.
The price should set a sequence of equal lows.
These equal lows will compose a demand zone.
The area where a buying interest will concentrate.
The minimum number of equal lows and lowers highs should be 2 to make a model valid.
Exhausting of bullish moves will signify a loss of confidence in a demand zone . Less and less market participants will open buy positions from that.
At some moment, a demand zone will stop holding. Its bearish breakout will provide a strong bearish signal , and a bearish continuation will most likely follow.
This price model will signify a market manipulation by Smart Money.
They will not intentionally let the price fall, not letting it break a demand zone. A buying interest that will arise consequently will be used as a source of liquidity.
Smart money will grab liquidity of the buyers, silently accumulating huge volumes of selling orders.
Once they get enough of that, a bearish rally will start, with a demand zone breakout as a trigger.
Though, the chart model that I shared above has a strong bullish impulse, preceding its formation, remember that it is not mandatory.
The price may also form a bearish impulse first and for a pattern then.
Each bullish movement that initiates after a formation of an equal low should be weaker than a previous one.
So that the price should set a lower high every time after a formation of an equal low.
Look at a price action on USDCHF forex pair. Way before the price dropped, you could easily identify a market manipulation of Smart Money and selling orders accumulation.
A breakout of a horizontal demand zone was a final bearish confirmation signal.
Let's study its bullish model.
It has a similar structure.
The price should set a sequence of equal highs, respecting a horizontal supply zone.
Each bearish move that follows after its test should have a shorter length, forming a higher low with its completion.
This model will be also valid if it forms after a completion of a bearish impulse.
Weakening bearish movements will signify a loss of confidence in a supply zone, with fewer and fewer market participants selling that.
Its bullish breakout will be an important even that will confirm a highly probable strong bullish continuation.
Smart Money will use this price model to manipulate the market and accumulate buying orders, not letting the price go through a supply zone. They will grab a liquidity of the sellers each time a bearish move follows from a supply zone.
When they finally get enough of a liquidity, a bullish rally will initiate and a supply zone will be broken , providing a strong confirmation signal.
That price model was spotted on GBPJPY forex pair.
Smart Money were manipulating the market, not letting it continue rallying by creating a significant horizontal supply zone.
Selling orders that were executed after its tests provided a liquidity for them.
A bullish breakout of the underlined zone provides a strong bullish confirmation signal.
A breakout and a future rise could be easily predicted once this price model appeared.
Why they do it?
But why do Smart Money manipulate the markets that way?
The answer is simple: in comparison to retail traders, they trade with huge trading orders . To hide their presence and to not impact market prices much, they split their positions into a set of tiny orders that they execute, grabbing the liquidity.
The price model that we discussed today is the example how they do it.
The important thing to note about this pattern is that it efficiently works on any market and any time frame. You can use that for scalping, day trading, swing trading. And it can help you find great investing opportunities.
❤️Please, support my work with like, thank you!❤️
I am part of Trade Nation's Influencer program and receive a monthly fee for using their TradingView charts in my analysis.
The price of gold is set to rise again!Gold is on the way hitting a record high since the global tension rising we can see gold creating another record high. Please note that it is a swing trades and may take weeks and months to hit the target or it may not even reach the target itself.

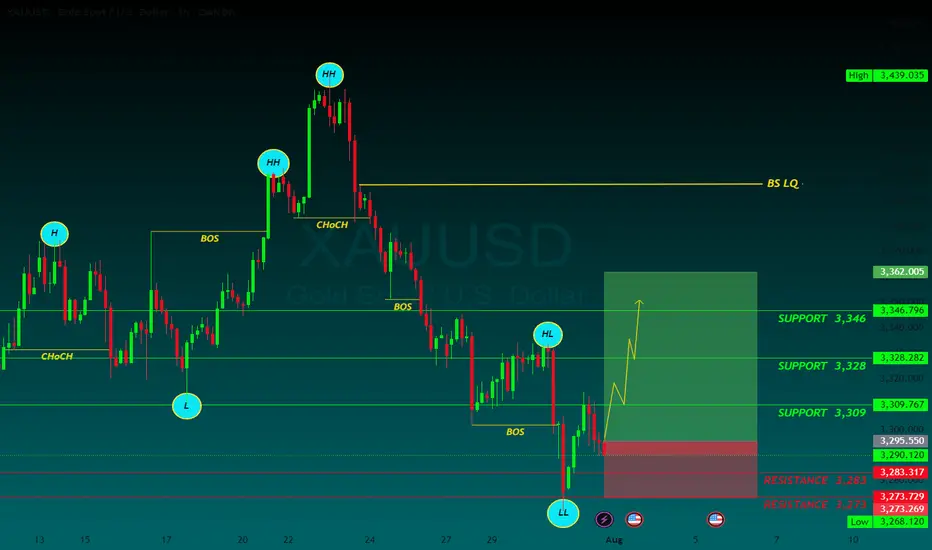
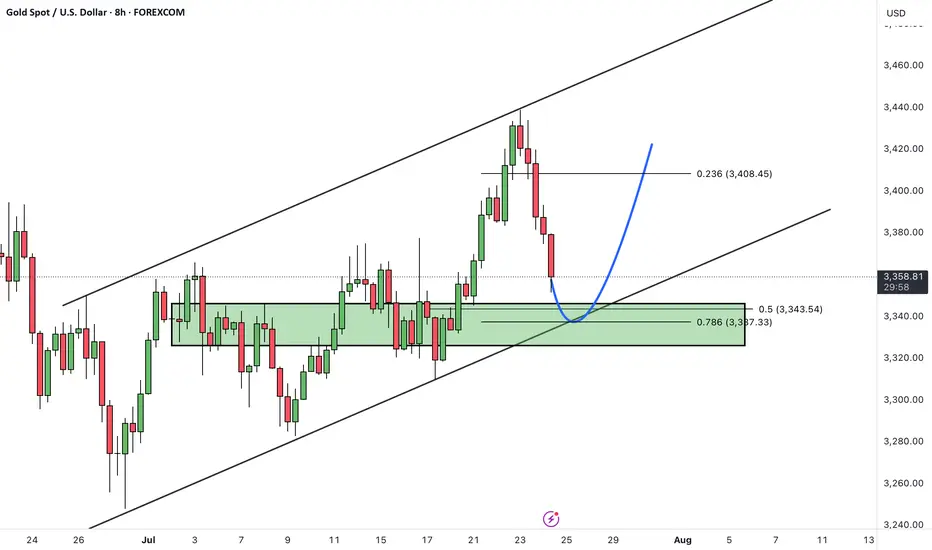
XAUUSDHello Traders! 👋
What are your thoughts on GOLD?
Gold entered a corrective phase after reaching the top of its ascending channel. Price is now approaching the channel bottom, which coincides with a key support zone.
As long as the channel support holds, we expect a bullish reaction from this area, potentially driving price back toward the next target level.
The uptrend remains valid as long as price does not break and close below the lower boundary of the channel.
A rebound from channel support may signal the start of the next upward leg.
Invalidation occurs only if price breaks and holds below the channel.
💡 Will gold bounce from channel support and resume its rally? Share your view in the comments! 🤔👇
Don’t forget to like and share your thoughts in the comments! ❤️
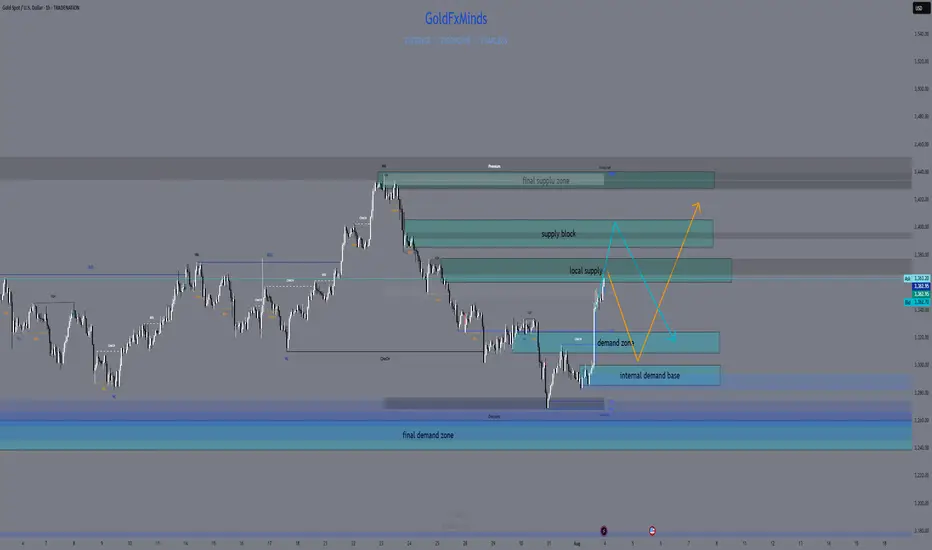
XAUUSD Daily Sniper Plan – August 4, 2025🧠 Macro & Context
Gold is surging back toward premium structure after sweeping 3287. With no major news today, flow is dictated by structure, liquidity, and the residual strength from July’s closing push. Bulls have reclaimed internal control, but are now pressing into major resistance zones. This is the perfect battleground for sniper entries.
🔥 Bias: Bullish short-term, but hitting premium exhaustion
The current candle is testing prior supply and imbalance. Unless we break 3375–3380 cleanly, price remains vulnerable to rejection from premium. Above that, clean air until external zones. Any pullbacks into discount (under 3310) remain buyable — if the structure holds.
🎯 Daily Sniper Zones
🔷 3360–3375 – Decision Supply
📍 Where we are now
This is the current premium pressure zone. Built from a bearish OB + unmitigated imbalance from late July. First contact is live. If price rejects this level, sellers may regain control short-term. But if buyers break and hold above 3375 → bullish expansion is open. This is our Decision Zone.
🔷 3387–3405 – External Supply Block
📍 Premium target for breakout move
Clean HTF OB + imbalance resting above liquidity. If 3375 gives way, this is the next sniper target. Expect strong reaction — either reversal or inducement wick. Ideal for shorts if price shows exhaustion and BOS on LTF.
🔷 3430–3439 – Final Supply Cap (Weekly)
📍 Extreme supply wick
This is the highest defined zone on the Daily/Weekly chart before unknown territory. Full wick zone, untouched since early May. Reactions from here tend to be sharp. A strong rejection could initiate a new sell cycle.
🔷 3310–3325 – Mid-Demand Support
📍 Pullback buy zone
If price rejects 3375 and pulls back, this is the first area to monitor for higher low formation. Built from bullish OB, Fibonacci 50%, and alignment with internal structure. RSI supports buyers here if retested cleanly.
🔷 3285–3300 – Key Reversal Demand
📍 The origin of the current rally
Strong institutional footprint. Last BOS + OB confluence area. Any retest here is valid for sniper buys as long as no bearish HTF shift appears.
🔷 3240–3260 – Final Daily Demand Base
📍 Only valid if structure breaks down
If we lose 3285, this is the last demand zone holding Daily structure. Deep discount + HTF mitigation block. A visit here would require bearish breakdown first.
🧠 Game Plan Summary
⚠️ Right now, we are in a decision zone (3360–3375). Do not rush. Wait for confirmation.
✅ If we break 3375, next bullish target = 3405, then 3439.
🔻 If we reject 3375, watch for controlled retracement into 3325 or 3300 for buys.
⛔️ Do not sell blindly into current price — we are at equilibrium.
💬 If this sniper breakdown sharpened your vision, show some love ❤️
Comment, follow, and hit that like to stay locked in with GoldFxMinds.
More sniper updates dropping 💥
Powered by Trade Nation – for clear structure and no chart noise.
NF news, can gold selling pressure drop to 3240?⭐️GOLDEN INFORMATION:
Gold (XAU/USD) is trading lower, around $3,285 in early Asian hours on Friday, as a firmer U.S. dollar weighs on the non-yielding metal following new tariff measures announced by President Donald Trump.
The White House said late Thursday that Trump will set a 10% baseline tariff, stepping back from earlier speculation about hikes to 15% or higher, according to Bloomberg. He also signed an executive order raising the tariff on Canada from 25% to 35%, effective August 1, 2025, while extending Mexico’s current tariff rates for another 90 days to allow more time for negotiations.
⭐️Personal comments NOVA:
large frame, gold price is still moving in the downtrend line. will wait for NF result to have strong selling force again 3240
⭐️SET UP GOLD PRICE:
🔥SELL GOLD zone: 3374- 3376 SL 3381
TP1: $3365
TP2: $3350
TP3: $3333
🔥BUY GOLD zone: $3242-$3240 SL $3235
TP1: $3255
TP2: $3268
TP3: $3280
⭐️Technical analysis:
Based on technical indicators EMA 34, EMA89 and support resistance areas to set up a reasonable SELL order.
⭐️NOTE:
Note: Nova wishes traders to manage their capital well
- take the number of lots that match your capital
- Takeprofit equal to 4-6% of capital account
- Stoplose equal to 2-3% of capital account
GOLD: $4000 on the way! Bulls has the controlGold is on the way hitting a record high since the global tension rising we can see gold creating another record high. Please note that it is a swing trades and may take weeks and months to hit the target or it may not even reach the target itself. This is prediction only so do your own due diligence.

GOLD recovers after many days of declineOANDA:XAUUSD has recovered after several days of declines. Investors will focus on the Federal Reserve's interest rate decision on Wednesday, which is expected to cause significant market volatility.
Gold hit a three-week low of $3,301 an ounce on Monday, before recovering somewhat on Tuesday after falling for a fourth straight day as the dollar erased some of its earlier gains, boosting demand for the precious metal.
Falling US Treasury yields and a weak US jobs report also prompted investors to buy gold.
Data released by the U.S. Labor Department on Tuesday showed the number of jobs added fell in June after two straight months of gains.
The number of jobs added in June fell to 7.44 million from a revised 7.71 million in May. The median forecast of economists in a survey was 7.5 million.
Focus on the Federal Reserve's decision
The Federal Reserve will announce its interest rate decision at 01:00 IST on Thursday; Federal Reserve Chairman Powell will hold a press conference on monetary policy at 01:30 IST on the same day.
The market generally expects the Federal Reserve to keep interest rates unchanged, with the focus on whether Fed Chairman Powell's speech will provide any clues about the timing or pace of future rate cuts.
The market sees a very low chance of a rate cut in July and a roughly 40% chance of another rate cut in September, up from about 10% last month, according to the Chicago Mercantile Exchange's FedWatch tool. Investors will be closely watching the statement and Fed Chairman Powell's remarks at his post-meeting press conference for fresh clues on the timing of the next rate cut.
- If Powell opens the door to a rate cut in September, citing the recent trade deal as a reason to ease uncertainty, US Treasury yields could fall immediately, paving the way for gold prices to rise.
- On the other hand, if Powell avoids committing to a rate cut at this meeting, citing recent rising inflation data, gold prices could fall.
Gold typically performs well in low-interest-rate environments because it does not pay interest and its appeal increases when returns from other assets decline.
Technical Outlook Analysis OANDA:XAUUSD
Gold has recovered from the key $3,300 price point and is holding above $3,310, which is also the nearest support. However, the current recovery is not technically enough to create a short-term uptrend, or conditions for a sustained price increase. In terms of position, gold is under pressure with the 21-day EMA as the nearest resistance at around $3,340 – $3,350. If gold falls below the 0.382% Fibonacci retracement level, it will be eligible to open a new downtrend with a target of around $3,246 in the short term, more than the 0.50% Fibonacci retracement level.
On the other hand, RSI is below 50, and the current 50 level acts as momentum resistance in the short term. If RSI slopes down, it will signal bearish momentum with more downside ahead. For gold to qualify for bullish expectations, it needs to at least push price action above EMA21, then retrace back to the price channels and finally break above the 0.236% Fibonacci retracement level to confirm bullish conditions. The upside target could be towards $3,400 in the short term, more like $3,430 – $3,450.
For the day, the technical outlook for gold prices tends to lean more towards the downside, with the following notable points listed.
Support: 3,310 – 3,300 – 3,292 USD
Resistance: 3,340 – 3,350 – 3,371 USD
SELL XAUUSD PRICE 3376 - 3374⚡️
↠↠ Stop Loss 3380
→Take Profit 1 3368
↨
→Take Profit 2 3362
BUY XAUUSD PRICE 3280 - 3282⚡️
↠↠ Stop Loss 3276
→Take Profit 1 3288
↨
→Take Profit 2 3294
Gold 3H Bullish Reversal SetupGold (XAU/USD) 3H Chart Setup:
Price has bounced from a key support zone around 3315, triggering a potential bullish reversal. The target is set near 3360, with a stop loss below the support zone. The projected price path shows possible consolidation before an upward breakout.

Gold may paint a false breakdown of supportGold is testing local resistance at 3325 with a touch. It is also touching the lower boundary of the channel. Thus, the price is stuck in the range between 3325 and 3320. A return of the price to the upward channel may attract buying activity. In this case, we can expect growth to 3375 or to the channel resistance.
The trend is upward. If gold does not fall but returns to the channel, we will see a false breakdown of support. According to statistics, all the strongest movements begin after false breakdown

XAUUSD – Weak Rebound, Bearish Bias RemainsYesterday was a quiet and choppy day for Gold.
Although price managed to recover a small portion of last week’s 1400 pip drop, the rebound remains anemic — price barely reached the 23% Fibonacci retracement.
To make things worse for the bulls, the recovery from around $3300 is starting to take the shape of a bearish flag, a continuation pattern that typically signals further downside ahead.
📌 Resistance Zones to Watch:
- Initial resistance: $3345–3350
- Stronger resistance: $3370, a level already proven and well-defined
As long as the price is under those levels, I remain firmly bearish.
📈 Trading Plan:
I already have a short position open, and I'm still waiting to add more, preferably on a push into higher resistance, ideally above $3345.
No need to force entries — I’d rather scale in on strength, not weakness.
Once the correction is complete, I’m targeting:
- $3280 as the first support
- $3250 as a realistic downside objective
Conclusion:
The rebound lacks power. The structure favors the bears.
Still watching for better entries to add short, with eyes on 3280 and 3250 as likely targets.
Let’s stay patient and let the setup come to us. 🎯
Disclosure: I am part of TradeNation's Influencer program and receive a monthly fee for using their TradingView charts in my analyses and educational articles.

