Gold fluctuates. Is the decline halted?Information Summary:
Despite diminished market expectations for a September US rate cut, gold rebounded from a one-month low hit the previous session on Thursday, boosting its safe-haven appeal as newly announced US tariffs sparked new trade uncertainty.
So far, gold has risen 1.15%, hovering around $3,310, a gain of nearly $40 today. On Wednesday, gold prices hit their lowest point since June 30th: $3,267.79.
Market Analysis:
On the 4-hour chart, prices remain below the middle Bollinger Band, with a descending trendline defining the current bearish momentum. Prices rebounded after hitting this month's low on Wednesday. In the short term, watch for price rejection signals near the trendline. Upward pressure currently lies between $3,315 and $3,325, while support lies between $3,280 and $3,270.
Currently, prices are fluctuating upward. Quaid believes the bullish trend may continue. If the current resistance level is broken, it could reach the 3335 high before Wednesday's decline.
Trading strategy:
Go long near 3300, stop loss at 3290, profit range 3320-3330.
GOLD trade ideas

gold in retracement gold in retracement and will find a strong resistance to continue its downtrend there after.

XAUUSD SELL OFF CONTINUATION All my trade entry criterias met with the backing of the ADP Non-Farm Employment Change news release being positive for the USD, a SELL trade on GOLD

Bullish Trend with Clear Support & Resistance LevelsGold Price Action: Bullish Trend & Key Levels 🟡📈
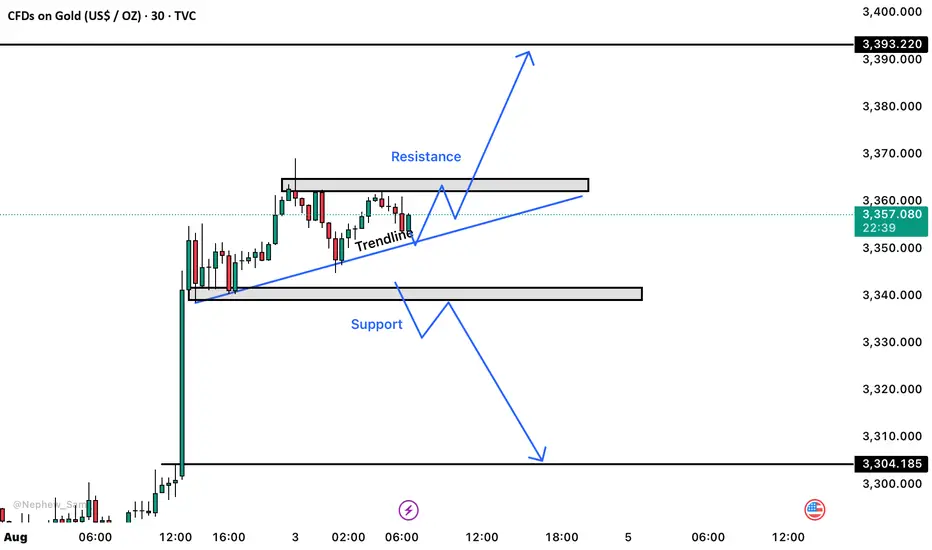
This 30-minute chart provides a clear overview of the current price action for Gold (CFDs), with well-defined support and resistance levels. Let’s break down the key aspects of the chart and the possible trade opportunities. 💹
Key Observations:
📉 Support: The price has been bouncing off the lower boundary at $3,304.185, indicating a strong buying interest in this zone. A solid level to watch for bullish opportunities.
📈 Resistance: At $3,393.220, the price has faced difficulty breaking above, marking a critical sell zone if the price struggles to rise past it.
🔵 Trendline: The upward trendline highlights that price action is making higher lows, signaling a bullish trend overall.
Trade Opportunities:
🔼 Bullish Signal: If the price stays above the trendline and support zone, there’s a strong chance it will test the resistance around $3,393, presenting a potential buy opportunity.
🔽 Bearish Signal: A break below the support level could signal a possible downtrend, with sell opportunities towards the next support at $3,300 or lower.
GOLD (XAUUSD): Detailed Support & Resistance Analysis
Here is my fresh support & resistance analysis for Gold.
Vertical Structures
Vertical Resistance 1: Rising trend line
Horizontal Structures
Support 1: 3327 - 3344 area
Support 2: 3246 - 3275 area
Resistance 1: 3431 - 3451 area
The price is currently coiling on a trend line.
Your next bullish confirmation will be its breakout.
❤️Please, support my work with like, thank you!❤️
I am part of Trade Nation's Influencer program and receive a monthly fee for using their TradingView charts in my analysis.

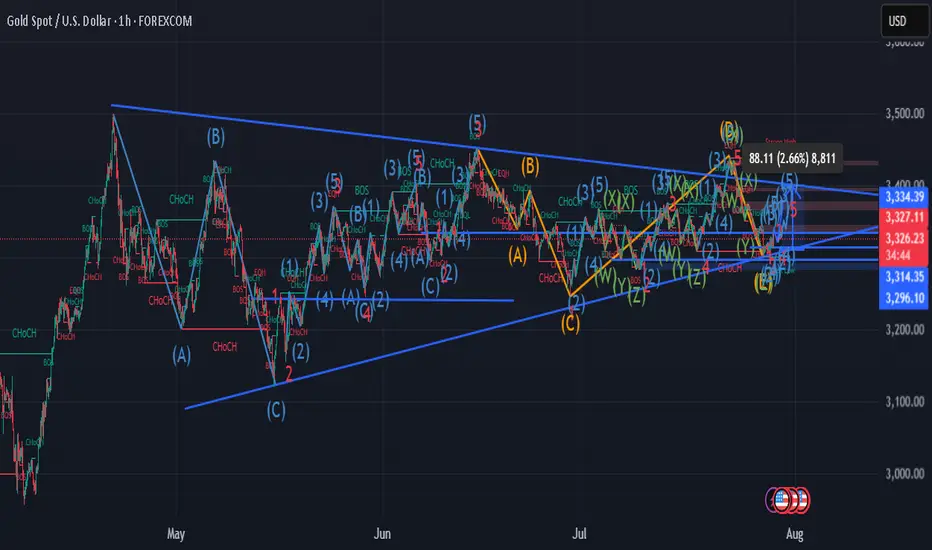
technical analysis- (xau-usd) (H1)This chart highlights a large symmetrical triangle formation, with an internal WXYXZ corrective structure blended with impulsive Elliott Waves (1)-(5). The price action is marked by key structural shifts: CHoCH, BOS, and EOH, signaling trend reversals and liquidity grabs.
📌 Price recently bounced off the ascending trendline, forming a potential wave (2) low, suggesting a bullish move into a wave (3) impulse.
🔼 Short-term target points to a revisit of the strong resistance zone around 3,400–3,410.
📊 Key Setup:
• Pattern: Symmetrical Triangle
• Wave Count: Corrective WXYXZ + impulsive structure in progress
• Signals: Bullish CHoCH + BOS confirmation
🎯 Trade Idea:
• ✅ Direction: BUY
• 🎯 Take Profit (TP): 3,400 – 3,410
• 🔻 Stop Loss (SL): 3,296
🔁 Sideways range compression sets up ideal conditions for short-term swing or breakout scalps.
Next Stop 3420? Gold Bulls Push the LimitBecause the U.S. non-farm payroll report performed worse than expected, gold rebounded strongly last Friday and recovered half of its losses in one fell swoop. The bulls returned strongly. Today, after consolidating at a high level, gold continued to choose to break upward, reaching a high of around 3385.
There is no doubt that bullish forces still hold the upper hand. From a fundamental perspective, the Federal Reserve is currently facing greater pressure to cut interest rates; and it can also be clearly seen from the candlestick chart that a significant "W"-shaped double bottom structure has been constructed near 3268 and 3280, which has limited the gold's retracement space while also playing a key structural support role in the rise of gold. With the combined effects of news and technical factors, gold still has the potential to continue its upward trend. And I think there is still a great possibility that gold will test the 3400 mark again. Once gold stabilizes at 3400, it will definitely hit the 3420-3430 area.
As the center of gravity of gold gradually shifts upward, the lower support area also moves up. The current short-term support is obviously in the 3365-3355 area, while the relatively strong support is in the 3345-3335 area. According to the current pattern structure, the bulls may not allow gold to retreat to the 3345-3335 area. So in terms of short-term trading, we first consider the opportunity to enter long positions in the 3365-3355 area!

GOLD: Strong Bullish Sentiment! Long!
My dear friends,
Today we will analyse GOLD together☺️
The recent price action suggests a shift in mid-term momentum. A break above the current local range around 3,296.556 will confirm the new direction upwards with the target being the next key level of 3,310.375 and a reconvened placement of a stop-loss beyond the range.
❤️Sending you lots of Love and Hugs❤️

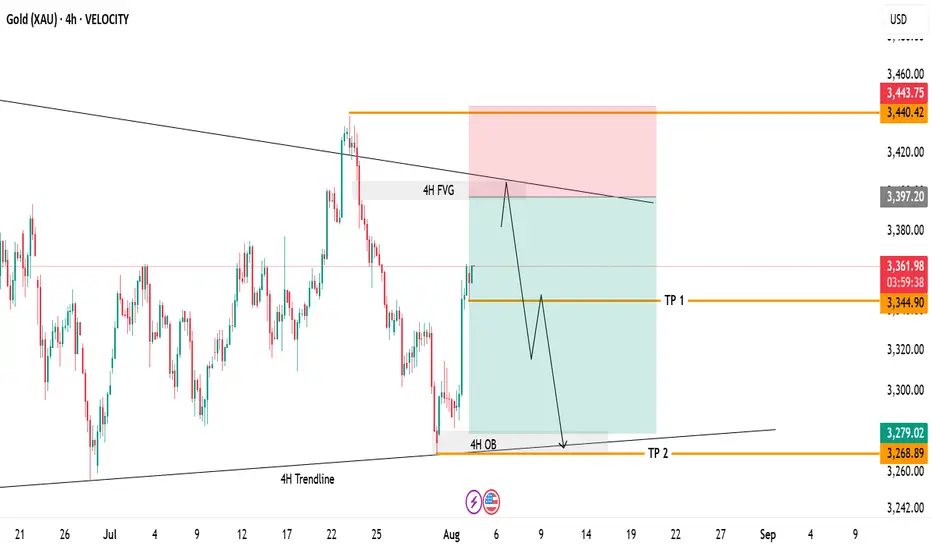
Gold 4H Swing Trade Setup!Currently watching price action as it approaches the 4H Fair Value Gap and descending trendline resistance. Price has not tapped this zone yet, and a move higher into this area could set up a potential reversal.
Setup Highlights:
4H FVG: 3,397–3,400 – Main area of interest.
Trendline Resistance: Confluence zone to watch for rejection.
Plan: Waiting for price to fill the imbalance and test the resistance before considering short entries.
Targets if Rejection Occurs:
TP1: 3,344 – First partial target.
TP2: 3,268 – 4H OB retest.
Invalidation:
A clear breakout and hold above 3,440 would invalidate the bearish scenario.
Bullish Break of Structure on 4H XAUUSD – Targeting 3451.525 Price broke structure to the upside on the 4H chart, showing bullish intent. I expect price to continue higher toward the 3451.525 level, which looks like a key liquidity area. As long as price holds above the break, the bias remains bullish.
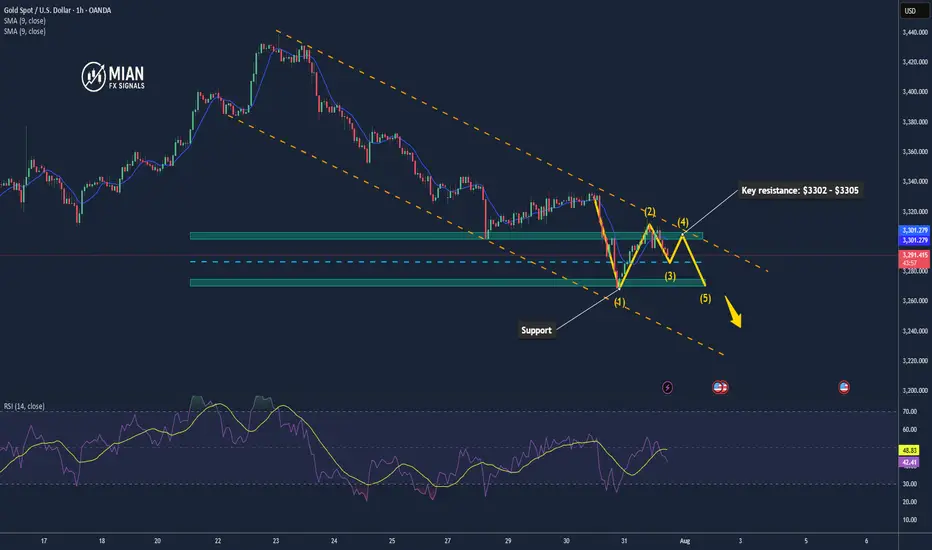
GOLD REMAINS UNDER PRESSURE AFTER U.S. INFLATION DATA📊 Market Overview:
Gold is trading around $3294, down from $3311 earlier after U.S. Core PCE and Employment Cost Index came in as expected — reinforcing the Fed's hawkish stance. A stronger dollar and rising Treasury yields continue to weigh on gold.
📉 Technical Analysis:
• Key resistance: $3302 – $3305
• Nearest support: $3285 – $3275
• EMA09 (H1): Price is below the 9-period EMA → short-term trend remains bearish
• Candlestick / volume / momentum: After the sharp drop, price is consolidating between $3293–$3298 with low volume. Failure to break above $3302 may trigger further downside. RSI near 45 suggests room for more selling.
📌 Outlook:
Gold may continue to decline in the short term if it fails to reclaim $3302 and the dollar remains strong through the Asian and European sessions.
💡 Suggested Trade Setup:
🔻 SELL XAU/USD: $3296 – $3298
🎯 TP: $3280 / $3275
❌ SL: $3305
🔺 BUY XAU/USD: $3275 – $3278 (if reversal candle appears)
🎯 TP: $3295
❌ SL: $3270
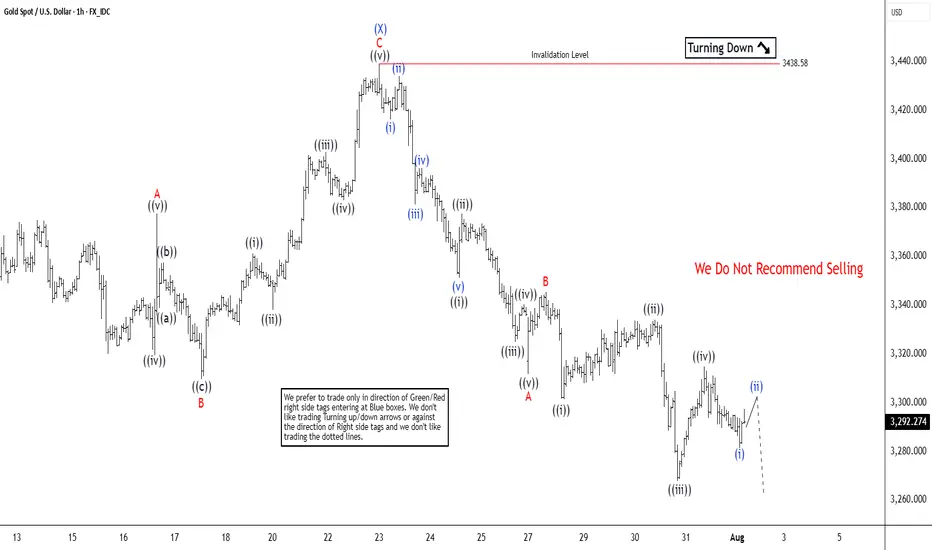
Elliott Wave Analysis Points to Gold (XAUUSD) Support Near 3320Gold (XAUUSD) appears poised for a double correction from its 16 June 2025 high. A double three consists of two corrective patterns, typically zigzags. From the June peak, wave (W) concluded at 3246.55, and wave (X) rallied to 3438.58, as shown on the 1-hour chart. Wave (Y) is now unfolding lower with internal subdivision as a zigzag. From wave (X), wave ((i)) ended at 3351.17, and wave ((ii)) peaked at 3377.45. Wave ((iii)) declined to 3324.80, followed by a wave ((iv)) rally to 3340.34. The final wave ((v)) completed at 3311.62, forming wave A in a higher degree. A corrective wave B rally reached 3345.35 before gold resumed its downward move.
Within wave C, wave ((i)) finished at 3301.47, and wave ((ii)) rallied to 3334.08. Wave ((iii)) dropped to 3267.94, with wave ((iv)) ending at 3314.85. Gold should continue lower in wave ((v)) to complete wave C. The potential target lies within the 100%–161.8% Fibonacci extension from the 16 June high. This projects a support zone between 3104 and 3230, where a three-wave rally is anticipated. Traders should monitor this area for potential reversal signals, as it may offer support for a corrective bounce.
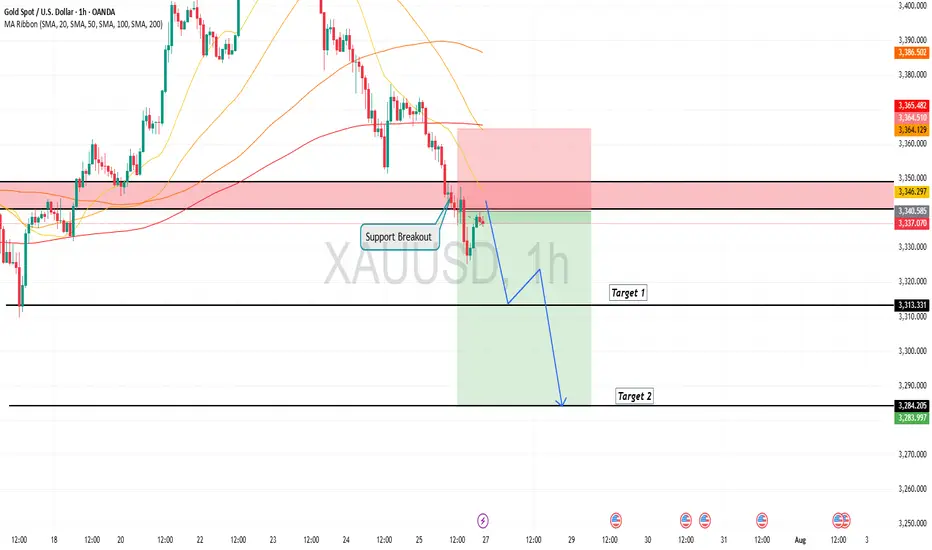
Gold is in the Bearish Direction after Breaking SupportHello Traders
In This Chart GOLD HOURLY Forex Forecast By FOREX PLANET
today Gold analysis 👆
🟢This Chart includes_ (GOLD market update)
🟢What is The Next Opportunity on GOLD Market
🟢how to Enter to the Valid Entry With Assurance Profit
This CHART is For Trader's that Want to Improve Their Technical Analysis Skills and Their Trading By Understanding How To Analyze The Market Using Multiple Timeframes and Understanding The Bigger Picture on the Charts
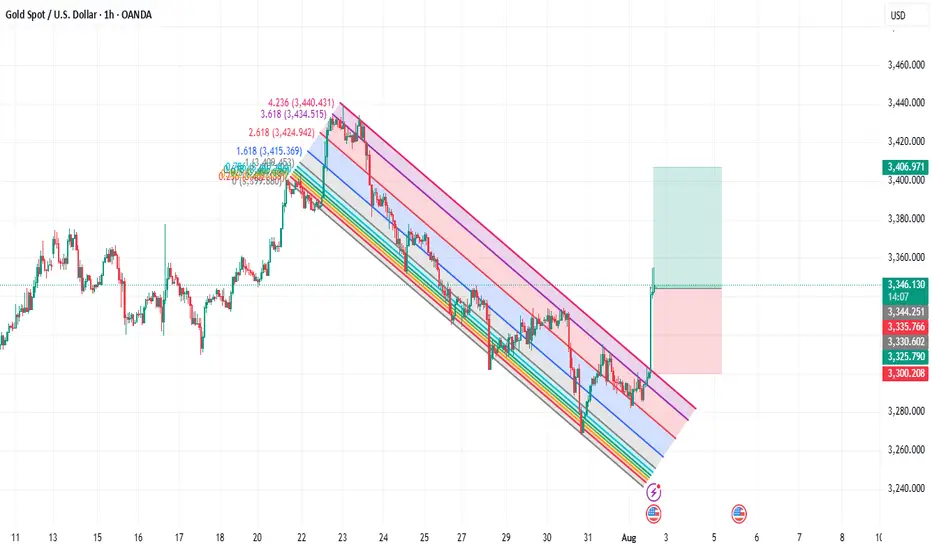
Volume. supportAlthough gold has made a downward segment overlap and the priority should be on a decline, due to Trump's trade wars and geopolitical tensions, I believe that after a pullback to the buyer zone of 3280–3315, gold will continue to rise.


Big money coming? Here, NFP data XAUUSD Technical Analysis PredDXY forecast today
XAU USD forecast today
EURUSD forecast today
NFP Data Forecast: Xauusd buys SELV sales for mass profit! Your latest gold trade guide confidently during the production of this most important wages is not related to the farm. In this video you will receive technical analysis from XaUUSD experts and proven adjustments for XaUUSD sales. It breaks down how you interpret forecasts for NFP data, how it affects gold prices, and where the best opportunities are. Whether you're a day trader or swing, this video gives you real information to plan your trade and plan your risk management as an expert. Don't miss this opportunity to turn your data into profits ahead of the market. Now look, trade more intelligently and go ahead with the crowd!
#NFPDATAFORECAST
#xauusd
#GoldTrading
#technicalalyasis
#forexsignals
#GoldPrice
#daytrading
#swingtrading

Bullish Breakout to $4,060 TargetOn the daily chart, XAUUSD is forming a Symmetrical Triangle with a bullish breakout potential.
📍 Buy zone: Around $3,200 (strong support and point D of the pattern)
📍 Target: $4,060 based on breakout projection.
Quick Analysis:
Pattern: Symmetrical Triangle + ABCD Harmonic
Buy near strong support at $3,200
Big upside potential after breakout
Good risk/reward for medium to long-term trades

gold with nadara watson gold with nadara watson using one hour time frame hope working fine with you

LIVE BTC/USD, XAUUSD TRADING, 02/08/2025 SIGNALS PRICE ACTION TRLive BTC/USD, XAUUSD TRADING, 02/08/2025 signal price action trading strategy

The trend is clear, why do I choose to be firmly bullish on goldGold Trend Analysis: Yesterday, the gold market demonstrated strong upward momentum, opening near 3290 before falling slightly to a low of 3281 before fluctuating upward. Boosted by the non-farm payroll data, the gold market surged during the US trading session, reaching a single-day gain of 2.02%, reaching a high of 3363 and closing there. The daily chart formed a long bullish candlestick with a long lower shadow, forming a Morning Star pattern, reinforcing the bullish trend. From the perspective of the cycle structure, the daily level is clearly in the 5-wave upward stage, and the upward trend of the large cycle has not changed. At the indicator level, the daily MACD momentum column (the column below the zero axis) represents the short-selling momentum. Its "gradual shortening" means that the short-selling force is weakening and the downward momentum is gradually fading. It is a potential signal of stopping the decline or rebounding. KDJ is about to form a golden cross between 20-50, which is a signal that short-term bullish power is beginning to increase, and the overall trend is bullish.
The 4-hour level shows typical bullish characteristics: the moving average system is arranged in a bullish pattern, but there is a certain deviation between the short-term price and the moving average. The technical side needs to correct the deviation rate through a callback before continuing to rise. The short-term support below is focused on the line near 3330-3335. This position is both the relay support level in the previous rise and the intersection of the 4-hour moving averages MA10 and MA20, which has strong support strength; the short-term resistance above is focused on the line near 3370-3383. This area is a pressure-intensive area near the previous high point. If it can be effectively broken through, it will further open up upward space. A successful breakout would open up further upside potential. A breakout would further open up the 3400 mark.
For gold trading, the short-term strategy is to buy on dips. If the price pulls back to the 3330-3335 support level, consider entering a long position with a target of 3355-3365. If it reaches 3370-3380, consider a short-term short position with a target of 3350-3340.

Gold you now totaly buy trend for next 3 to 5 days Gold you now totaly buy trend for next 3 to 5 days
If you want learn more fell free contrect me .
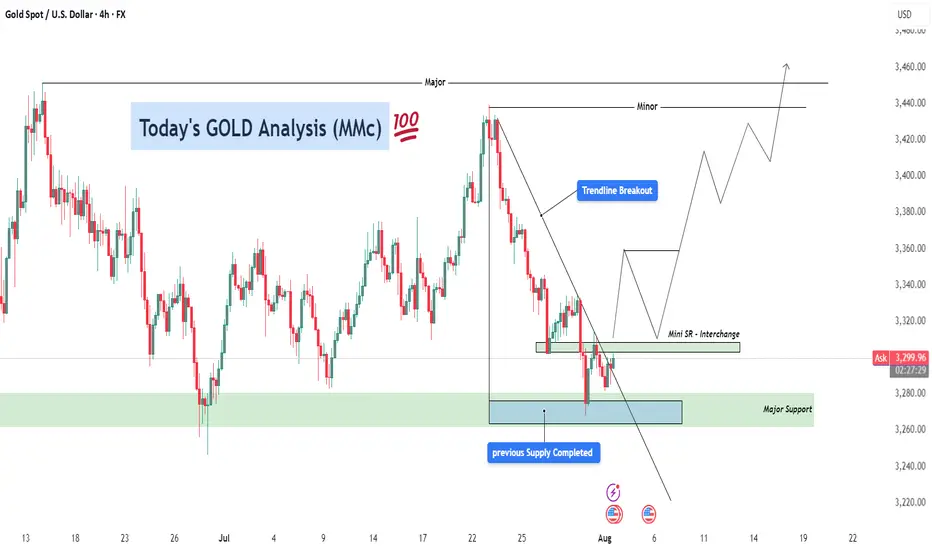
GOLD Analysis – Bullish Recovery Setup After Trendline Breakout ⚙️ Technical Structure Overview
This 4-hour chart of Gold (XAUUSD) illustrates a classic reversal setup developing after a significant correction. Price previously faced strong selling pressure from the 3,470+ zone and declined sharply. However, the recent price action suggests a shift in control from sellers to buyers, signaling a likely medium-term trend reversal or a bullish wave formation.
The key to this setup lies in three confluences:
Completion of a previous supply zone, which no longer holds influence.
Aggressive buyer activity from a major support zone.
A clean break above the descending trendline, which is a common signal that bearish momentum is losing strength.
🔑 Key Levels & Concepts Explained
🟢 1. Major Support Zone (3,260–3,280)
This zone has been tested multiple times and each time, buyers stepped in and prevented further downside. The most recent rejection from this area shows long wicks and bullish engulfing candles, indicating accumulation by institutional players. This is the foundational support that has held the entire corrective structure.
📉 2. Trendline Breakout
The descending trendline connecting swing highs has now been broken to the upside. This is a critical technical signal, especially on the 4H timeframe, as it suggests a potential trend reversal or at least a deep retracement in the opposite direction.
Trendline breakouts typically result in a retest of the trendline or a nearby support-turned-resistance zone (as is the case here with the Mini SR level).
It also implies that supply is weakening, and buyers are ready to push.
🧱 3. Mini Support/Resistance Interchange (~3,300–3,320)
This zone now plays the role of an interchange level—a previous minor resistance that could act as a support after the breakout. This level is crucial for intraday and swing traders because it can offer a low-risk long entry if price retests and confirms it with bullish momentum.
The chart projection suggests a bounce off this mini S/R, followed by successive higher highs and higher lows, forming a new bullish structure.
📈 Forecast Path & Trade Scenario
✅ Bullish Path (Preferred MMC Scenario)
Stage 1: Price retests the 3,300–3,320 zone (Mini S/R).
Stage 2: Buyers step in, leading to a bullish continuation.
Stage 3: Price targets the Minor Resistance (~3,440).
Stage 4: If momentum is sustained, it aims for Major Resistance (~3,470–3,480), completing a clean reversal formation.
This path reflects perfect bullish market structure—a breakout, followed by a retest and rally.
❌ Bearish Invalidation
If the price closes strongly below 3,260, the structure would be invalidated.
This would suggest that the support zone failed, possibly triggering deeper downside toward 3,220–3,200.
🧠 MMC Trader Mindset & Risk Considerations
Don’t Chase: Wait for a confirmed retest of the Mini S/R zone. Let the market come to your entry.
Entry Confirmation: Use candlestick signals like bullish engulfing, pin bars, or inside bars near the Mini S/R.
Volume Consideration: Volume should ideally rise on breakout legs and decline on pullbacks—this confirms healthy bullish structure.
Risk-Reward: With a stop below 3,260 and targets toward 3,470, the RR ratio favors long entries, especially after confirmation.
🔁 Summary Plan for Execution
Entry Zone: 3,300–3,320 (after bullish confirmation)
Stop Loss: Below 3,260 (structure break)
Take Profit 1: 3,440
Take Profit 2: 3,470–3,480
Risk-to-Reward: 1:2+ if planned carefully
Gold Slipping Lower — 3250 and 3200 in Sight!✅ Gold & DXY Update – Post-FOMC Price Action
Earlier today, before the U.S. interest rate decision, I released my outlook on both the Dollar Index and gold.
In that analysis, I highlighted the DXY’s readiness to move toward the key level of 100 — and as of now, price is actively testing that exact zone, just as expected.
As for gold, I repeatedly emphasized the visible weakness on the buy side. It was clear that there were very few remaining buy orders strong enough to hold price up in this region — and that’s exactly what played out. Price has started pushing lower, in line with our expectations.
Looking ahead, I believe the first target is 3250, followed by a deeper move toward the liquidity zone and the marked box around 3200, which could act as a key target area in the coming days.
🔁 This analysis will be updated whenever necessary.
Disclaimer: This is not financial advice. Just my personal opinion.
