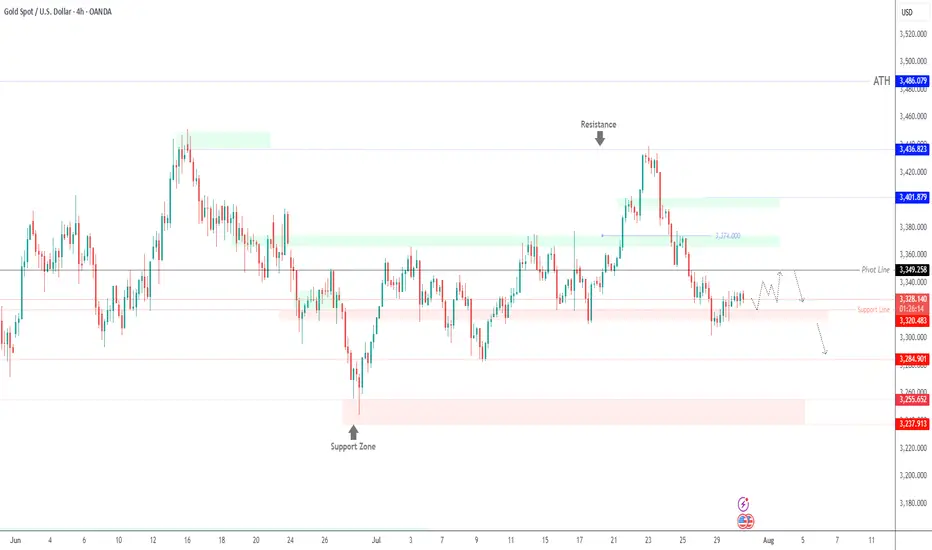
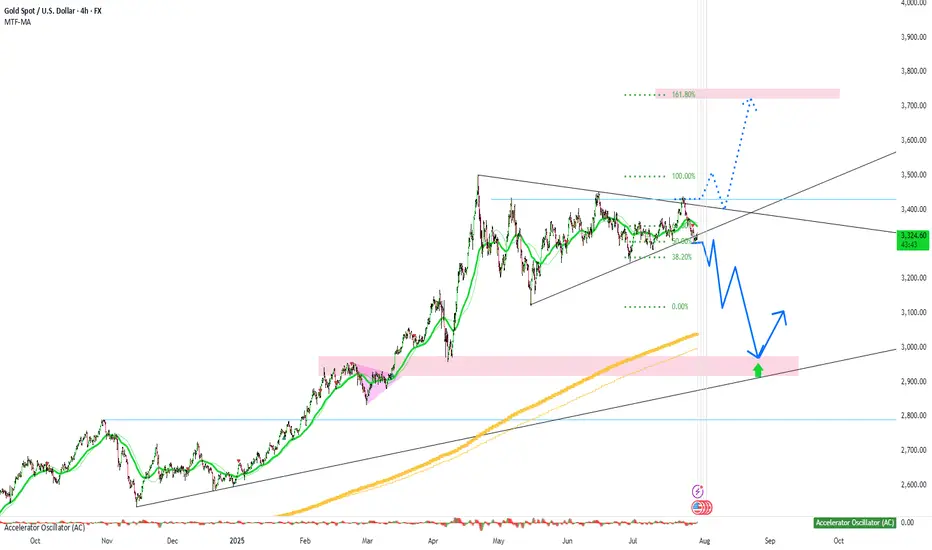
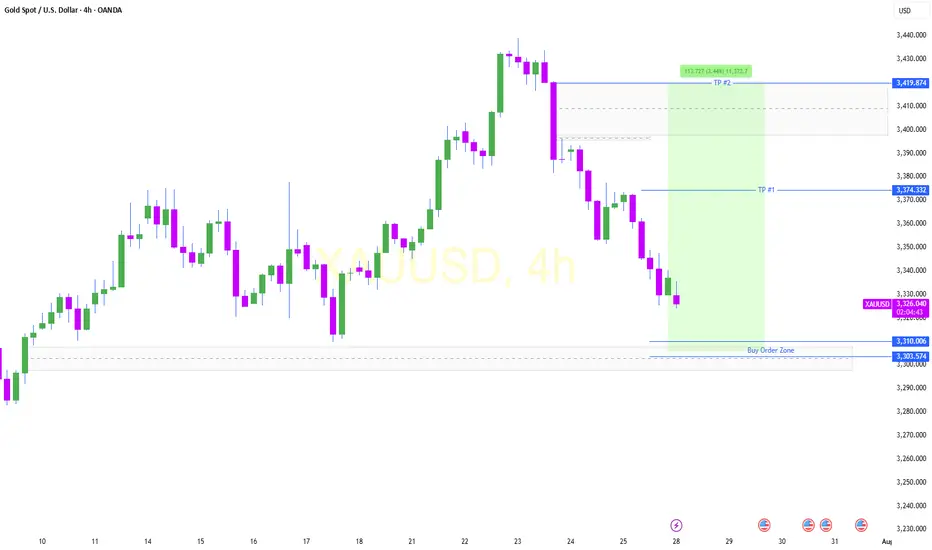
XAUUSD – Downtrend Confirmed, Bears in ControlOn the H4 timeframe, gold has completely broken its short-term uptrend structure and formed a series of lower highs and lower lows. Every bounce is rejected at the strong resistance zone of 3,326 – 3,333 USD, confirming the clear downtrend.
Although the recently released Core PCE index was lower than expected, this is not enough to drive a recovery as other data, such as the Employment Cost Index and statements from the Fed, still show persistent inflationary pressure. Therefore, the monetary policy remains hawkish, causing money to flow out of gold.
Currently, the price is approaching the critical support zone of 3,247. If this level is broken, the scenario of further declines to 3,192 is entirely possible.
GOLDCFD trade ideas

GOLD Range-Bound Before Fed – Breakout Above 3349 Unlocks 3374GOLD | Bullish Momentum Builds Ahead of Fed Decision – Key Range Between 3349 and 3312
Fundamental Insight:
Gold is slightly higher as the U.S. dollar weakens ahead of the Fed’s rate decision. Markets await signals on future policy, which could drive sharp moves in gold.
Technical Outlook:
Gold remains bullish while above 3320, with upside potential toward 3349.
A 1H close above 3349 confirms breakout momentum, opening the path toward 3374, and potentially 3401.
A break below 3320, especially below 3312, would invalidate the bullish setup and trigger downside toward 3285, then 3256.
Currently range-bound between 3349 and 3312 — watch for breakout confirmation to determine the next trend direction.
Key Levels:
• Support: 3320 – 3285 – 3256
• Resistance: 3349, 3374 – 3401
Bias: Bullish above 3320
📍 Watch Fed volatility – breakout expected soon
Do you think gold is on a correction?
Hi my dears
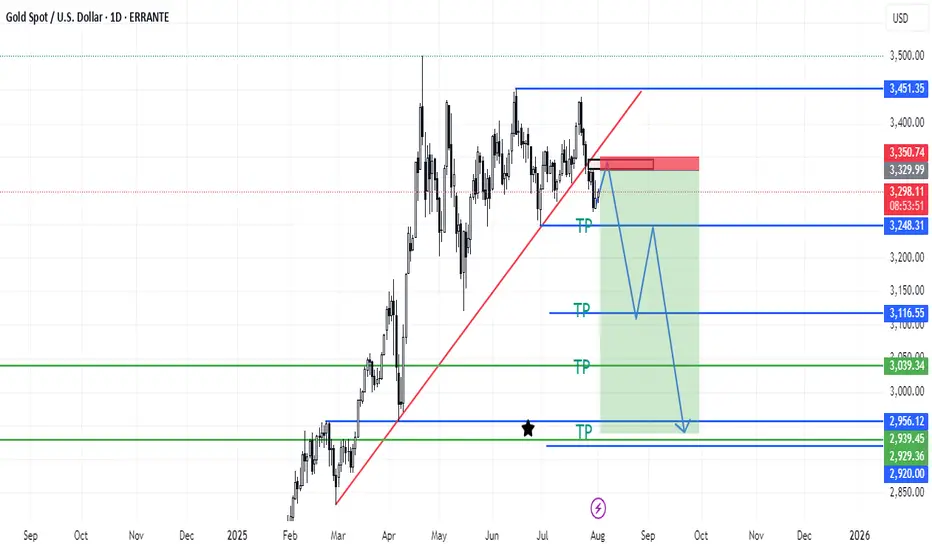
Gold looks set to hit lower targets if it breaks the orange dotted line
What do you think?
The weekly timeframe has confirmed the bearish trend.
If you liked my analysis, just like me by liking and commenting.

XAUUSD Possibility of a small correction towards 3330, re-entering the bearish phase and moving towards the specified targets
Excellent Selling opportunities deliveredGold delivered excellent re-Sell opportunities and as soon as DX started gaining value after GDP numbers, I was confident in Selling direction. I have Sold Gold on #3,324.80 towards #3,318.80 first, then #3,310.80 extension. Then I have Bought Gold (aggressive set of Scalping orders from #3,302.80 - #3,303.80 belt) closed on #3,306.80 and pre-Fed set of Selling orders on #3,294.80 - #3,296.80 closed below on #3,280's. Final order was #3,270.80 Buy which I kept towards #3,292.80 Resistance. All in all spectacular session for me and my Traders.
Technical analysis: As discussed, as long as #3,300.80 - #3,305.80 former Resistance holds, I was aware that Gold was more likely to push towards #3,270’s for a #2-Month Low’s test, still however within the Hourly 4 chart’s Buying accumulation zone. This week was / is packed with Fundamental announcements and real trend should be revealed (as today’s session Fundamental catalyst interfered and was already digested by markets), since today’s Price-action delivered the session High test around #3,300.80 benchmark and most likely market will close above it, triggering most of the late Sellers Stop-losses and as Bond Yields reversed and DX printed another series of Bullish candles above the Hourly 4 chart’s Support, Gold again reversed above #3,300.80 psychological barrier and is comfortably seen Trading above it. This shows how unstable market has become and that I should expect side Swings on Short-term, but those are not cause for an alarm as underlying Medium-term trend remains Bullish and I am there ready with my key entry points to Profit on this perfect Price-action for my current Trading model.
My position: I do not expect Gold to continue soaring with DX on such numbers and my practical suggestion is to Sell every High's that Gold deliver (in & out as I prefer to do).

XAUUSD August 2025 Monthly OutlookWelcome to August — and welcome to the top of the macro ladder. Gold is not just rising. It’s rewriting structure.
🔸 Macro & Fundamentals
Gold opens August with a fresh impulsive breakout above $3360, fuelled by a weaker USD, rising global risk sentiment, and continued speculative positioning from institutional buyers. The upcoming Jackson Hole meeting and shifting Federal Reserve expectations create the perfect climate for volatility. All eyes are now on the premium structure top — but will gold expand beyond it or retrace to refill?
🔸 Monthly Trend & Bias (HTF Overview)
🔹 Structure: Clean bullish BOS, continuation leg in progress
🔹 Last CHoCH: April 2023 → Confirmed full trend shift bullish
🔹 Current Monthly Candle: Explosive push into supply with top wick rejection beginning to show
🔹 Bias: Still bullish but in extreme premium — watch for cooling/rebalancing
🔸 EMA Structure
| EMA Type | Status | Signal |
| ----------- | -------------- | ------------------------------------- |
| EMA 5 / 21 | Strong Bullish | Dynamic expansion, steep angle upward
| EMA 50 | Below | Clean breakout from range
| EMA 100/200 | Far below | Long-term uptrend deeply intact
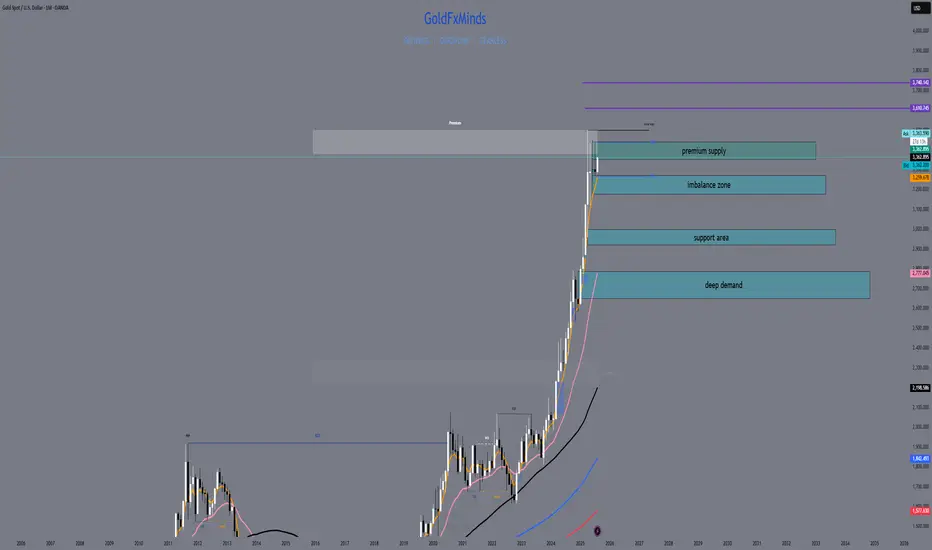
🔸 Key HTF Levels (Wick-to-Wick Mapping)
Zone Type Price Range Confluences
🔴 Premium Supply 3350 – 3439 Monthly FVG + Wick exhaustion + RSI 80+
🔵 Bullish Imbalance 3180 – 3270 Monthly FVG + old BOS + EMA5 baseline
🔵 Mid-Level Support 2920 – 3000 Monthly OB + FVG + structure base
🔵 Deep Demand 2670 – 2780 HTF equilibrium zone + RSI support
✅ The current candle has pierced into the final wick supply, but with clear signs of loss in momentum.
⚠️ If 3439 breaks cleanly, next expansion zone opens toward 3505 → 3610 (Fibonacci projection). Otherwise, expect cooling to 3270–3180 first.
🔸 Fibonacci Context
🔻 Swing Low: 1810
🔺 Swing High: 3439
🎯 Current price ($3363) sits just below the 100% Fibonacci projection, with the 1.272 and 1.618 extensions at 3610 and 3740.
This confirms we are in a macro premium, and any long positions from here forward must be built only on strong LTF confirmation or clean pullbacks into value.
🔸 August Scenarios
🟢 Scenario 1 – Breakout + Price Discovery
If bulls break 3439 with strong volume and close:
New leg toward 3505 → 3610 opens
Watch for LTF continuation on H4–D1 with bullish OB reentry
Only valid if 3350 holds as new support
🔻 Scenario 2 – Rejection + Healthy Pullback
If price holds below 3439 and monthly wick exhausts:
Clean retracement toward 3270 → 3180 expected
EMA5/21 rebalancing will support bullish structure
Deeper rejection could retest 3070 zone if volatility spikes
🔸 Conclusion & Action Plan
We open August fully inside the last monthly supply zone. Trend is still bullish, but RSI, FVGs, and EMA distance warn us: this is not the time to chase — it’s time to wait for structure to speak.
📌 Key pivot = 3439.
Above it → Expansion.
Below it → Retracement.
Let August unfold — but stay sharp. The next big move will be born from this compression.
—
What’s your take — are we just getting started or about to cool off?
Drop your thoughts, chart it out, and stay ready for what August brings. ⚔️
—
❤️ Like if you enjoy clean, actionable updates🚀🚀🚀
🔁 Share with traders who love structure over noise
With clarity, confidence, and control,
GoldFxMinds
Excellent Selling opportunities deliveredGold delivered excellent re-Sell opportunities and as soon as DX started gaining value after GDP numbers, I was confident in Selling direction. I have Sold Gold on #3,324.80 towards #3,318.80 first, then #3,310.80 extension. Then I have Bought Gold (aggressive set of Scalping orders from #3,302.80 - #3,303.80 belt) closed on #3,306.80 and pre-Fed set of Selling orders on #3,294.80 - #3,296.80 closed below on #3,280's. Final order was #3,270.80 Buy which I kept towards #3,292.80 Resistance. All in all spectacular session for me and my Traders.
Technical analysis: As discussed, as long as #3,300.80 - #3,305.80 former Resistance holds, I was aware that Gold was more likely to push towards #3,270’s for a #2-Month Low’s test, still however within the Hourly 4 chart’s Buying accumulation zone. This week was / is packed with Fundamental announcements and real trend should be revealed (as today’s session Fundamental catalyst interfered and was already digested by markets), since today’s Price-action delivered the session High test around #3,300.80 benchmark and most likely market will close above it, triggering most of the late Sellers Stop-losses and as Bond Yields reversed and DX printed another series of Bullish candles above the Hourly 4 chart’s Support, Gold again reversed above #3,300.80 psychological barrier and is comfortably seen Trading above it. This shows how unstable market has become and that I should expect side Swings on Short-term, but those are not cause for an alarm as underlying Medium-term trend remains Bullish and I am there ready with my key entry points to Profit on this perfect Price-action for my current Trading model.
My position: I do not expect Gold to continue soaring with DX on such numbers and my practical suggestion is to Sell every High's that Gold deliver (in & out as I prefer to do).
GOLD - One n Single Area, what's next??#GOLD... market just reached at his ultimate area as we discussed in our last week analysis and in Friday analysis as well.
The area is 3309-10
Keep close and don't be lazy here.
NOTE: we will go for cut n reverse below 3309 in confirmation.
Good luck
Trade wisley

GOLD: Time for massive drop? +3000 pips move! Gold has failed to breakthrough the previous resistance indicating a strong sellers hold around $3440 region. Now since the price has stared dropping we can see it dropping around $2800 in long term. In order for this to happen we need strong confirmation, which will help us understand the possible volume.
Agree with our idea?
Like and comment!

gold 4hour say: put sellstop in lowpersonaly i predict mini crash on gold and waiting for it , now we have powerfull 3angel pattern we must put sellstop in last low , buystop on last high
sellstop stoploss = last high
if sellstop open like new traders , dont close it soon , wait minimum 2 week ,understand?
ALERT= if gold can break last high , it can start new up trend, wave , so if you have old sells ,you must put SL or hedge buystop in last low
if sell
wishhhhhhhhhhhhhh youuuuuuuuuuuuuuuu win
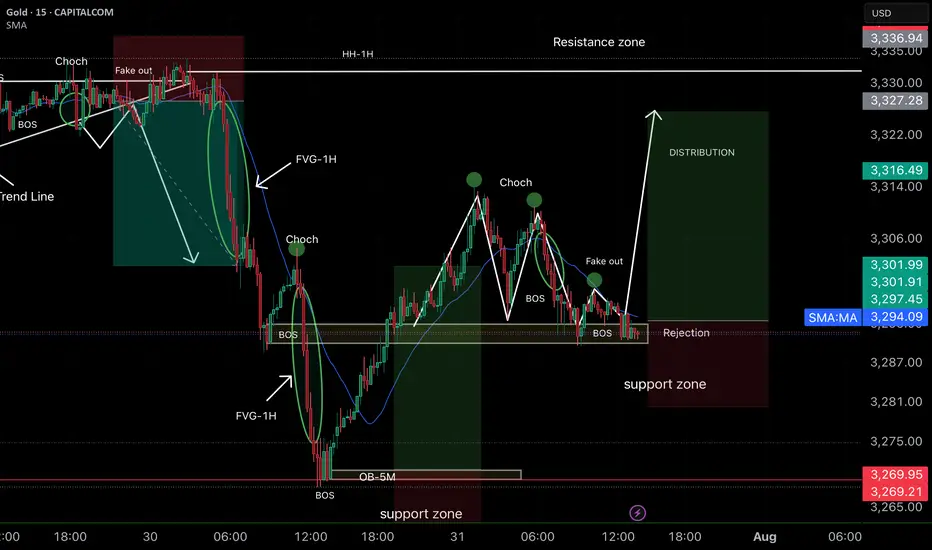
Smart Money Concepts (SMC) ✅ Analysis strengths:
• Correct identification of BOS (Break of Structure) and CHoCH, which indicate a change in direction.
• The support zone is marked and respected with rejection, reinforcing the probability of a rebound.
• The projection toward the distribution zone and HH of 1H is consistent, as there are inefficiencies (FVG) pending mitigation.
• The previous fake out clears liquidity and creates room for strong bullish momentum.
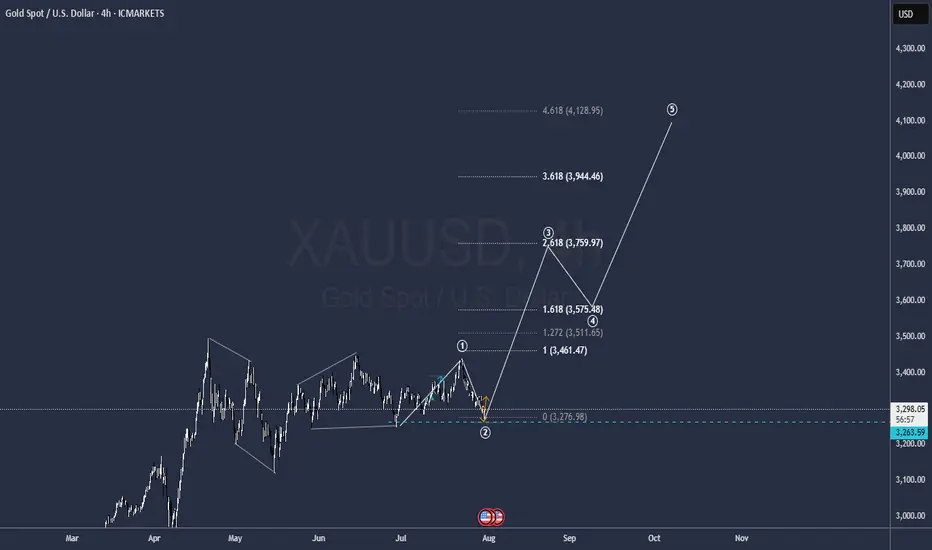
GOLD to all time highsIt is ready
a bitch wave one correction seems to be over so get ready to hit 4.000
GG
Gold (XAUUSD) – Buy the Dip Toward Key SupportTrade Idea
Type: Buy Limit
Entry: 3360.00
Target: 3400.00
Stop Loss: 3350.00
Duration: Intraday
Expires: 25/07/2025 06:00
Technical Overview
The primary trend remains bullish, supported by recent price structure and sentiment.
Price is correcting lower, and is approaching Fibonacci retracement support at 3360.00.
A Buy Limit at 3360.00 aligns with bespoke support and offers a low-risk entry opportunity.
The target at 3400.00 is modest but achievable within the current intraday cycle
Upcoming Events to Watch
24/07/2025 at 14:45 – S&P Global Manufacturing & Services PMIs (US) could add volatility and act as a catalyst for a reversal from support.
Key Technical Levels
Resistance: 3400.00 / 3420.00 / 3435.00
Support: 3360.00 / 3340.00 / 3320.00
Disclosure: I am part of Trade Nation's Influencer program and receive a monthly fee for using their TradingView charts in my analysis.

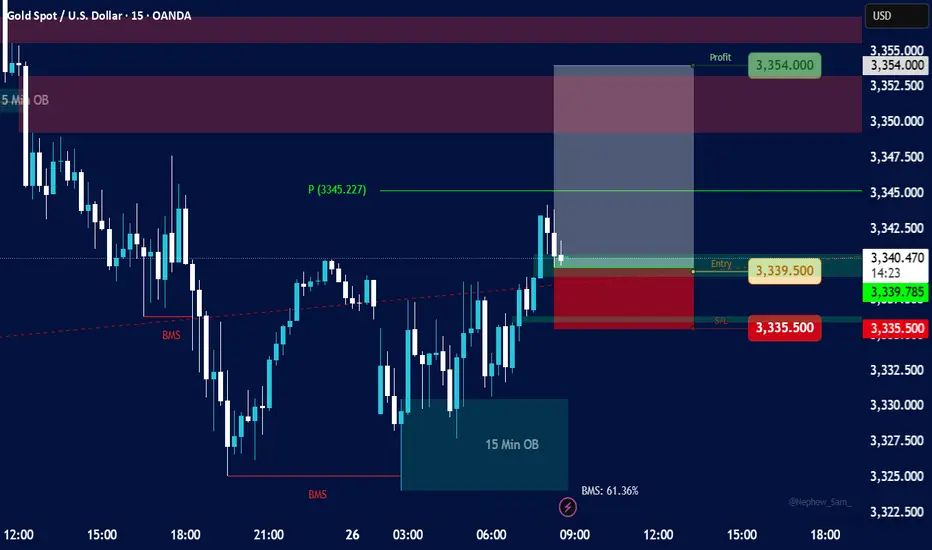
15-minute timeframe for XAU/USDKey Elements and Observations:
Price Action:
The price initially shows a downtrend, breaking below a previous low, indicated by "BMS" (likely "Break in Market Structure" or "Break of Market Structure").
Following the break, the price consolidates and then shows a strong upward movement, breaking above a resistance level, again marked by "BMS." This suggests a potential shift in momentum from bearish to bullish.
Order Blocks (OB):
5 Min OB (Blue Box, Top Left): There's a "5 Min OB" marked at a higher price level earlier in the chart. This represents a bearish order block, where significant selling pressure was previously observed.
15 Min OB (Teal Box, Bottom Right): A "15 Min OB" is identified at a lower price level (around 3326.00 - 3330.00). This is likely a bullish order block, indicating an area where institutions or large players placed buy orders, leading to a bounce in price.
Break in Market Structure (BMS):
Two "BMS" labels are visible:
The first BMS (red dashed line below 3330.00) indicates a break of a support level during the downtrend.
The second BMS (red dashed line above 3330.00) indicates a break of a resistance level during the subsequent uptrend, confirming a potential shift in market bias to bullish.
Entry, Stop Loss, and Take Profit (Trade Setup):
Entry (Green Line): The suggested entry point for a long (buy) position is at approximately 3339.50. This entry aligns with a retest of a previous resistance level that has now turned into support, or potentially the lower boundary of a small bullish order block or fair value gap.
Stop Loss (Red Line/Red Box): The stop loss is set at 3335.50. This is placed below a recent low or significant support level, specifically within a red-shaded area that likely represents a "Supply/Demand" zone or an area where the trade would be invalidated.
Take Profit (Green Line/Green Box): The take profit target is 3354.00, resulting in a "Profit" of 3354.00. This target is placed at a significant resistance level or an area where price might reverse. The white shaded box above the entry, extending to the take profit, highlights the potential profit zone.
Risk-Reward Ratio: While not explicitly calculated, the visual representation suggests a favorable risk-reward, with the potential profit (green box) appearing larger than the potential loss (red box).
Pivot Point (P):
A "P (3345.227)" is marked on the chart, likely indicating a pivot point, which can act as a dynamic support or resistance level. The current price is trading above this pivot point, further supporting a bullish bias.
"BMS: 61.36%" (Bottom Right):
This percentage likely refers to a "Break in Market Structure" metric or a specific trading indicator that quantifies the strength or probability of the market structure shift. 61.36% suggests a reasonably strong confirmation.
Implied Trading Strategy:
The chart depicts a bullish reversal strategy, likely based on "Smart Money Concepts" or "ICT" (Inner Circle Trader) principles. The strategy involves:
Identifying a shift in market structure: Price breaking highs after breaking lows, signaling a change from bearish to bullish.
Utilizing Order Blocks: Using the 15 Min OB as a foundational support level and potentially looking for entry confirmations around it.
Waiting for a Retest/Pullback: The entry around 3339.50 suggests waiting for a pullback after the initial bullish impulse. This could be a retest of a broken resistance level, a fair value gap (FVG), or a small bullish order block within the larger 15 Min OB.
Placing Stop Loss Strategically: Below a significant low or invalidation point.
Targeting Previous Highs/Resistance: Setting the take profit at a logical resistance level where previous selling pressure was observed.
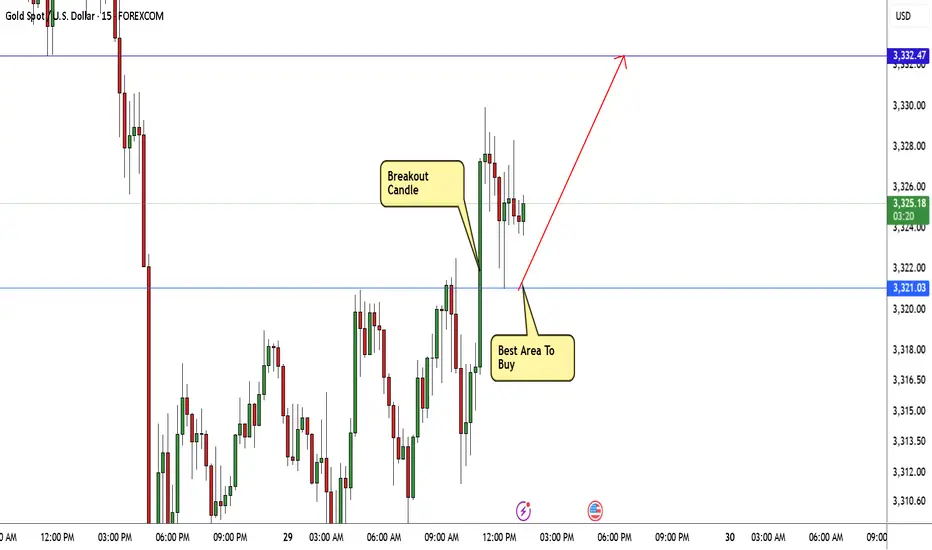
GOLD Breakout Done , Long Setup Valid To With Great ProfitHere is My 15 Mins Gold Chart , and here is my opinion , we finally above 3321.00 and we have a 15 Mins Candle closure above this strong res , so I'm waiting the price to go back and retest this res and new support and give me a good bullish price action to can enter a buy trade , and if we have a 4H Closure Above This res this will increase the reasons for buyers , just wait the price to back a little to retest it and then we can buy it . if we have a daily closure below it this idea will not be valid anymore .
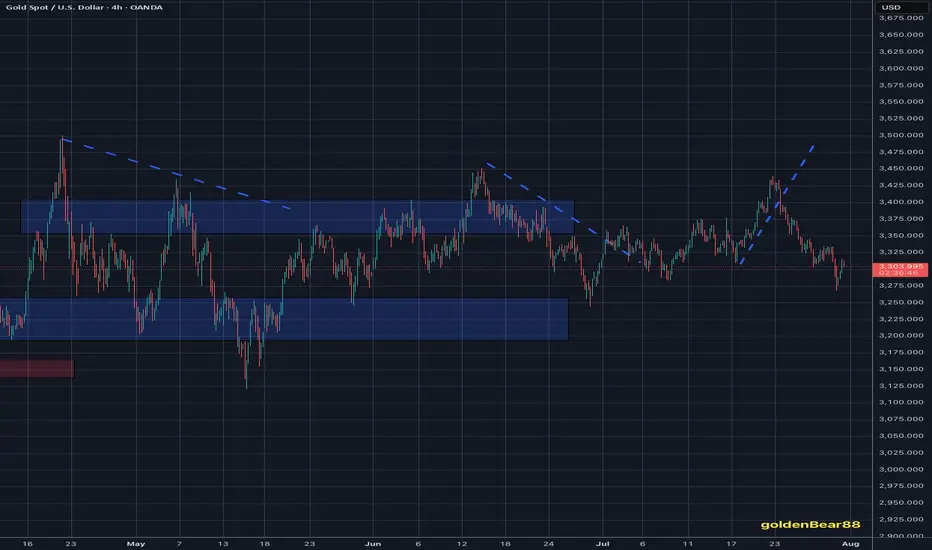
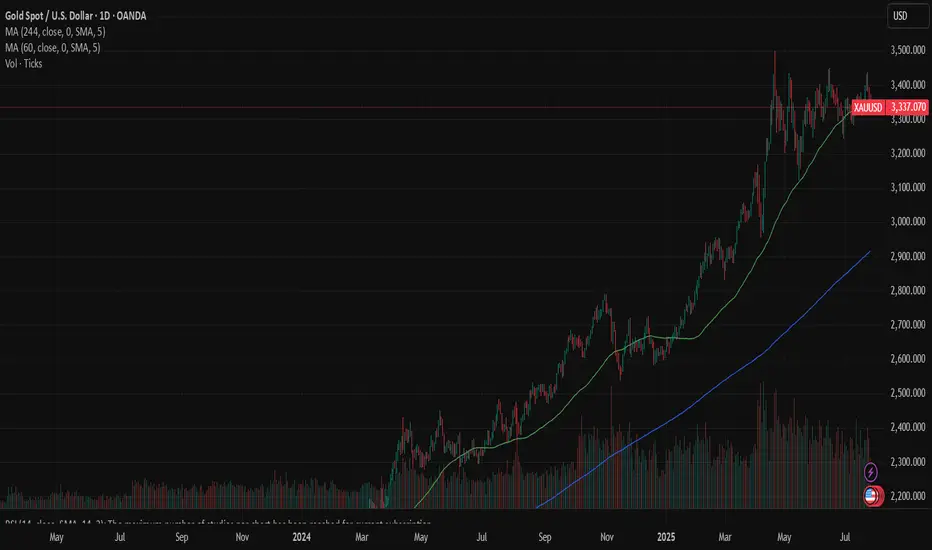
Gold: dropped on trade deals The safe-haven asset had its ups and downs during the previous week. The week started with an uptrend, where the price of gold reached its highest weekly level at $3.430, on trade tariff tensions. However, the deal made between the US and Japan, pushed the price toward lower grounds, ending the week at $3.340. In addition, Friday's drop was supported by announced tariffs negotiations between the US and EU in Scotland during the weekend.
The RSI dropped below the level of 50 on Friday, ending the week at the level of 48. The MA50 slowed down its divergence from MA200, however, the potential cross is still far away. Still, weekly lows of the price of gold found support at MA50 levels.
The week ahead brings several currently very important US macro data, including JOLTs, PCE, NFP and Unemployment data. In addition, the FOMC meeting will be held where the market will receive the latest Fed's view on economic developments in the country and future expectations. Also, further news on trade tariff agreements, especially regarding ongoing negotiations between the EU and the US in Scotland, might make an impact on investors sentiment for safe-haven assets. As per current charts, the price of gold might revert a bit to the upside, after a drop during the last three days of the previous week. In this sense, the resistance level at $3,4K might be tested. On the opposite side, the situation on charts is a little bit tricky. Namely, there is a line which perfectly connects all lows from February this year. Friday's closing was exactly at this line, which again adds to the probability of a short reversal. However, if, in any case, the price of gold breaks this longer term trend, then it will indicate that the longer path to the downside is in store for gold.
maintain selling pressure around 3300, GOLD ⭐️GOLDEN INFORMATION:
Gold prices extended their slide for a fourth straight session, falling over 0.60%, as the U.S. and European Union reached a weekend trade agreement that halved proposed tariffs on EU goods—from 30% to 15%. XAU/USD is currently trading around $3,312, after earlier touching a high of $3,345.
The trade breakthrough lifted market sentiment, boosting risk appetite. Meanwhile, the U.S. Dollar is regaining strength, with the Dollar Index (DXY)—which measures the greenback against a basket of six major currencies—rising 0.99% to 98.64.
⭐️Personal comments NOVA:
Gold price maintains selling pressure around 3300, continuing the downtrend
⭐️SET UP GOLD PRICE:
🔥SELL GOLD zone: 3353- 3355 SL 3360
TP1: $3345
TP2: $3332
TP3: $3317
🔥BUY GOLD zone: $3287-$3285 SL $3280
TP1: $3295
TP2: $3307
TP3: $3320
⭐️Technical analysis:
Based on technical indicators EMA 34, EMA89 and support resistance areas to set up a reasonable SELL order.
⭐️NOTE:
Note: Nova wishes traders to manage their capital well
- take the number of lots that match your capital
- Takeprofit equal to 4-6% of capital account
- Stoplose equal to 2-3% of capital account
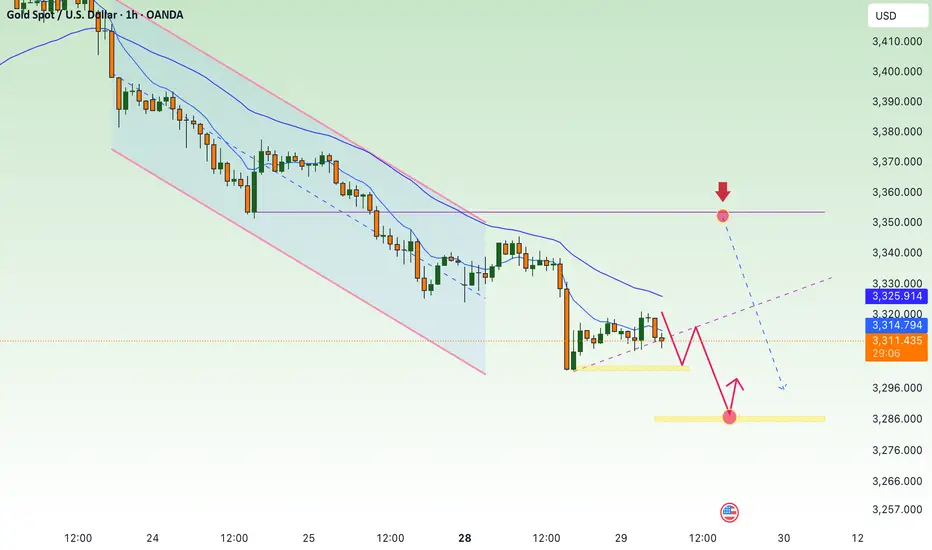
Analysis for the next week (XAUUSD) Hello Traders, Happy Weekend.
The market is going to open tonight, As you see the down trend is running, the price is falling like a waterfall.
Now the market is on the support area according to H1 & H4 TimeFrame.
The market is respecting the support area and there is a Trend line support according to D1 TimeFrame.
The market is respecting the Trend line and support area.
According to my analysis gold will drop till 3287 to 3271.
If gold fly, it can fly till 3350 then it will fall.
Stay tune for update.
Kindly share your views and leave positive comments here, Thanks.
GOLD WILL BOUNCEHappy new week Families, Gold is expected to bounce back to the up side from my indicated buy zone. All the best of the week.

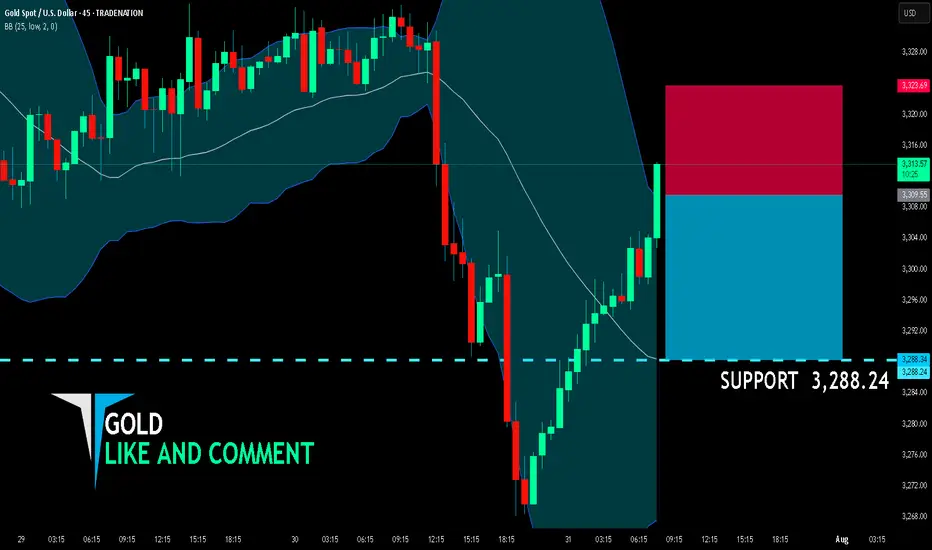
GOLD BEST PLACE TO SELL FROM|SHORT
GOLD SIGNAL
Trade Direction: short
Entry Level: 3,309.55
Target Level: 3,288.24
Stop Loss: 3,323.69
RISK PROFILE
Risk level: medium
Suggested risk: 1%
Timeframe: 45m
Disclosure: I am part of Trade Nation's Influencer program and receive a monthly fee for using their TradingView charts in my analysis.
✅LIKE AND COMMENT MY IDEAS✅
Bearish reversal?XAU/USD is rising towards the resistance level, which serves as a pullback resistance and could drop from this level to our take-profit target.
Entry: 3,319.22
Why we like it:
There is a pullback resistance.
Stop loss: 3,354.19
Why we like it:
There is a pullback resistance that aligns with the 38.2% Fibonacci retracement.
Take profit: 3,271.39
Why we like it:
There is a swing low support that lines up with the 127.2% Fibonacci extension.
Enjoying your TradingView experience? Review us!
Please be advised that the information presented on TradingView is provided to Vantage (‘Vantage Global Limited’, ‘we’) by a third-party provider (‘Everest Fortune Group’). Please be reminded that you are solely responsible for the trading decisions on your account. There is a very high degree of risk involved in trading. Any information and/or content is intended entirely for research, educational and informational purposes only and does not constitute investment or consultation advice or investment strategy. The information is not tailored to the investment needs of any specific person and therefore does not involve a consideration of any of the investment objectives, financial situation or needs of any viewer that may receive it. Kindly also note that past performance is not a reliable indicator of future results. Actual results may differ materially from those anticipated in forward-looking or past performance statements. We assume no liability as to the accuracy or completeness of any of the information and/or content provided herein and the Company cannot be held responsible for any omission, mistake nor for any loss or damage including without limitation to any loss of profit which may arise from reliance on any information supplied by Everest Fortune Group.

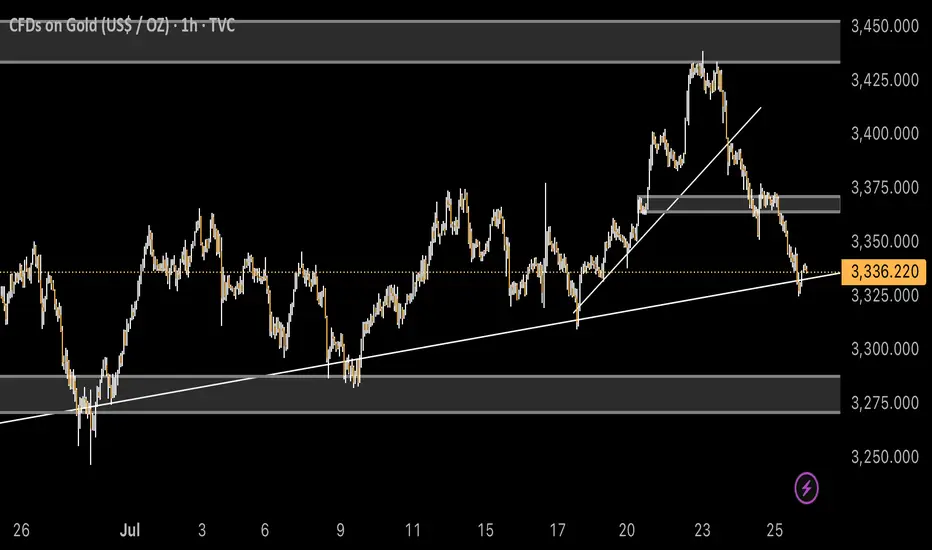
GOLD 1H: Fibo speaks louder than words - $3365 in focusGold is testing the upper zone near $3362–3365, which is just above the 0.5 Fibonacci level ($3353) from the previous impulse. The price has already bounced from the top of the channel, indicating potential exhaustion of the current upward move.
Technicals:
- MA50 and MA200 are below the price — bullish trend intact
- RSI is cooling down from overbought territory
- Fibo 0.5 ($3353) was breached, but no clear confirmation yet
- Channel resistance remains unbroken
Plan:
- If price rejects $3365, targets are $3340 and $3314
- If price holds above $3365, next move could be toward $3377+
- EMA structure supports further upside, but caution is needed at this zone
Gold isn’t shouting - it’s whispering key levels. Listen closely.
