GOLD BUY In the XAU/USD 2025 Forecast, FXStreet analyst Eren Sengezer suggests Gold’s 2025 outlook depends on Federal Reserve (Fed) policy, Donald Trump’s decisions and geopolitics. A bearish scenario could unfold if geopolitical tensions ease, inflation remains persistent and United States-China trade tensions weaken China’s economy, reducing Gold demand. A hawkish Fed could also pressure prices.
On the bullish side, continued global policy easing, a recovering Chinese economy or escalating geopolitical conflicts could boost safe-haven flows into Gold, supporting its resilience and pushing prices higher.
Gold's technical outlook suggests weakening bullish momentum, with the RSI at its lowest since February and XAU/USD. Key support lies at $2,530-$2,500, with further declines potentially targeting $2,400 and $2,300. On the upside, resistance at $2,900 could limit gains, with additional barriers at $3,000-$3,020 and $3,130 if Gold attempts a new record high.
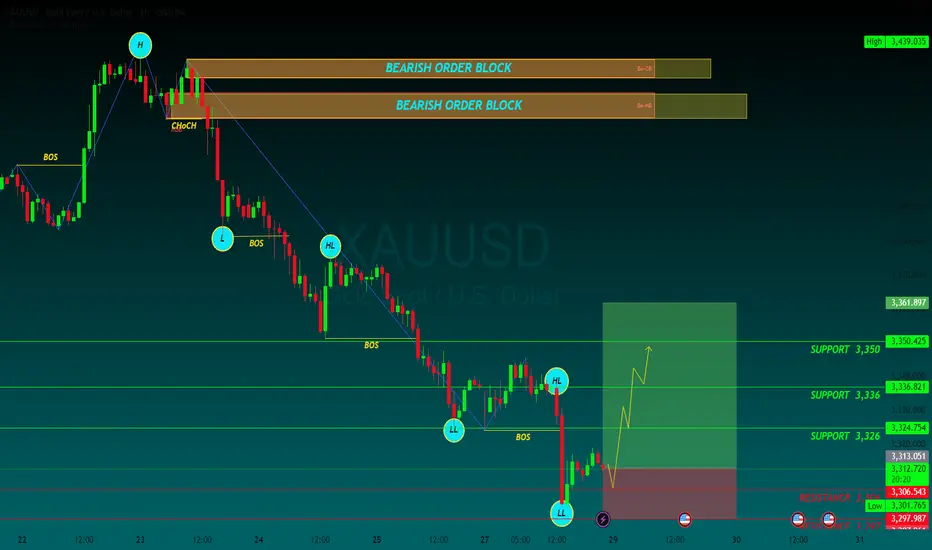
SUPPORT 3,326
SUPPORT 3,336
SUPPORT 3,350
RESISTANCE 3,306
RESISTANCE 3297
GOLDCFD trade ideas
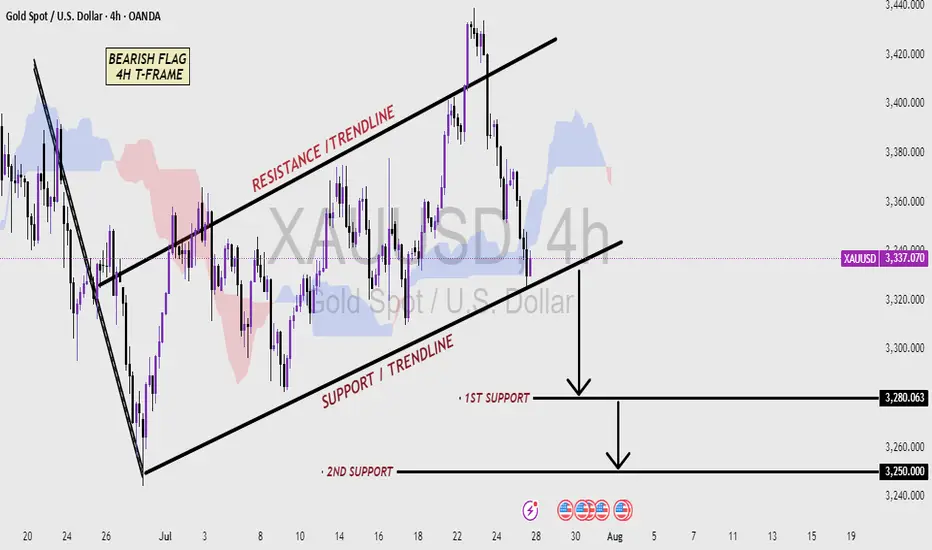
XAUUSD 4H CHART - Bearish pattern Analysis (read the caption)📉 XAUUSD 4H Chart – Bearish Flag Pattern Analysis
This 4-hour chart of Gold (XAUUSD) shows a classic Bearish Flag pattern, which is typically a continuation signal in a downtrend. After a strong bearish move, price entered a consolidation phase inside a rising channel, forming higher highs and higher lows—this creates the flag structure.
The price is currently trading within the Resistance and Support Trendlines of the flag. A break below the Support Trendline would confirm the bearish flag breakout, suggesting a continuation of the downtrend.
Key support levels to watch:
🔻 First Support: 3280.063 – Initial target after breakout
🔻 Second Support: 3250.000 – Extended target if bearish momentum continues
Traders should monitor for a confirmed breakdown with volume and bearish candlestick confirmation to validate short entries. This setup favors sellers if the support breaks decisively.
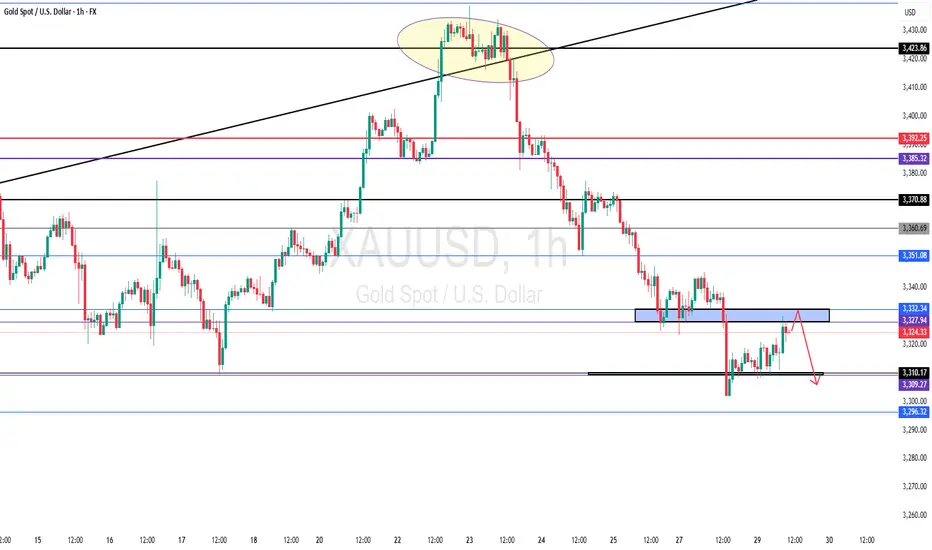
Excellent Profit on my Selling ordersAs discussed throughout my Friday's session commentary: "My position: I am Highly satisfied with recent results and will take early weekend break (no need to Trade more). If however you decide to Trade today, Sell every High's on Gold / no Buying until Monday's session (my practical suggestion)."
I have successfully re-Sold Gold from #3,338.80 with set of Selling orders, first batch I have closed around #3,327.80 Support for the fractal and second batch on #3,320.80 / another Support in extension / Highly satisfied with my Profits. I was aware that if Gold invalidates #3,318.80 Support / #3,310.80 extension can follow my Profit was already great to allow myself to Risk more which can backfire anytime.
Technical analysis: Not a bad start of the Trading week overall as the Price-action followed yesterday's session Gravestone Doji reversal formation into series of Bearish Hourly 4 chart’s candles, Gold is settling for a new Higher Low’s within former Hourly 4 chart’s Descending Channel. Despite this, the Weekly (#1W) candle remains on a (# -1.83%) and mostly Bearish values on my instruments. Daily chart continues to pile heavy Selling pressure on Gold so Technically my Short positions will see their value. The current Price-action is exactly on the Higher Low’s Upper zone as there is significantly more potential on the downside and as a results I do expect #3,300.80 psychological benchmark test as current decline is directly correlated with uptrend extension on DX (# +1.03%) and will most likely close the week in green values.
My position: I will continue re-Sells starting with #3,332.80 Resistance and my continuation will be re-Sell every High's on Gold unless Gold closes the market above #3,352.80 benchmark.

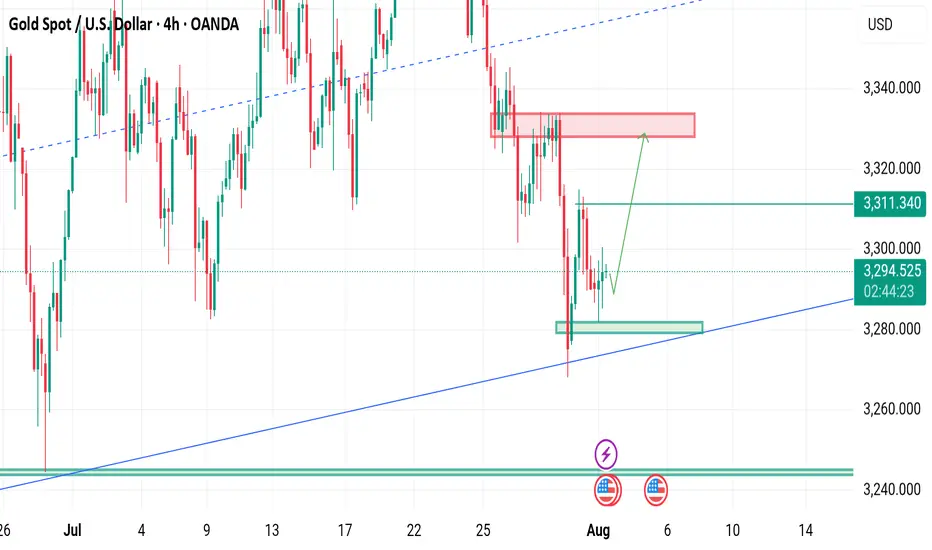
Gold short opportunityGold completed its mini bull flag target and re-entered a micro rising channel, a potentially bearish structure.
With price now testing a key supply zone, we’re watching for rejection to initiate a short, targeting the major demand zone below.

NFP ON DECK TODAY Gold is currently holding the Range of 3275-3310.
What's possible scanarios we have?
we have NFP data on deck today, expect potential volatility.
Until the release, gold may continue to range between 3275 and 3315.
This trade is totally unexpected how can gold react on numbers.
•If the H4 & D1 chart breaks below 3270, we could see a further drop toward the 3250 zone.
• Ifthe H4 & D1 chart flips above 3310, we could see a further Upside climb the 3335 -3345 zone.
Stay alert. Key levels in play.
#XAUUSD
GOLD - Near Current Resistance? holding or not??#GOLD... so market perfectly holds our expected bottom and bounced back and now market just near to his current Resistance region.
that is around 3328 to 3332
keep close that region because if market hold it in that case we can see again drop towards our ultimate support 3310
NOTE: we will go for cut n reverse above 3332 on confirmation.
good luck
trade wisely
Mid-Term Analysis on Gold (XAUUSD) (Weekly Chart)In this post I have laid out the two main Smart Wave Counts and scenarios for this pair. Note that the invalidation levels are to be monitored for confirmation of the counter cases.

XAUUSD SELL Don’t Miss This MoveAnalyzing market structure and liquidity using Price Action and Smart Money Concepts. Focuse
d on key supply/demand zones and institutional order flow

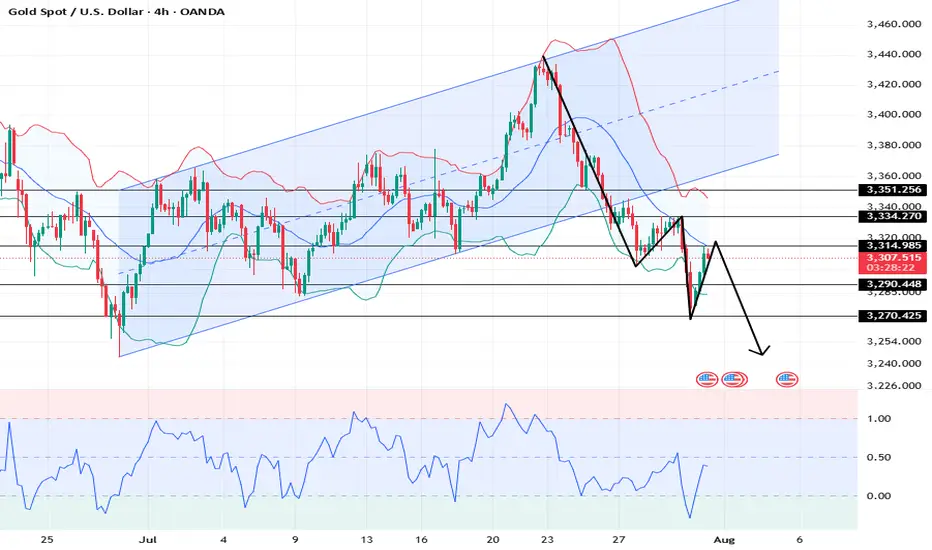
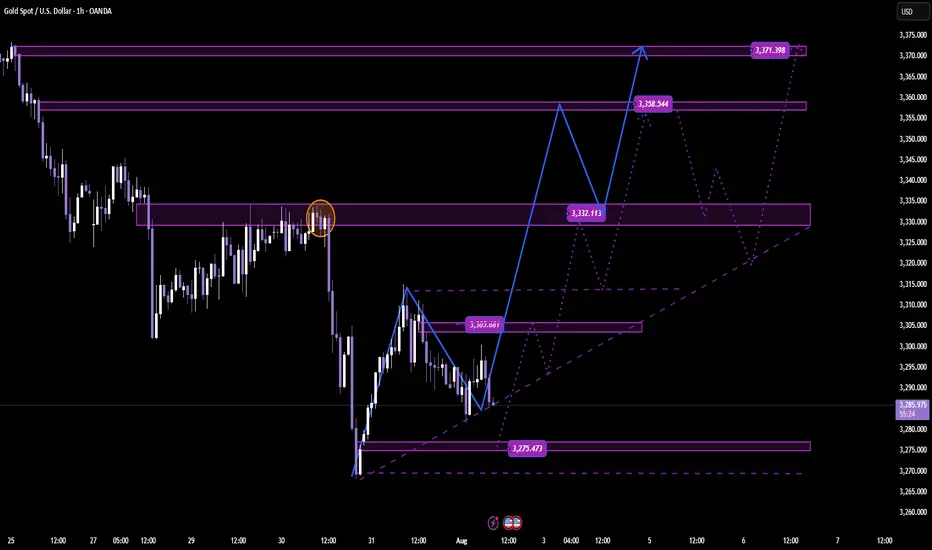
GOLD could test 3375 before falling furtherGOLD could test 3375 before falling further
In our previous analysis, we were looking for gold to fall from the top and, as we can see, it has already reached 3341 from the 3430 area.
From the top down, the price depreciated by 2.85% in less than 3 days, so a possible correction is expected near the area of the structure coming from the left side around 3375.
Given that gold is only moving down, it may be possible for the downward movement to continue slowly. Both scenarios are possible at this point.
You may find more details in the chart!
Thank you and Good Luck!
PS: Please support with a like or comment if you find this analysis useful for your trading day

XauusdThe market structure is bearish, but there is a possibility of a price increase to remove liquidity from traders.
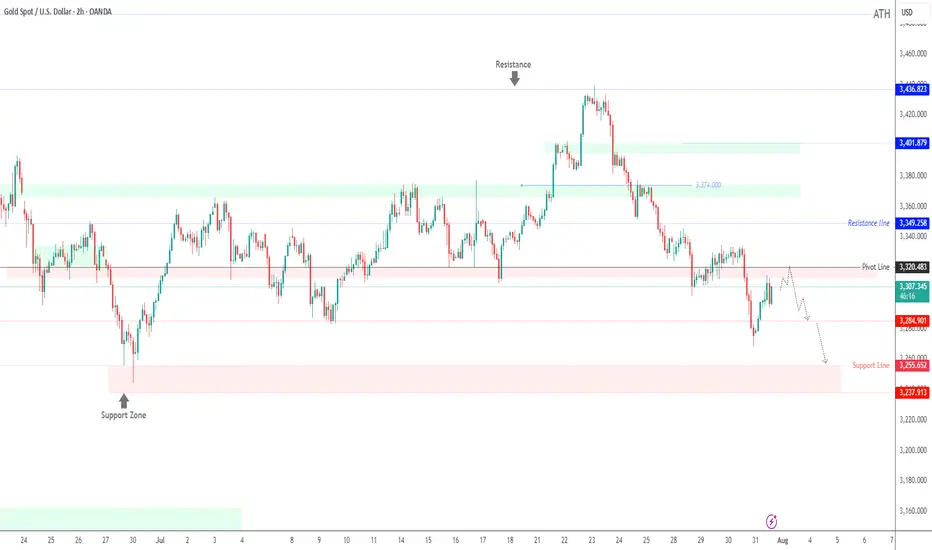
Gold Slips After Powell Speech Below 3320 Bearish Pressure BuildGOLD Overview
Market Context:
Gold declined from the 3333 level, as anticipated in yesterday’s analysis, ahead of Fed Chair Powell’s speech. Powell reiterated that it is still too early for rate cuts, citing persistently high inflation, which supported the U.S. dollar and pressured gold.
Technical Outlook:
As long as gold trades below the 3320–3310 zone, the bearish momentum is expected to continue, with the next target at 3285. A confirmed break and stability below 3285 could open the way toward 3255.
To regain bullish traction, the price must stabilize above 3320.
Support Levels: 3285 • 3255
Resistance Levels: 3333 • 3349
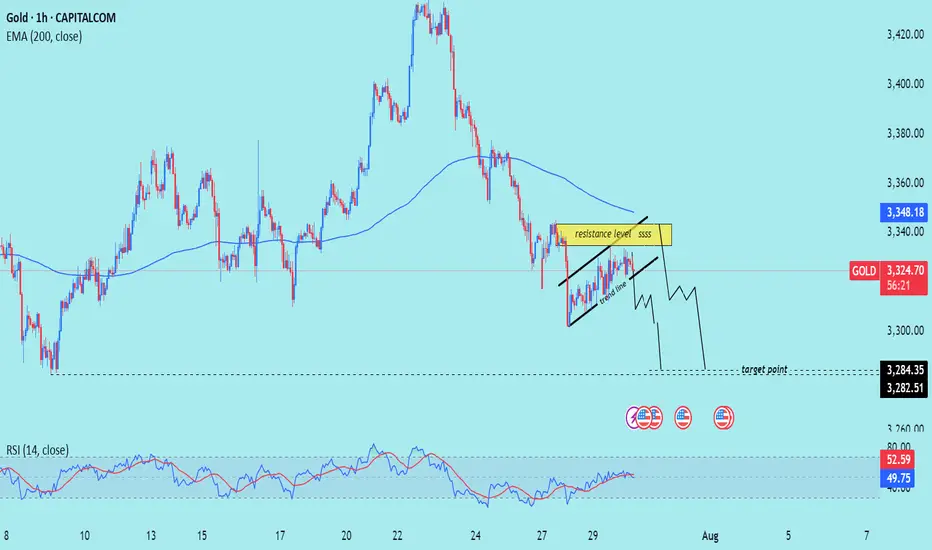
XAU/USD) Bearish Trend Read The captionSMC Trading point update
Technical analysis of Gold (XAU/USD) on the 1-hour timeframe, using a combination of trend lines, EMA, RSI, and price structure.
---
Technical Breakdown:
1. Price Structure:
Gold is forming a rising channel (black trend lines) within a short-term uptrend, but this is happening below the 200 EMA, which generally indicates bearish momentum.
A resistance zone is highlighted near the top of the channel, suggesting sellers might defend this level.
2. Key Level:
Resistance Level: Around 3,330–3,335 zone.
Target Point: Price is expected to break down from the channel and reach support levels near 3,284.35 and 3,282.51.
3. Moving Average (EMA 200):
Current price is below the 200 EMA (3,348.42), reinforcing a bearish bias.
4. RSI (14):
RSI is near 52.58, indicating neutral-to-slightly-overbought territory. No strong divergence is visible, but RSI is not confirming a bullish trend either.
5. Projection (Hand-drawn Path):
The drawn path shows a potential breakdown from the channel with a bearish impulse targeting lower support zones.
Mr SMC Trading point
---
Trade Idea Summary:
Bias: Bearish
Confirmation Needed: Break below channel support
Entry Zone: Near the resistance of the rising channel (~3,330–3,335)
Target Zone: 3,284.35 – 3,282.51
Invalidation: Sustained break above 3,348 (above EMA 200)
plesse support boost 🚀 this analysis)
Gold at major resistance and at fib 0.618 level breakout ? Gold after breaking the support, now again reached the support level which will be its resistance now, will it break it or get rejected form here. Enter the long only on breakout and retest till then its bearish trend.

XAU/USD – Current Wave Count & Potential ScenariosOANDA:XAUUSD
We are currently moving from (white) wave 3 to (white) wave 4.
So far, I am leaning towards the white count where the waves labeled (A), (B), (C) form a larger corrective wave A, which leads to wave B, and then to (white) wave 4.
Up to now, we have only completed (A) and (B).
Now, in the yellow bracket, we can interpret a 1-2-3-4-5 structure leading to (white) wave C 🟡.
Alternatively, one could interpret a triangle pattern (pink count):
Waves A, B, C, D, E, which would then form our wave 4.
In that case, we would expect bullish targets afterwards 🚀.
We need to watch closely if the price reverses or breaks through our yellow Fibonacci zone 🟡.
For now, we are primarily looking for upside potential 🔼.
From our yellow wave 2, we saw a downward push, which could theoretically be our yellow wave 1 leading into yellow wave 2 and the yellow Fibonacci zone — essentially a five-wave move from wave 2 to wave 3.

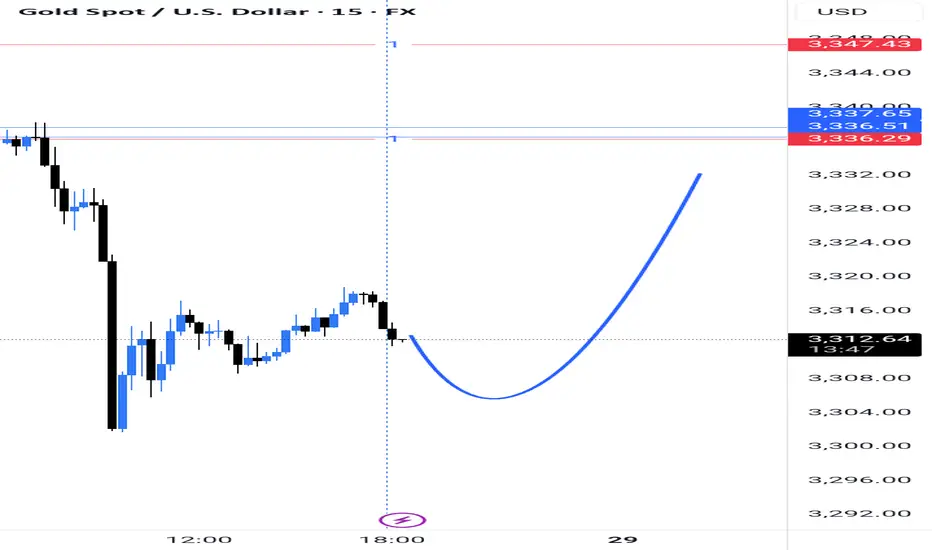
Market Expectations for Gold (XAU/USD)Gold is currently in a very critical zone, and in my view, it has room to rise toward the 3339–3345 level.
Once that zone is touched, I expect another drop to follow.
XAUUSD: Market Analysis and Strategy for July 31stGold Technical Analysis:
Daily chart resistance: 3351, support: 3250
4-hour chart resistance: 3335, support: 3270
1-hour chart resistance: 3315, support: 3290.
Gold was trading sideways between 3320 and 3333 yesterday before the New York market. During the US trading session, the release of US ADP employment figures and PCE price data was bearish for gold, causing it to plummet below Monday's low of 3301. The Federal Reserve held interest rates steady, and Powell's hawkish speech sent gold plummeting to around $3268.
Affected by the news, gold prices fell rapidly yesterday, reaching a low near the lower Bollinger band on the daily chart. It rebounded in the Asian session today, reaching a high near 3315. Selling is recommended in the sideways range between 3310 and 3320. The US PCE data will be released in the New York market, so avoid the news release period.
BUY: near 3290
SELL: near 3270
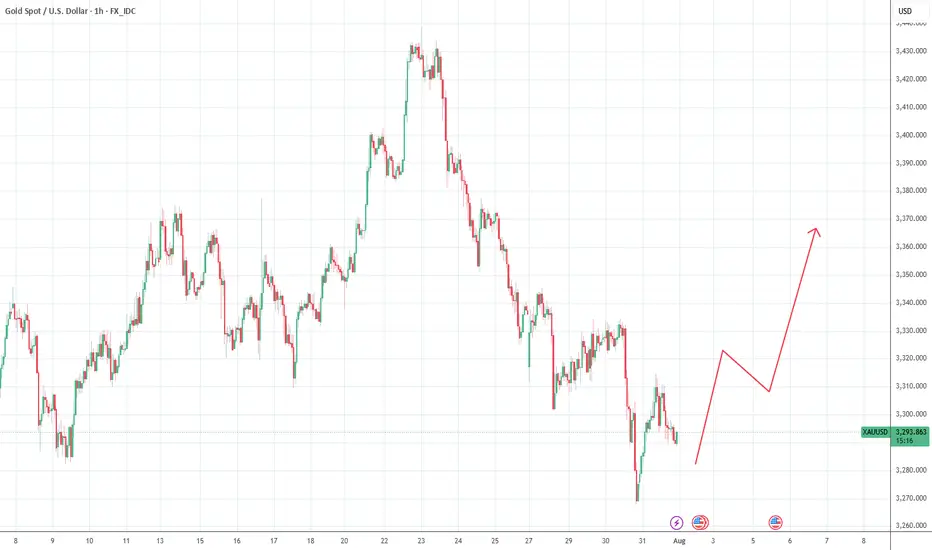
Continued recovery, positive after NFP news✍️ NOVA hello everyone, Let's comment on gold price next week from 08/04/2025 - 08/8/2025
⭐️GOLDEN INFORMATION:
Gold prices surged over 1.5% on Friday, climbing toward $3,350, as a weaker-than-expected U.S. Nonfarm Payrolls (NFP) report signaled a faster-than-anticipated slowdown in the labor market. Heightened geopolitical tensions between the U.S. and Russia further boosted safe-haven demand for the precious metal.
Following the disappointing July jobs data, markets began pricing in a potential interest rate cut by the Federal Reserve. While the Unemployment Rate held relatively steady, signs of labor market softness supported recent comments from Fed officials Michelle Bowman and Christopher Waller, who advocated for a 25-basis-point rate cut at the July 29–30 meeting.
Additional data added to the cautious sentiment: the ISM’s July report confirmed that U.S. manufacturing activity remains in contraction territory, while consumer confidence took a hit, according to the University of Michigan’s latest survey.
⭐️Personal comments NOVA:
Gold prices continue to be positively affected after last week's NFP news, market expectations of an early rate cut are rising
🔥 Technically:
Based on the resistance and support areas of the gold price according to the H4 frame, NOVA identifies the important key areas as follows:
Resistance: $3384, $3434
Support: $3331, $3307, $3268
🔥 NOTE:
Note: Nova wishes traders to manage their capital well
- take the number of lots that match your capital
- Takeprofit equal to 4-6% of capital account
- Stoplose equal to 2-3% of capital account
- The winner is the one who sticks with the market the longest

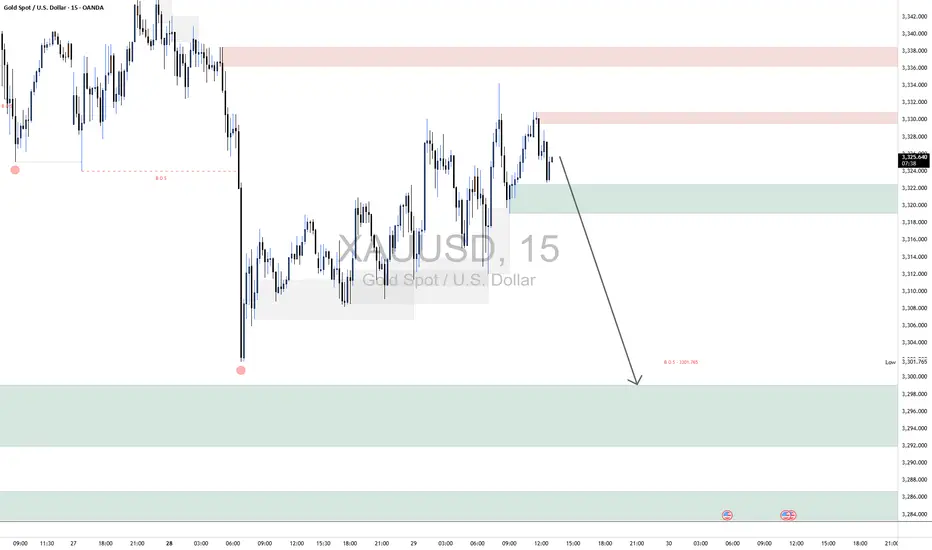
XAUUSD Short1. Market Structure Overview
The overall market structure on this 15-minute chart is bearish. A clear Break of Structure (BOS) occurred at $3,307.765, confirming that previous support failed and sellers are in control. After the BOS, price formed a lower high near $3,328, maintaining bearish momentum and setting the stage for potential continuation downward.
2. Supply & Demand Zones
The chart reveals two notable supply zones where sellers have been active. The first is a minor zone just above the current price, which has already triggered a rejection and shows signs of short-term bearish control. The second, positioned higher, marks the origin of a strong sell-off and represents a significant resistance level. On the demand side, the closest support zone lies just beneath the current price, but it appears weak due to prior tests. A stronger demand zone is located further down, where price previously saw an aggressive bullish reaction, indicating solid buyer interest. If bearish momentum continues, price may drop even lower into a deeper liquidity pocket—an area likely to attract strong institutional buying.
3. Price Action within the Current Region
Price is currently hovering around $3,325, inside a narrow range between the minor supply and weak local demand. After rejecting the upper supply zone, price is showing bearish intent. If the market maintains this rejection pattern, a drop toward the $3,293–$3,301 demand area is likely. This zone is expected to offer a bounce or at least temporary reaction due to the strong response seen there previously.
4. Trade Bias & Plan
The active bias is bearish. Short opportunities are favored while price remains below $3,328. Ideal short entries are from the rejection of the minor supply zone, targeting $3,301 and possibly $3,293. A clear break and hold above $3,329 would invalidate the short bias and shift focus toward higher liquidity levels. Until then, structure supports downside continuation.
5. Momentum & Confirmation
Momentum is currently favoring sellers. The lower highs and strong rejections near supply reinforce the bearish bias. Confirmation for continuation comes from bearish engulfing candles and sharp rejections from supply zones. A clean break below the nearest demand zone would further validate the move toward deeper targets.
Bullish Momentum Ahead? XAAUSD Price to Watch!The market just closed above 3,353 , which is our BOS and RBS level. It was previously a resistance, then became support, and now it's being tested as resistance again. Looking at how gold moved last week, it came really close to the major resistance area I had marked. Unfortunately, it didn’t quite reach my pending order, which was set just a bit lower.
After reviewing the price action, I noticed that gold reacted to an order block before making its move upward. Luckily, we managed to catch a nice HnS sell setup & the golden zone fibo I had marked earlier, using my trusted golden Fibonacci levels. They’ve consistently delivered reliable entries.
Looking ahead to the upcoming week, I’ll be using the same golden fibo setup. The market is showing a clean pattern, and I’ve already mapped out a solid entry zone. The zone is fairly wide, but with proper risk management and entry layering, there’s definitely good potential for profit .
Let’s see how things play out next week. That’s all from me for now. If you found this helpful, feel free to like and follow for more analysis.

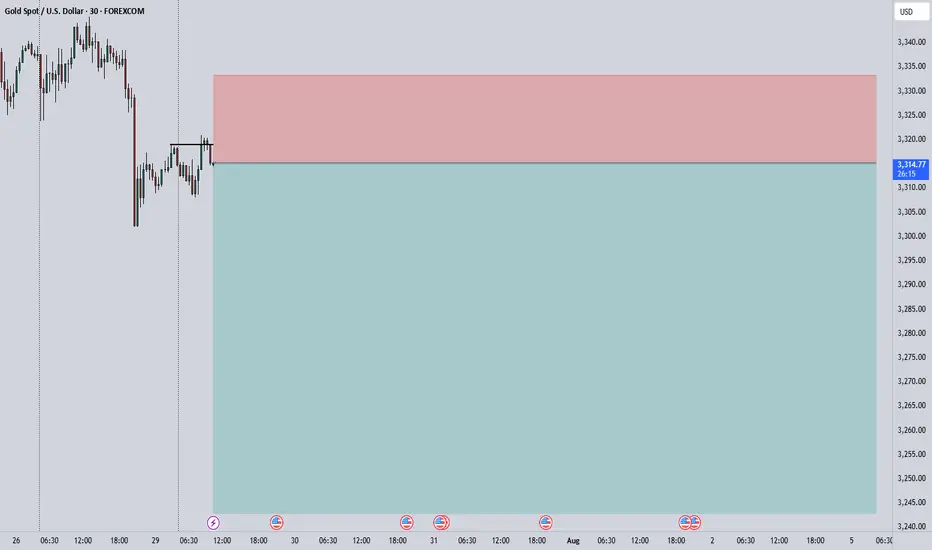
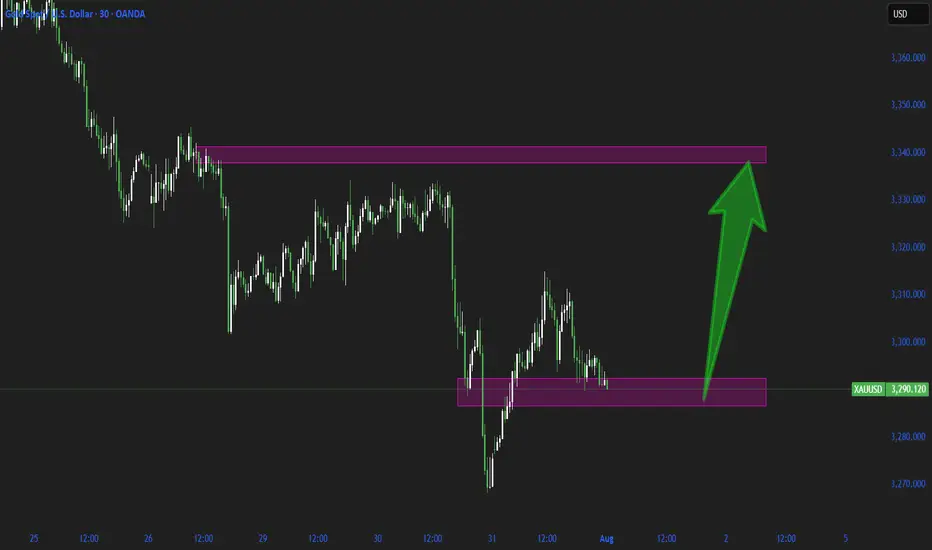
DAILY SCALPING PLAN | CLINTON SMC STYLE✅ XAU/USD - DAILY SCALPING PLAN | CLINTON SMC STYLE
📆 Date: August 1st, 2025
📍 Strategy: Smart Money Concepts (SMC)
🔑 Focus: Liquidity Sweep | Order Block | BOS | Premium/Discount Model
🔍 Market Overview
Gold (XAU/USD) is currently in a manipulation phase after a strong move down from a premium supply zone. The market has swept key liquidity and is preparing for a high-probability move in both directions based on Smart Money footprints.
Current structure suggests:
Bullish intent forming from a discount demand zone.
Liquidity resting above recent highs – perfect for short-term scalps and intraday swings.
🟢 BUY SETUP – DISCOUNT DEMAND REACTION
🎯 Entry: 3275
🛡️ Stop Loss: 3268
🎯 Take Profits:
TP1: 3285
TP2: 3295
TP3: 3305
TP4: 3315
TP5: 3325
TP6: 3335
Reasoning:
This is a clean bullish OB resting beneath a CHoCH and BOS zone. Price may wick into this area as Smart Money reloads after sweeping early long positions. If held, expect sharp upside expansion toward previous liquidity highs.
🔴 SELL SETUP – PREMIUM SUPPLY REJECTION
🎯 Entry: 3356
🛡️ Stop Loss: 3362
🎯 Take Profits:
TP1: 3350
TP2: 3345
TP3: 3340
TP4: 3330
TP5: 3320
Reasoning:
This level is a key supply block where price previously distributed. If price expands into this zone, it’s likely to act as a liquidity magnet for Smart Money to offload longs and enter short-term shorts. Expect reaction.
🧠 SMC Insights
Internal BOS & CHoCH signal early signs of accumulation.
Price respects the premium vs. discount framework with clear liquidity targets.
SMC traders understand that price doesn’t move randomly – it targets liquidity, mitigates OBs, and respects structure.
🔔 Note:
Always wait for clear confirmation (rejection wick, engulfing pattern, or M15 structure shift) before execution. Entries without confirmation are riskier in current volatility.
📌 Follow @ClintonScalper for daily SMC scalping plans & deep institutional insight.
🔁 Like, comment & share if you find this helpful!
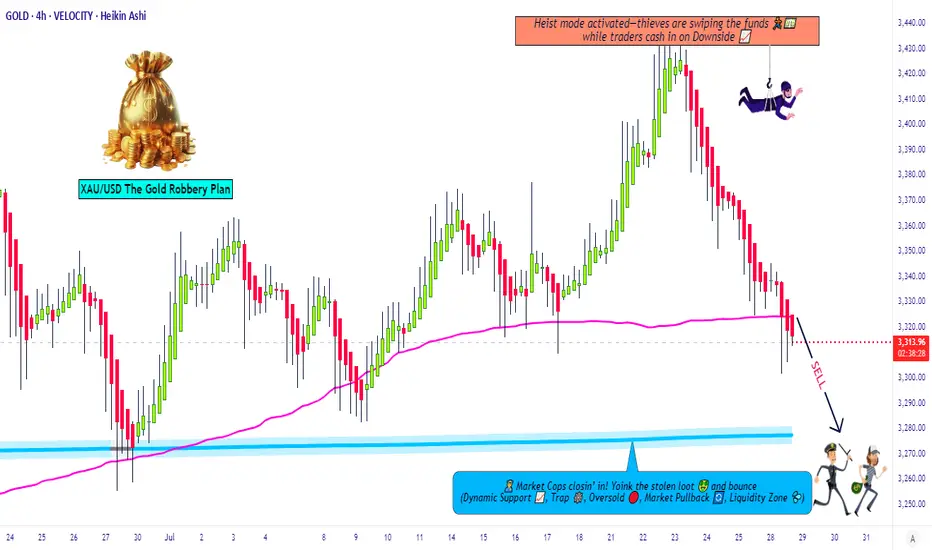
Gold Robbery Blueprint: Smart Bears on the Move Now!💣 XAU/USD GOLD HEIST PLAN: Robbery Begins at Resistance Zone! 🔐💰
🌟Hi! Hola! Ola! Bonjour! Hallo! Marhaba!🌟
Dear Money Makers & Market Robbers, 🕵️♂️💸🚀
Welcome to another strategic strike by Thief Trading Style™—where smart analysis meets bold execution. We're targeting XAU/USD (Gold) in this scalping/day-trade opportunity, primed with fundamentals, technicals, and pure robbery logic.
🔍 THE GAME PLAN
We're looking at a neutral zone turning bearish, and here’s how the robbery unfolds:
🔑 ENTRY POINTS
🎯 “Vault wide open” signal!
Initiate short orders at current price zones or set layered SELL LIMITS near swing highs on 15M/30M charts. We're running a DCA-style pullback entry for max loot.
🕵️♀️ Entry isn't about one shot—it's about precision raids.
🛑 STOP LOSS: THE ALARM SYSTEM
Set SL just above the nearest swing high (4H timeframe preferred).
Use candle wick tips as your defense line (Example: 3350.00).
Adjust SL based on risk appetite and number of orders stacked.
🎯 TARGET: THE GETAWAY PLAN
💸 First Vault: 3280.00
💨 Or escape earlier if price action signals reversal. Protect your gains. Professional thieves don't get greedy.
📊 WHY WE’RE ROBBING HERE
This level is a high-risk barricade zone—police aka "market makers" are strong here.
We spotted consolidation, oversold signals, trend reversal setups, and a bullish trap disguised as support. A perfect time to strike. 🧠🔍
📰 FUNDAMENTAL & SENTIMENTAL CHECKPOINTS
🔎 Stay updated with:
Global news drivers
Macro & Intermarket analysis
COT reports & future trend targets
👉 Check the 🔗🔗🔗
⚠️ TRADING ALERT - STAY SAFE DURING NEWS BOMBS!
Avoid entries during major economic data releases.
Use trailing SL to protect running profits.
Monitor volatility spikes & price anomalies.
💖 JOIN THE CREW, BOOST THE HEIST!
If this plan adds value to your trades, hit that Boost Button 💥
Support the Robberhood and help grow the gang of smart money snipers 🕶️💼💣
Every boost = more ammo for next mission. Let's rob the market—not each other. 🚀🤑
📌 Remember: Market is fluid. Stay sharp, adapt quick, and trade like a shadow.
Catch you soon in the next grand heist 🎭💼
#XAUUSD #GoldTrade #ScalpingStrategy #DayTrading #ThiefTrader #RobTheMarket #BoostForMore #NoChaseNoCase