XAUUSD 4H CHART - Bearish pattern Analysis (read the caption)📉 XAUUSD 4H Chart – Bearish Flag Pattern Analysis
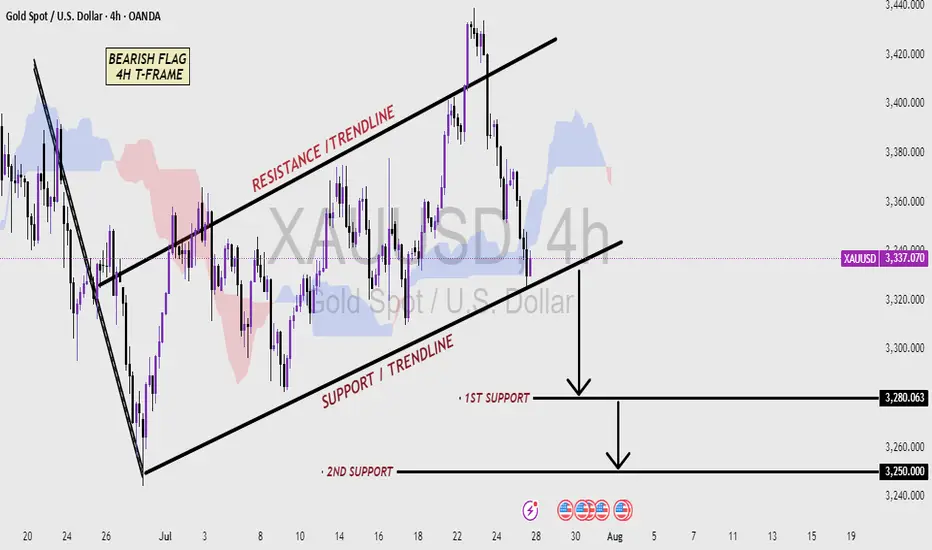
This 4-hour chart of Gold (XAUUSD) shows a classic Bearish Flag pattern, which is typically a continuation signal in a downtrend. After a strong bearish move, price entered a consolidation phase inside a rising channel, forming higher highs and higher lows—this creates the flag structure.
The price is currently trading within the Resistance and Support Trendlines of the flag. A break below the Support Trendline would confirm the bearish flag breakout, suggesting a continuation of the downtrend.
Key support levels to watch:
🔻 First Support: 3280.063 – Initial target after breakout
🔻 Second Support: 3250.000 – Extended target if bearish momentum continues
Traders should monitor for a confirmed breakdown with volume and bearish candlestick confirmation to validate short entries. This setup favors sellers if the support breaks decisively.
GOLDCFD trade ideas
Selling activated ▪️I'm expecting selling at 3345-3348 from my zones although I took a small risk of sell at 3342
And my Targets will be 3333-3324
▪️Secondly if H4 candle closing below 3250 I will not sell till next stability
This trade is based on liquidity sweeps
#XAUUSD
Excellent re-Sell opportunities from #3,332.80 ResistanceAs discussed throughout my yesterday's session commentary: "My position: I will continue re-Sells starting with #3,332.80 Resistance and my continuation will be re-Sell every High's on Gold unless Gold closes the market above #3,352.80 benchmark."
Firstly I have Sold Gold on #3,321.80 with my set of Selling orders and in addition I have added Sells at #3,318.80 / closing all on #3,312.80 / first line of wall of Supports ahead of #3,300.80 benchmark. Then I have planned to re-Sell strong on #3,332.80 with Double Lot and closed my order on #3,322.80 (#3,332.80 - #3,322.80) which delivered excellent results. I am making spectacular Profits from my key reversal zones.
Technical analysis: Gold is Trading within my predicted values however both sides are equally probable at the moment. Needless to mention, Price-action is on important Short-term crossroads. Since #3,300.80 psychological benchmark isn't invalidated even with DX on extended relief rally, now Bullish reversal is possible towards #3,342.80 first Resistance, then #3,352.80 mark Trading above the fractal. Also #3,320.80 - #3,332.80 Neutral Rectangle Trading is possible until I have a break-out.
My position: My break-out points on both sides are calculated and ready to be used for more Profits.

GOLD OUTLOOKMy view on Gold ..
More likely to retrace to the bearish PRZ from where i'll be looking for Sell setup on the lower time frames

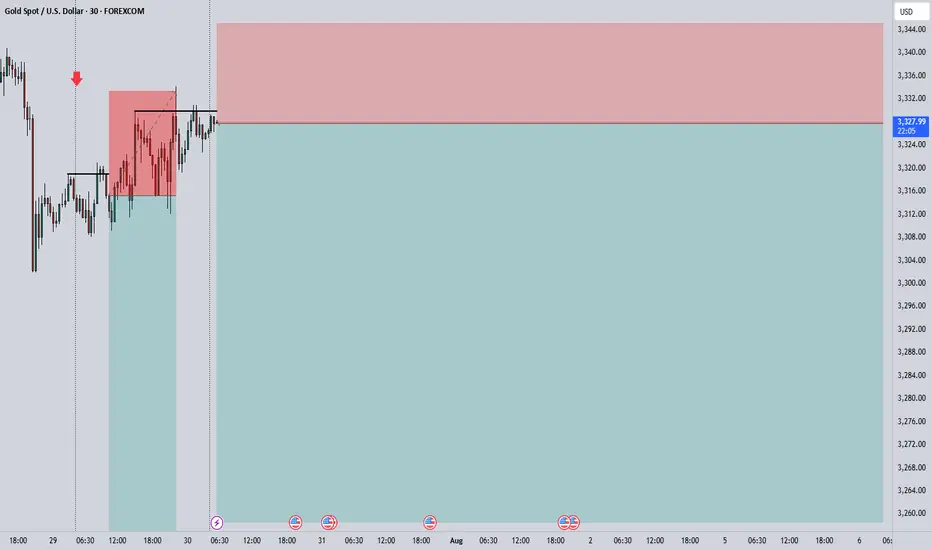
GOLD BUY M15 Gold (XAUUSD) 15-Min Chart Analysis – July 31, 2025
The chart shows a clear bullish structure after a confirmed Change of Character (ChoCH) and Break of Structure (BOS) on the lower time frame. Price has broken above previous resistance zones, indicating strong buying momentum.
Entry Zone:
Price is currently retesting a demand zone (highlighted in pink).
Ideal buy entry was taken after the bullish ChoCH.
Stop Loss:
SL: 3397, placed just below the demand zone for risk protection.
Targets / Resistance Levels:
1. First Resistance: 3308
2. Second Resistance: 3311
3. Third Resistance: 3316
4. Final Target: 3325
Bias:
Bullish, expecting higher highs as long as price holds above the demand zone.
Break and retest strategy is forming, suggesting continuation toward the final target.

Gold Eyes QML Resistance: Ready for a PullbackHelloooo!
Gold, after gapping up strongly, has now entered the green QML (Quasimodo Level) supply zone at roughly 3,380–3,390. This zone has acted as resistance before, so a reaction here makes perfect sense.
What I see:
Engulfed Level (3,315.66): Earlier support that got taken out. This is our logical pullback target once the QML zone does its job.
Hurricane Move: The big up-spike looks exhausted now that it’s hit the QML.
Bearish Reversal Odds: if sellers step in around current levels, expect a drop back toward 3,315.
Plan: Watch for bearish candles or a failed rally inside the 3,380–3,390 area. If we see clear rejection, target a swift move down to 3,315, with a further slide possible to the 3,260 demand zone if momentum holds.

XAUUSD Weekly Outlook – August 4–8, 2025
The question isn’t whether gold is strong. The question is — will price expand, or rebalance?
🔸 Macro Overview
Gold begins the week consolidating just below its final HTF supply zone (3439), while USD weakens amid mixed macro data and growing speculation of future rate cuts. Markets await fresh catalysts, and gold’s recent impulsive rally is now facing the big test: break the wick, or pull back?
🔸 Weekly Structure & Bias
Element Observation
🔹 Trend Bullish continuation — clean structure
🔹 Last BOS March 2025 — impulsive, with imbalance below
🔹 Price Action Top wick rejection forming near 3439
🔹 Bias Still bullish, but entering exhaustion zone
🔹 RSI Above 70 — overheated
🔹 EMAs EMA5 > EMA21 > EMA50 > EMA100 — perfect trend
🔸 Key Weekly Levels (Zones + Confluences)
Zone Type Price Range Confluences
🔴 Supply 3350 – 3439 HTF wick supply + FVG + RSI 70+ + liquidity trap
🔵 Demand 3270 – 3215 Weekly OB + FVG + EMA21 support
🔵 Demand 3120 – 3070 Old BOS + deep FVG + psychological level
🟢 Support 3000 zone EMA50 + historical consolidation
🔸 Fibonacci Extensions (Above 3439)
Extension Level Price Target Confluences
1.0 (Swing Full) 3439 Supply wick high
1.272 3505 Next psychological milestone
1.414 3560 Mid-extension + liquidity
1.618 3610 Golden expansion target
2.0 3740 Full trend extension (max)
🔺 These levels serve as potential breakout targets ONLY if we get a confirmed weekly close above 3439 with clean BOS on LTF.
🔸 Weekly Scenarios
🟢 Scenario 1 – Break and Expand
If gold breaks 3439:
Expect clean continuation to 3505 → 3560 → 3610
Best entries come from new OBs on H4/D1 around 3350–3370
Follow momentum — but don’t chase without retrace confirmation
🔻 Scenario 2 – Rejection + Retracement
If price holds below:
Pullback toward 3270 – 3215 expected
EMA21 acts as dynamic support
If selloff gains strength, next demand = 3120 – 3070
🎯 This zone aligns with macro OB + re-entry for long-term bulls.
🔸 Conclusion & Gameplan
Gold is pressing against its final weekly ceiling.
Structure remains bullish, but every sniper knows — at the edge of premium, timing is everything.
✅ Above 3439 → expansion opens to 3505 → 3560 → 3610
🟦 Below 3439 → retracement into 3270 → 3215 → 3070
The best setups will be born from confirmation, not prediction. Let the market decide.
—
What would you do if 3439 rejects hard this week?
Comment your plan, tag your sniper level, and let’s stay ahead together 💬
—
With clarity, confidence, and perfect timing,
GoldFxMinds 💙
Disclosure: Analysis based on Trade Nation (TradingView) chart feed.

XAUUSD Weekly Outlook | $3,285 Key Level and Structure SetupHere’s my outlook on gold (XAUUSD) for the week of August 4–9, 2025.
Last week’s move was shaped by strong early dollar momentum, a 3% U.S. GDP report midweek, and Friday’s sentiment shift after the surprise tariff announcement.
Price is now sitting near the $3,380 supply zone, a structure that’s been in play since April. I highlight:
✅The key demand zone ($3,245–$3,285)
✅The broken descending trendline is now acting as support
✅Potential reaction around $3,360 early in the week
✅$3,285 remains my key level going forward. If ever price comes close, I’m watching for signs of strength or breakdown there to guide my setups.
I’ll update my thoughts in the comments as price action unfolds.
Disclaimer:
Based on experience and what I see on the charts, this is my take. It’s not financial advice—always do your research and consult a licensed advisor before trading.

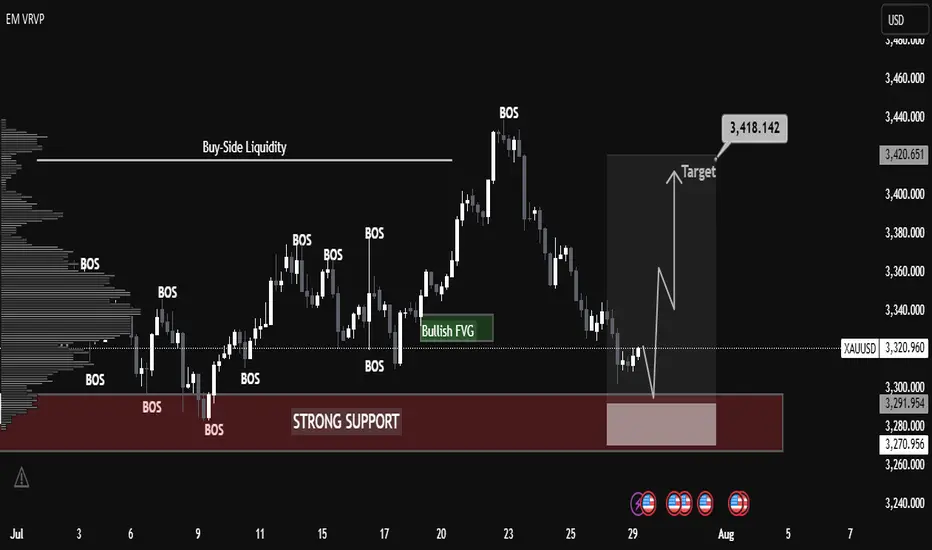
XAUUSD Technical Analysis – Strong Bullish Move Expected XAUUSD Technical Analysis – Strong Bullish Move Expected from Support Zone
Date: July 29, 2025
Chart Type: Price Action | Smart Money Concept (SMC) | Volume Profile
🧠 Educational Breakdown:
1. Strong Support Zone (Demand Area):
Price has entered a clearly marked strong support zone around $3,270 - $3,292.
This zone has previously acted as a major demand level, where buyers stepped in to reverse bearish pressure.
High volume node from the Volume Profile on the left confirms significant historical interest in this price region.
2. BOS – Break of Structure:
Multiple Break of Structures (BOS) throughout the uptrend confirm bullish market intent.
The recent decline appears corrective, not impulsive, suggesting a potential bullish continuation.
3. Bullish Fair Value Gap (FVG):
A Bullish FVG is visible just above current price, acting as a magnet for price action.
This imbalance is often targeted before further market movement, supporting the idea of an upcoming bullish move.
4. Liquidity Grab Setup:
Price dipped into the support area likely to sweep liquidity (stop losses) before a reversal.
This is a common Smart Money trap, where institutional players grab liquidity before moving the market in the intended direction.
5. Target Zone:
A clear target is set around $3,418, aligning with previous highs and potential Buy-Side Liquidity.
The projected move represents a clean higher high, following the higher low formed at the support zone.
Confirmation: Wait for bullish engulfing or displacement candle on lower timeframe (M15-H1).
Volume Support: Look for rising volume during the reversal to confirm smart money participation.
📘 Conclusion:
Gold (XAUUSD) is showing a textbook bullish reversal setup from a high-demand zone. With strong structural support, fair value gap targeting, and buy-side liquidity above, the setup favors bullish continuation toward $3,418.
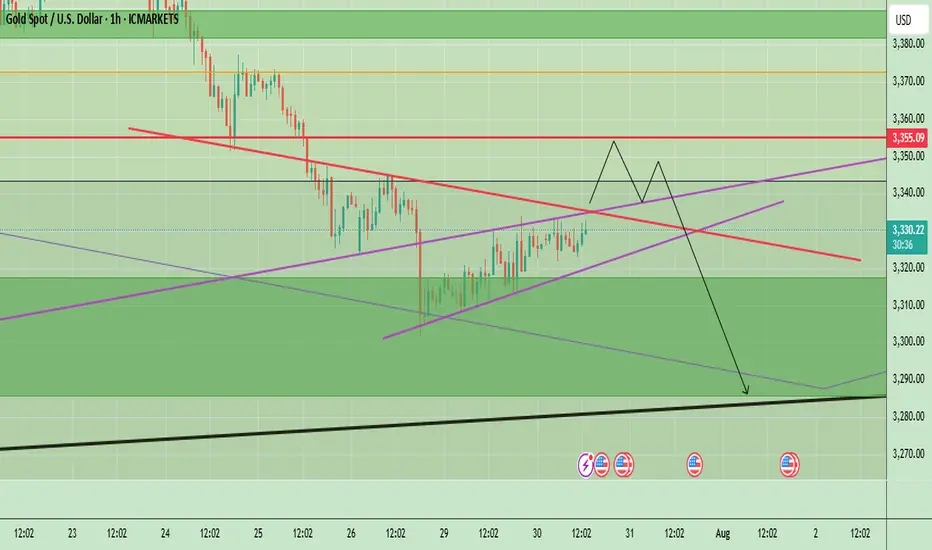
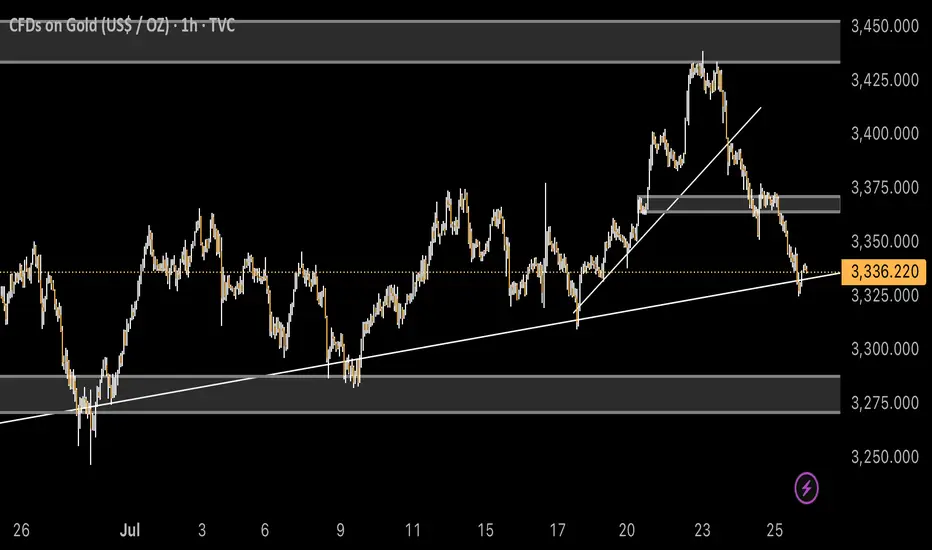
Gold Awaits Fed Rate Decision – Key Levels & Volatility AheadGold is currently trading near $3,332, showing a minor recovery after recent downward momentum. The price action on the 1-hour chart highlights a short-term ascending structure, which often acts as a corrective move rather than a strong bullish trend. The market previously saw significant selling pressure from above $3,355–$3,360, creating a short-term supply zone. Unless the price breaks and holds above this zone, the overall momentum remains bearish.
The chart also shows a projected price path where gold could push slightly higher toward $3,355, meet resistance, and potentially reverse downward again. Key support lies at $3,320, and if this breaks, we could see gold testing $3,290–$3,280 levels, aligning with the black trend line support. However, if bulls manage to break above $3,360, it would signal potential upside continuation toward $3,380–$3,400.
Key Points
- Key Resistance Levels: $3,355 and $3,360 (critical supply zone).
- Key Support Levels: $3,320 (short-term), followed by $3,290–$3,280 (major trendline support).
- Expected Short-Term Move: Possible push toward $3,355 → rejection → decline back toward $3,320 and possibly $3,290.
Bullish Breakout Scenario: A strong close above $3,360 could push price toward $3,380–$3,400.
Overall Bias: Bearish while trading below $3,360.
4hr Chart
Price remains under pressure below the descending trendline. A small pullback toward $3,345–$3,350 is possible, but as long as price stays under this resistance, the bias remains bearish with potential downside targets around $3,300–$3,280.
Key Levels:
- Resistance: $3,350 → $3,381 → $3,394
- Support: $3,324 → $3,281 → $3,254
Today’s FOMC interest rate decision is a key driver for Gold. Here’s the quick analysis:
- If Fed Hikes Rates or Maintains Hawkish Tone:
- Strong USD likely → Gold could face more selling pressure.
- Key support zones: $3,324 – $3,300, then $3,281 and $3,254.
- If Fed Pauses or Turns Dovish:
- Dollar weakens → Gold may bounce toward resistance zones.
- Upside levels: $3,355 – $3,360 and higher toward $3,381 – $3,394 (Fib levels).
Expect high volatility; $3,300 is a critical support to watch. A dovish Fed may give Gold short-term relief, but a hawkish stance could accelerate the downtrend.
Note
Please risk management in trading is a Key so use your money accordingly. If you like the idea then please like and boost. Thank you and Good Luck!
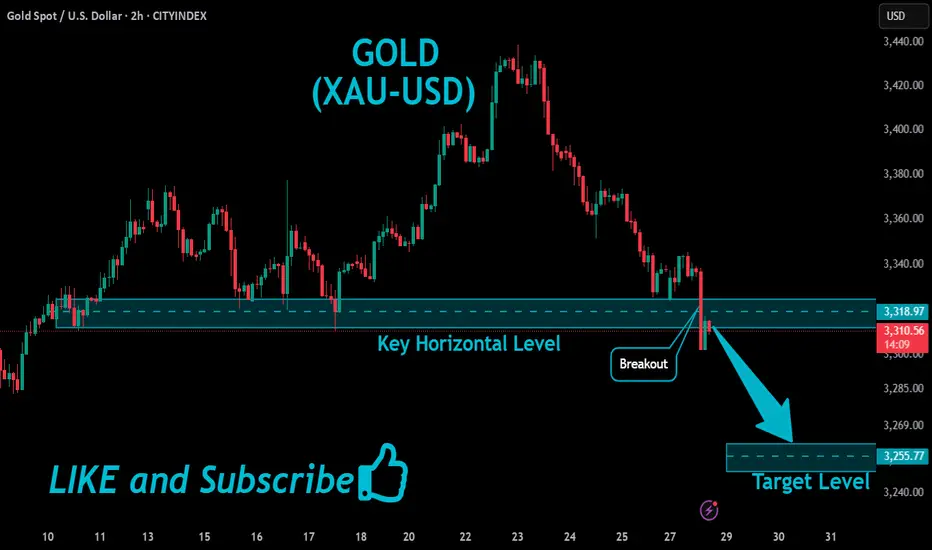
GOLD Bearish Breakout!
HI,Traders !
#GOLD is trading in a strong
Downtrend and the pair
Broke the key horizontal
Level around 3318.97 which
Reinforces our bearish
Bias and we will be
Expecting a further
Bearish move down !
Comment and subscribe to help us grow !
Gold 1H Intra-Day Chart 28.07.2025We saw a perfect move towards our $3,310 target, hitting our TP. What's next?
Option 1: Gold now moves higher into the $3,385 area, before we can determine the next major move.
Option 2: Gold drops lower towards $3,265 next.
Which scenario do you find more likely?
Sell xauusdGold recently breaks it's buy trend and retested it
Now looking for sell on h4 chart
This current level not much good for buyers
XAUUSD – Strong Bullish Reversal from Key Support XAUUSD – Strong Bullish Reversal from Key Support
Chart Summary:
Gold (XAUUSD) has shown a clear reaction from a strong support zone near 3260, suggesting bullish momentum is gaining strength. The chart highlights multiple key market structure elements and confirms the potential for a bullish move.
Technical Highlights:
🔻 Strong Support Zone (3260–3280):
Price tapped into a well-defined demand zone with historical significance, initiating a bullish response.
🔺 Resistance Zone (3460+):
A strong resistance level lies ahead. This area may act as a potential target for bulls.
🔁 Break of Structure (BOS):
Multiple BOS marks on the chart indicate trend shifts and liquidity grabs. Most recent BOS aligns with potential reversal.
💹 Bullish Fair Value Gap (FVG):
A bullish FVG near mid-structure confirms institutional interest and adds confluence to the upside move.
📈 Target: 3,366.984 USD
Marked as the next probable short-term liquidity target. If momentum sustains, price may approach resistance above this.
Price Expectation:
If the current bullish momentum holds above the strong support zone, we may see a rally towards 3,366–3,400 USD.
This move could be driven by:
Buy-side liquidity grab above prior highs
Breakout traders entering above BOS
Reaction to macroeconomic calendar (highlighted on the chart)
✅ Educational Takeaway:
This is a textbook example of:
Support-resistance flip
Liquidity concepts (Buy-Side Liquidity)
Fair Value Gaps usage
Volume Profile confluence

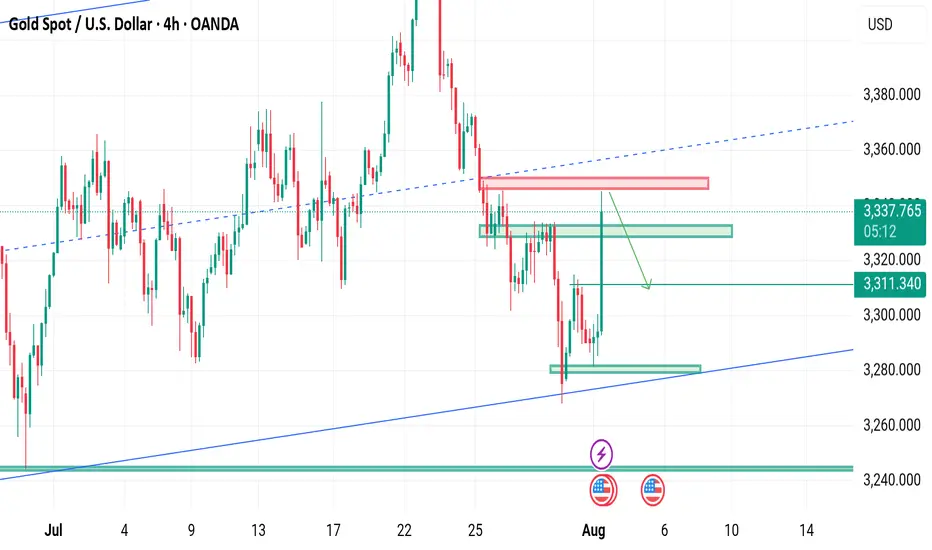
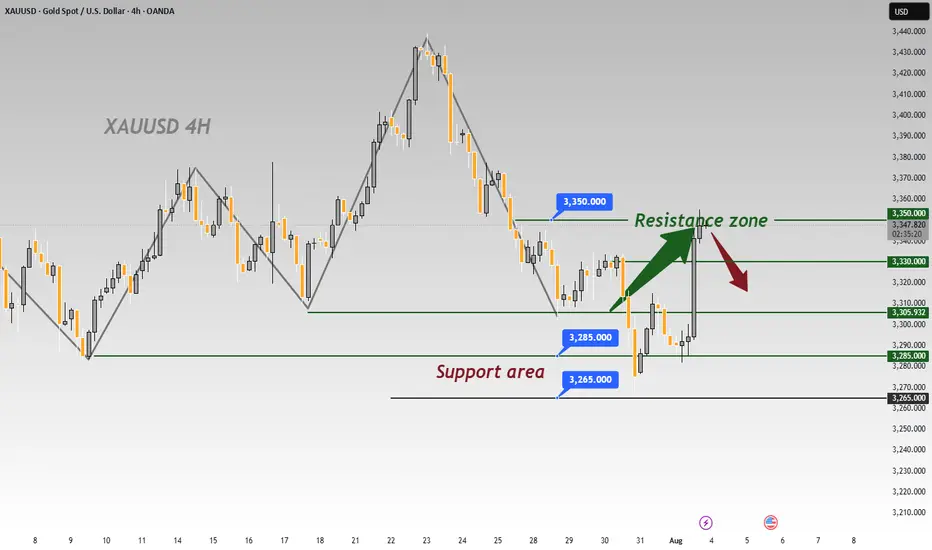
July 31, 2025 - XAUUSD GOLD Analysis and Potential OpportunitySummary:
The Fed held interest rates unchanged, and Powell’s remarks reduced the likelihood of a rate cut in September — this is fundamentally bearish for gold. Until new fundamental developments emerge, the strategy remains: sell on rallies into resistance.
After reviewing the 4H chart, I see two possible scenarios:
Price continues down to 3245, pulls back to 3283, then resumes the drop toward 3245 or even lower.
Price pulls back immediately toward 3300, then resumes the downtrend toward 3245.
These are ideal cases — I will still wait for clear confirmation before taking action.
🔍 Key Levels to Watch:
• 3323 – Resistance
• 3309 – Resistance
• 3300 – Psychological level
• 3283 – Key resistance
• 3268 – Short-term support
• 3260 – Support
• 3245 – Major support
• 3233 – Support
📈 Intraday Strategy:
• SELL if price breaks below 3268 → target 3265, then 3260, 3255, 3250
• BUY if price holds above 3283 → target 3289, then 3295, 3300, 3305
👉 If you find this helpful or traded using this plan, a like would mean a lot and keep me motivated. Thanks for the support!
Disclaimer: This is my personal view, not financial advice. Always use proper risk control.

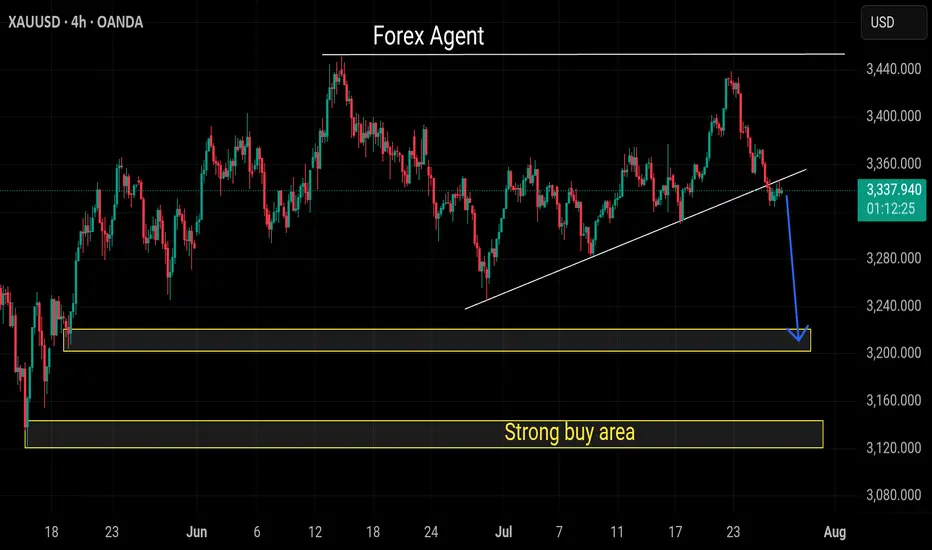
Analysis for the next week (XAUUSD) Hello Traders, Happy Weekend.
The market is going to open tonight, As you see the down trend is running, the price is falling like a waterfall.
Now the market is on the support area according to H1 & H4 TimeFrame.
The market is respecting the support area and there is a Trend line support according to D1 TimeFrame.
The market is respecting the Trend line and support area.
According to my analysis gold will drop till 3287 to 3271.
If gold fly, it can fly till 3350 then it will fall.
Stay tune for update.
Kindly share your views and leave positive comments here, Thanks.
GOLD could test 3375 before falling furtherGOLD could test 3375 before falling further
In our previous analysis, we were looking for gold to fall from the top and, as we can see, it has already reached 3341 from the 3430 area.
From the top down, the price depreciated by 2.85% in less than 3 days, so a possible correction is expected near the area of the structure coming from the left side around 3375.
Given that gold is only moving down, it may be possible for the downward movement to continue slowly. Both scenarios are possible at this point.
You may find more details in the chart!
Thank you and Good Luck!
PS: Please support with a like or comment if you find this analysis useful for your trading day

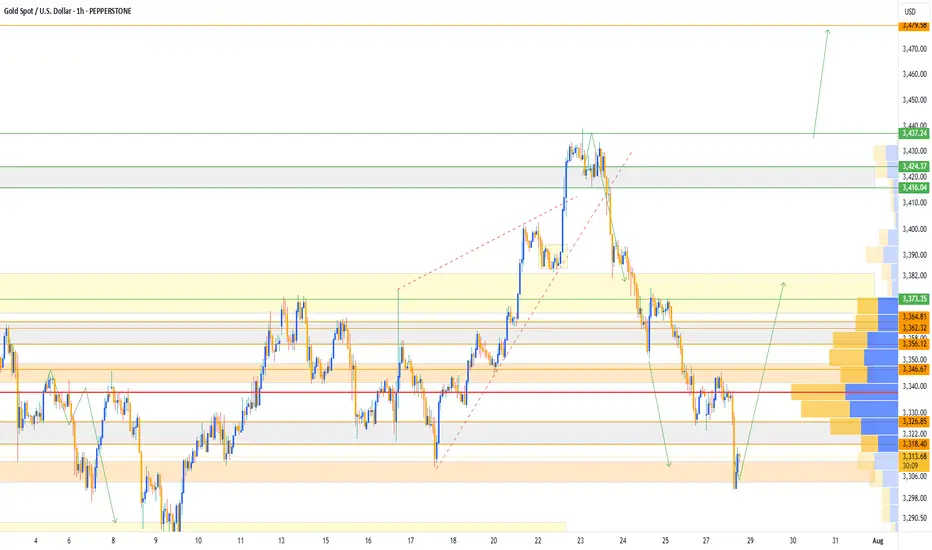
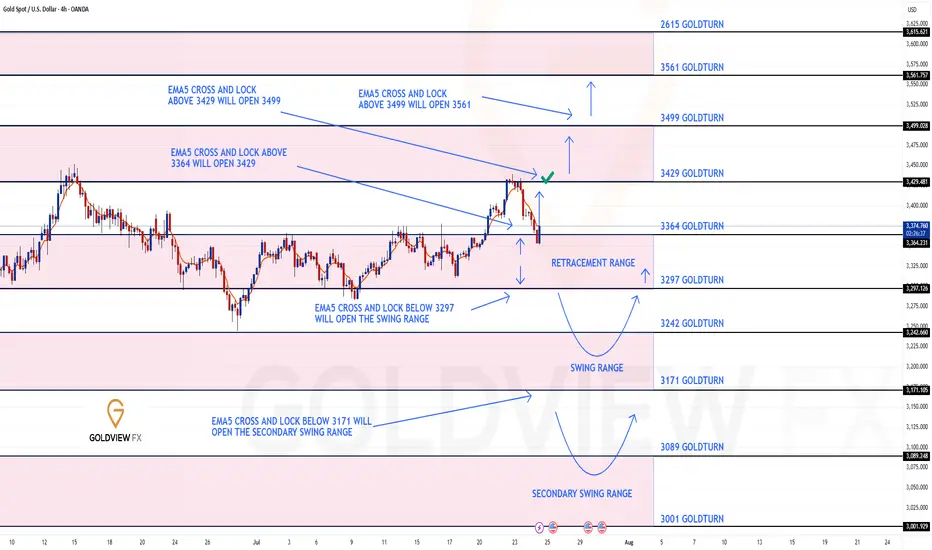
GOLD 4H CHART ROUTE MAP UPDATEHey Everyone,
After completing our 1h chart idea update yesterday, please see our 4chart idea also played out to perfection!!!
We started with our Bullish target hit at 3364 followed with ema5 cross and lock opening 3429. This was also hit perfectly with no further cross and lock above 3429 confirming the perfect rejection.
We are now seeing price play into the retracement zone and will continue to look for reactions on the lower Goldturn, inline with our plans to buy dips.
We will keep the above in mind when taking buys from dips. Our updated levels and weighted levels will allow us to track the movement down and then catch bounces up.
We will continue to buy dips using our support levels taking 20 to 40 pips. As stated before each of our level structures give 20 to 40 pip bounces, which is enough for a nice entry and exit. If you back test the levels we shared every week for the past 24 months, you can see how effectively they were used to trade with or against short/mid term swings and trends.
The swing range give bigger bounces then our weighted levels that's the difference between weighted levels and swing ranges.
BULLISH TARGET
3364 - DONE
EMA5 CROSS AND LOCK ABOVE 3364 WILL OPEN THE FOLLOWING BULLISH TARGETS
3429 - DONE
EMA5 CROSS AND LOCK ABOVE 3429 WILL OPEN THE FOLLOWING BULLISH TARGET
3499
EMA5 CROSS AND LOCK ABOVE 3499 WILL OPEN THE FOLLOWING BULLISH TARGET
3561
BEARISH TARGETS
3297
EMA5 CROSS AND LOCK BELOW 3297 WILL OPEN THE SWING RANGE
3242
3171
EMA5 CROSS AND LOCK BELOW 3171 WILL OPEN THE SECONDARY SWING RANGE
3089
3001
As always, we will keep you all updated with regular updates throughout the week and how we manage the active ideas and setups. Thank you all for your likes, comments and follows, we really appreciate it!
Mr Gold
GoldViewFX

Gold Surges on Non-Farm Data; 3330 Key Next WeekGold was strongly boosted by the significantly bullish non-farm payroll data, surging sharply like a rocket 🚀, with gains that completely "wiped out" all the weekly losses. The current gold trend, as if injected with super momentum, has completely broken the previous long-short stalemate. Starting from the 3300 level, it has been breaking through obstacles all the way up to 3350. At present, 3330 is like a critical "battleground" ⚔️ fiercely contested by both long and short sides.
This week, when gold was still "lingering" below 3300, I emphasized repeatedly that a rebound was inevitable – we just needed to stay calm and wait for the opportunity. As it turns out, our judgment was spot on, and we successfully took profits around 3340, reaping good gains 💴. Now, gold prices are oscillating back and forth in the 3340-3350 range. Based on a comprehensive analysis of the current trend, I boldly predict that gold is likely to pull back to around 3330 next week, so everyone can prepare in advance 🤗
⚡️⚡️⚡️ XAUUSD ⚡️⚡️⚡️
🚀 Sell@ 3350
🚀 TP 3330 - 3320 - 3310
🚀 Buy@ 3300 -3310
🚀 TP 3320 - 3330 - 3340
Daily updates bring you precise trading signals 📊 When you hit a snag in trading, these signals stand as your trustworthy compass 🧭 Don’t hesitate to take a look—sincerely hoping they’ll be a huge help to you 🌟 👇
GOLD trades in narrow range after 4 sessions of sharp declineOn Tuesday (July 29), in the Asian market, the spot OANDA:XAUUSD traded in a narrow range after yesterday's sharp decline, and the current gold price is around 3,315 USD/ounce.
The OANDA:XAUUSD fell to its lowest level in nearly 3 weeks on Monday, mainly due to the trade agreement reached between the United States and the European Union over the weekend, which boosted the Dollar and risk sentiment.
The previous report released by the US Bureau of Labor Statistics showed that the number of US JOLTS jobs unexpectedly increased in May, reaching the highest level since November last year.
The number of JOLTS job vacancies in the US in May was 7.769 million, far exceeding the forecast of all economists surveyed.
Looking back at the data in April, the number of JOLTS job vacancies also showed an unexpected increase.
The JOLTS jobs report is a closely watched labor market data by the Federal Reserve.
In addition, the Conference Board of America's Consumer Confidence Index for July is scheduled to be released on the same day and is expected to be 95.8, compared to the previous value of 93.0.
The fundamental pressure that gold is under
OANDA:XAUUSD came under pressure yesterday and fell to a near three-week low, mainly due to the trade deal between the United States and the European Union (EU) over the weekend, which boosted the Dollar and risk sentiment. Moreover, US President Trump announced “global tariffs” of 15% to 20% on most countries, a change from his previous statement last week.
The deal reached by U.S. President Donald Trump and the European Union late last week will impose a 15% tariff on EU goods, half the rate Trump had threatened, easing fears of a wider trade war.
The U.S. and Japan also reached a deal last week, and U.S. and Chinese officials resumed talks in Stockholm, Sweden, this week with the goal of extending the tariff deadline by 90 days.
Technical Outlook Analysis OANDA:XAUUSD
Gold has been on a four-day losing streak, a decline that threatens bullish expectations as its current position gradually deprives it of any room for further upside.
Specifically, gold has recovered from the psychological level of $3,300 but the actual recovery is not significant, while it is under pressure from the EMA21 which is currently the closest resistance.
On the other hand, gold has fallen below both the long-term and short-term trend channels. If it continues to sell below the 0.382% Fibonacci retracement level, this will confirm a break below the psychological level of $3,300, then the downside target will be around $3,246 in the short term, rather than $3,228.
RSI is pointing down, below 50 and still far from the 20-0 area, also showing that in terms of momentum, gold is also under pressure and there is still a lot of room for decline ahead.
For gold to be eligible for an increase, it needs to at least bring price activity back above the EMA21, back inside the price channels. On the current daily chart, the technical conditions are more inclined towards the possibility of a decrease.
Notable positions will be listed as follows.
Support: 3,310 - 3,300 - 3,292 USD
Resistance: 3,340 - 3,350 - 3,371 USD
SELL XAUUSD PRICE 3355 - 3353⚡️
↠↠ Stop Loss 3359
→Take Profit 1 3347
↨
→Take Profit 2 3341
BUY XAUUSD PRICE 3285 - 3287⚡️
↠↠ Stop Loss 3281
→Take Profit 1 3293
↨
→Take Profit 2 3299
