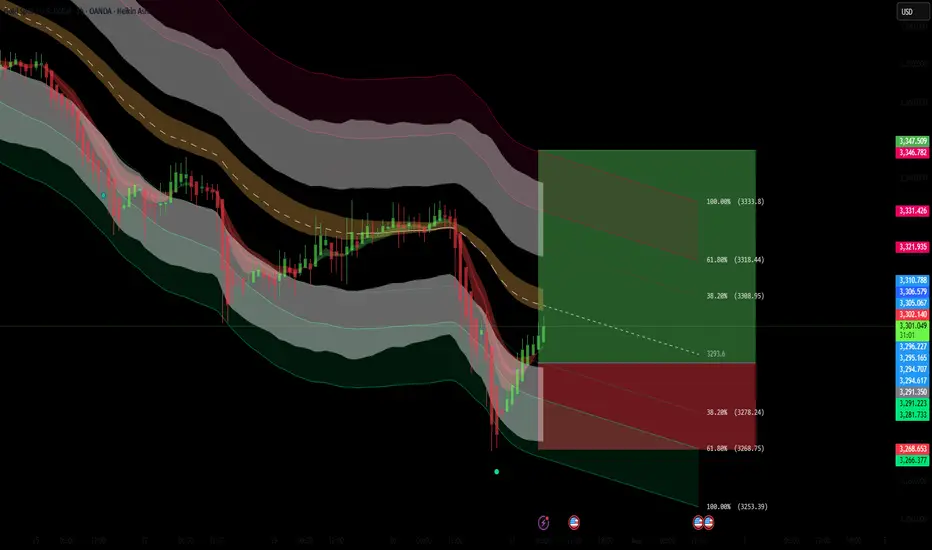
XAUUSD Long Setup – 1HGold (XAUUSD) has shown strong bullish rejection from the lower volatility band after a sharp selloff. The appearance of a Heikin Ashi reversal candle, suggests a short-term reversal is forming. Price has reclaimed key structure and is now targeting a reversion back to the mean, supported by Fibonacci retracement levels.
Entry: 3293.55
Target Zone: 3308.91 → 3333.76 (Fib 38.2% – 100%)
Stop Loss: 3253.35
Confluences:
✅ Bullish engulfing + Heikin Ashi trend shift
✅ Oversold bounce from lower channel extremity
✅ Fib retracement aligns with key structural resistance zones
✅ Custom signal confirmation (green dot)
✅ Clean R:R toward upper band and previous POI
Short-term counter-trend long targeting liquidity grab and mean reversion toward the 3308–3333 zone. Risk tightly managed with SL below local swing low.
GOLDCFD trade ideas
I maintain my #3,277.80 and #3,252.80 TargetsI didn't engaged any re-Sell orders throughout yesterday's session and re-Sold Gold on #3,295.80 ahead of Asian session, with plan to keep orders over-night. However due NFP, Gold might be stationary / ranging until the news as I closed both of my orders on #3,291.80 / each #9.000 Eur Profit and my #3,300.80 pending Sell limit has been triggered over-night which is now running in Profits with Stop on breakeven. I do expect #3,277.80 and #3,252.80 Targets to be met within #1 - #3 sessions and if there aren't NFP numbers, I would keep all three orders / set of Selling orders maintaining my first #3,277.80 Target. Due the news, Gold might fluctuate within Neutral Rectangle until the news.
Technical analysis: My earlier Selling configuration / Technical expectations was confirmed on Hourly 4 chart under prolonged weakness and Price-action respecting the trend-line guarding the downtrend (very Bearish formation) as Hourly 1 chart is already an aggressive Descending Channel (width opened on Williams) that should reach it’s next local Low’s (currently Trading slightly below Double Bottom) and Oversold state near my take Profit of #3,252.80 benchmark. If the bands are widened Traders may witness #3,277.80 test, also if gets invalidated and #3,270.80 gives away, #3,252.80 mark extension test is inevitable. In any case I will update my Targets or levels of Profit taking if I decide to exit earlier than #3,252.80 benchmark to be in accordance with the Daily chart’s period / I already ride Selling wave since #,3,300's and my Profit will be already good to ignore.
My position: DX is soaring, Gold is under Bearish Technical developments and #3,252.80 benchmark is my final Target of current Selling leg. Only factor which can reverse this Intra-day but not postpone is NFP. I expect downside Jobs surprise which may reverse DX from local High's however hot upside surprise will make Gold test #3,252.80 Intra-day. NFP or not I do believe Gold is Bearish. Trade accordingly.
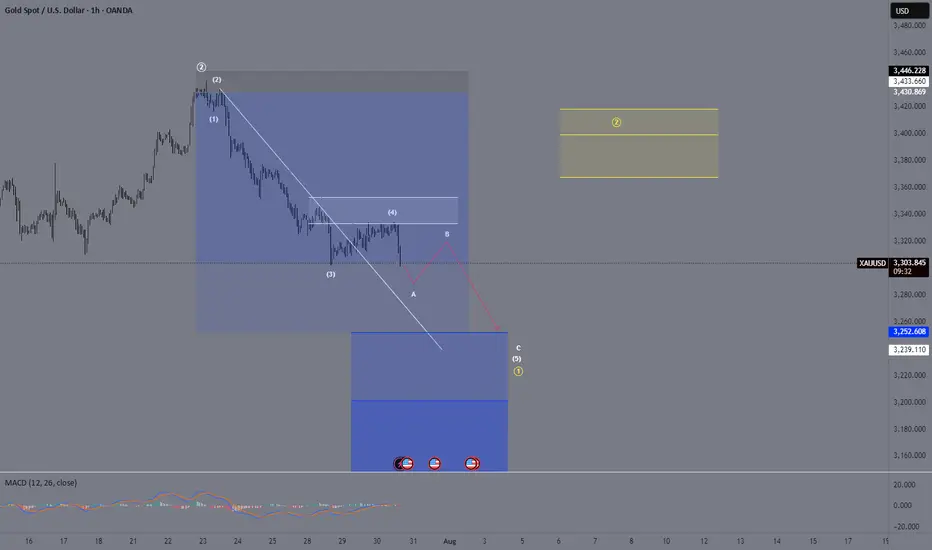
XAU/USD – Endphase der Circle Wave 1 & Vorbereitung auf die KorrOANDA:XAUUSD
We are currently in the final stages of the yellow (Circle) Wave 1 on Gold.
We have just completed wave 4.
How do I identify wave 4? Simple:
📏 I drew a trendline, and once that trendline was broken, the trend of wave 3 was considered complete.
However, we’ve now made a new low, which broke the low of wave 3 — this could very well be our wave A of wave 4 ⚠️.
I’m expecting one more final low, potentially around 3252, or even as low as 3200.
But personally, I lean towards ~3252 as the likely target 🎯.
After that, we should see a move upward into the yellow Fibonacci zone of wave 2 🟡.
The path from Circle 1 to Circle 2 will likely unfold as a corrective A-B-C structure to the upside 🔁.
Following that, we hopefully get a clean five-wave impulse into our (Circle) Wave 3 🚀.
Gold long from 3295I think this might be the bottom .
Next week gold will be sitting at 3400$ level.
Short idea!Hello all. the last falling leg is about to start. lets see the reaction of the market on the Broken retrace zone. be happy.
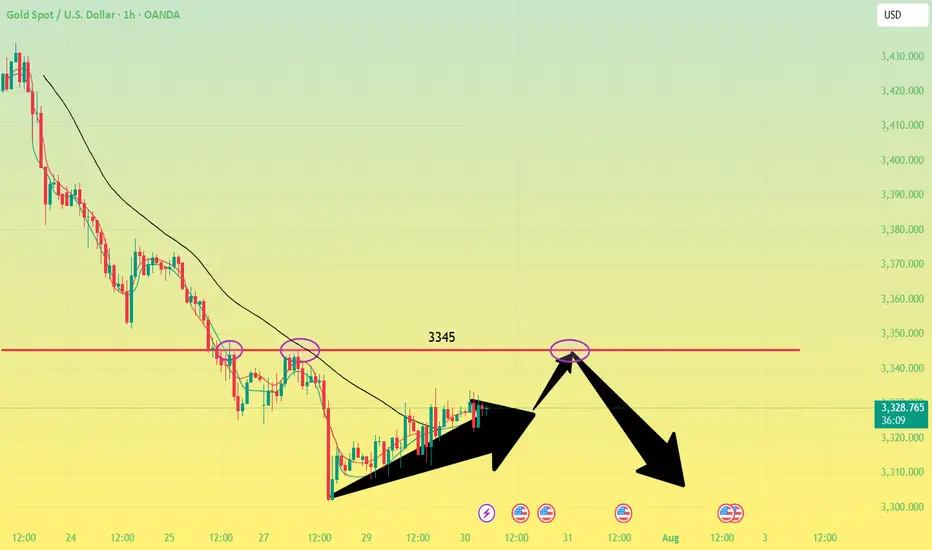
GOLD for todayHello to all traders. 😎😎
I hope all your deals will hit their targets. 🎉🎉
Based on yesterday’s analysis (link in the caption), we can expect gold to make a small upward move towards the 3335–3345 zone to collect sell orders in that area, and then potentially drop with more strength.
As you can see on the chart, the previous bearish move was strong, while the recent bullish move from yesterday until now has been slow and weak.
🌟🌟 The main reason for expecting this drop is the break of a key trendline on the 4H timeframe.
I’ve marked the entry point and stop-loss in red, and the targets in blue on the chart.
📌 Don’t forget to apply proper risk management!
⚠ Important: If a 1H candle closes above 3350 without giving us a valid entry beforehand, this analysis will be considered invalid.
What Do You Think?
Which scenario do you think is more likely to happen? **Share your thoughts!** ⬇️
Don't forget that this is just an analysis to give you an idea and trade with your own strategy. And don't forget the stop loss🛑🛑🛑
❤️❤️❤️The only friend you have in financial markets is your stop loss❤️❤️❤️
Please support me with your ✅' like'✅ and comments to motivate me to share more analysis with you and share your opinion about the possible trend of this chart with me 🙏😊
Be Happy , Ali Jamali

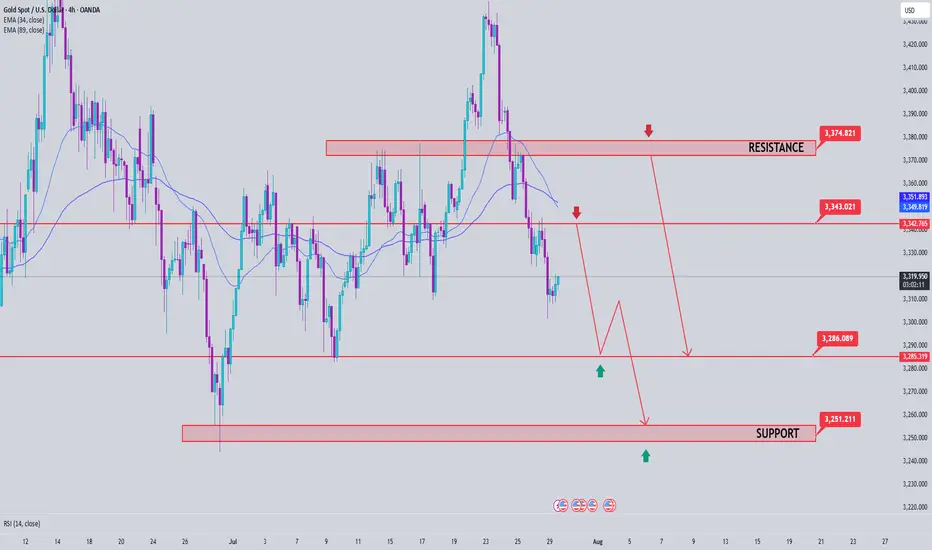
Gold - Sell around 3345, target 3320-3301Gold Market Analysis:
Gold has been in a correction over the past two days, with repeated ups and downs, generally trending towards a low and then a rebound. Yesterday, we insisted on selling at 3320, 3326, and 3328, but the profits weren't significant. The daily chart doesn't clearly indicate stabilization or a reversal of trend. Looking at the longer-term trend, I still insist on buying if 3345 breaks. If it doesn't break, we can hold on to the bearish trend. We previously mentioned that 3300 is support on the daily and weekly charts. A technical rebound and correction after selling below this level is inevitable and a normal technical correction. Furthermore, starting Wednesday, big data will be released one by one, and the market is waiting for the data to guide its direction. The weekly chart is also confused and directionless. We're just small investors; we need to follow, not speculate. The 5-day moving average on the daily chart has dipped below 3335, a level that has been retested multiple times in the Asian session. The current correction range is 3300-3335, with resistance around 3345-3343. The daily chart closed positive again, suggesting that the support below may be difficult to break in the short-term Asian session, and a significant decline is unlikely. We anticipate continued correction pending the ADP results.
Support is 3311 and 3301, resistance is 3345, with minor resistance at 3335. The dividing line between strength and weakness is 3335.
Fundamental Analysis:
Today, focus on the ADP employment data and the EIA crude oil inventory data. The US interest rate results are the highlight, along with the speech.
Trading Recommendation:
Gold - Sell around 3345, target 3320-3301
Gold non-farm payrolls are bullish, long and short positions ana
Rather than envying the fish by the river, it's better to retreat and weave your net. We often envy the wealth others can earn by investing in the gold market. We often watch them enthusiastically investing, but we ourselves are afraid to enter the market. The two major factors that drive the market, technology and news, are a topic of constant debate among investors. To navigate the market, one must master the art of attack and defense to remain rock-solid while remaining at the forefront. As the saying goes, trust me, and I will reward you with profits!
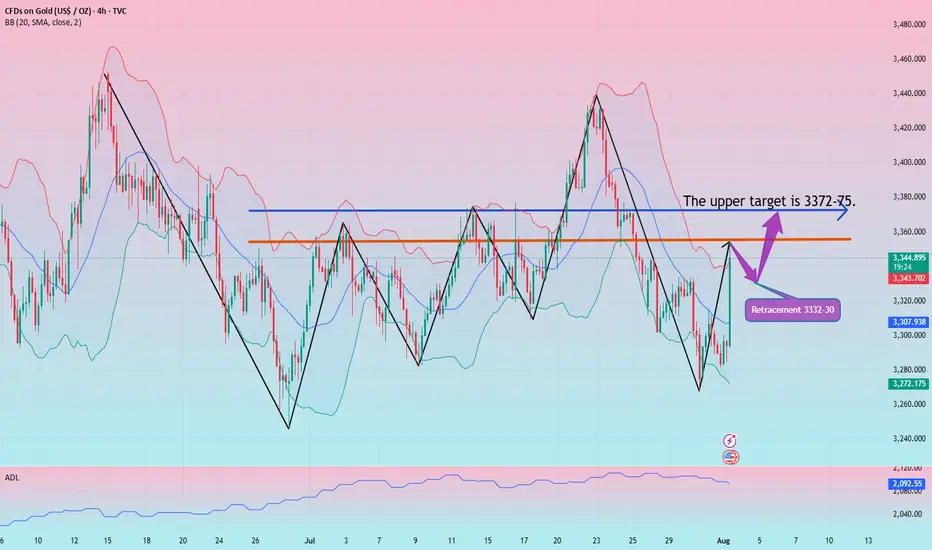
Gold Data is Bullish!
The positive non-farm payroll data sent gold soaring, with gains completely erasing all of the week's losses. Currently, gold's trend has reversed the stagnant bullish and bearish trend. After breaking through the 3300 mark and rising all the way to 3348, it shows no signs of stopping. A further test of the 3370 level is not out of the question!
Due to the strong bullish data, if you don't immediately chase longs or place a breakout long order during the first wave, you'll likely have little chance of a pullback. Therefore, you should remain aggressive in your trading strategies. We recommend a pullback to the 3332-30 level to continue the bullish trend. Upward pressure is expected at 3372-75! The market fluctuates violently, and more real-time entry and exit points are mainly based on Yulia's real-time guidance!
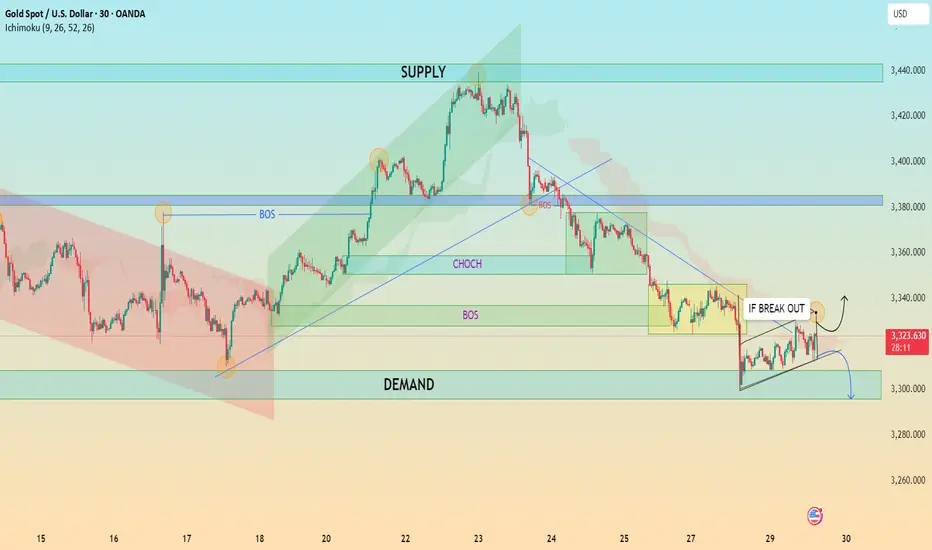
XAU/USD Analysis – Critical Breakout Zone Approaching 30M Chart📈 XAU/USD Analysis – Critical Breakout Zone Approaching (30-Minute Chart)
🔍 Technical Overview:
Chart Type: 30-minutes
Indicators: Ichimoku Cloud
Key Structures: Supply & Demand Zones, CHoCH, BOS, Trendlines, Triangle Formation
🔑 Key Market Observations:
🟢 Demand Zone (Support) ~ $3,300 – $3,310
This area has been tested multiple times and has shown strength in absorbing selling pressure.
A bullish triangle formation is converging into this zone, suggesting a potential breakout point is near.
🔴 Supply Zone (Resistance) ~ $3,375 – $3,390
Repeated price rejection from this zone marks it as a strong institutional-level resistance.
Price needs a clean breakout and volume confirmation to push through this level.
📉 Break of Structure (BOS) & Change of Character (CHoCH):
BOS and CHoCH levels are clearly marked, showing a trend shift from bullish to bearish (post-supply test).
The last CHoCH aligns with a lower high, reinforcing bearish dominance unless invalidated.
📐 Symmetrical Triangle Formation:
Price is squeezing between higher lows and lower highs, coiling before a significant breakout.
Two scenarios are outlined:
Bullish Breakout: Clear move above triangle resistance → test of supply.
Bearish Breakout: Breakdown → revisit demand zone or even drop toward $3,280–$3,270.
☁️ Ichimoku Cloud:
Price is currently testing the lower boundary of the Ichimoku cloud.
A bullish breakout into/above the cloud may act as confirmation of a reversal attempt.
💡 Potential Trade Setups:
✅ Bullish Case:
Trigger: Break and close above $3,335 with volume.
Target 1: $3,375 (Supply Zone)
Target 2: $3,440 (Extended Target)
Invalidation: Rejection from triangle top and close below $3,310.
❌ Bearish Case:
Trigger: Break and close below $3,310 (triangle breakdown).
Target 1: $3,280
Target 2: $3,260
Invalidation: Bullish breakout of triangle and flip of previous CHoCH level.
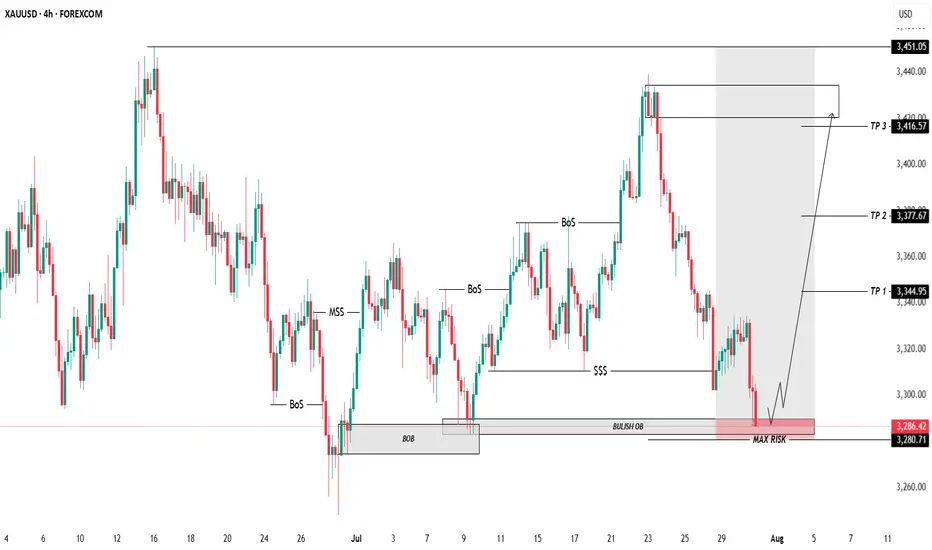
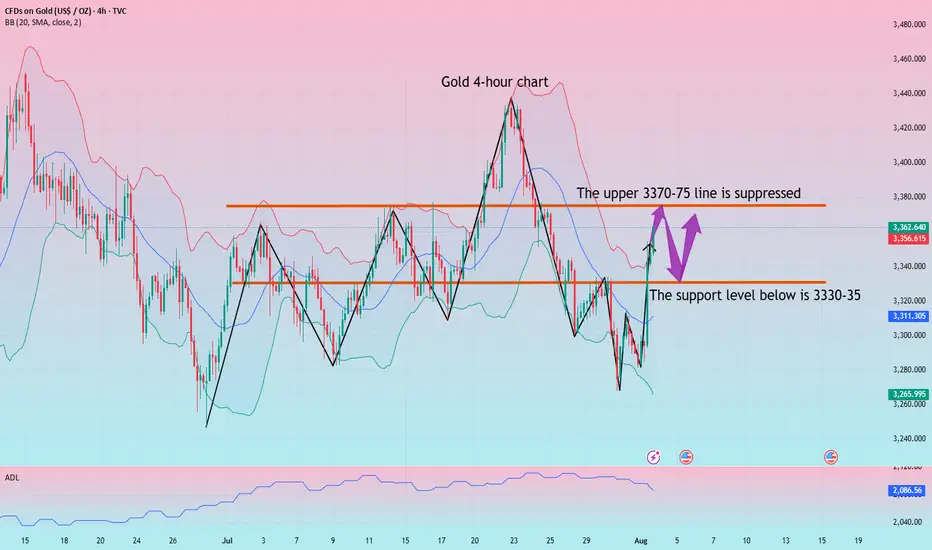
Gold is locked and loaded! A 4H breakout this week could unleashGold Analysis & Trading Plan – First Week of August
Overall Outlook:
Gold is currently consolidating between key levels. A breakout above resistance or a breakdown below support will determine the next move.
⸻
Bullish Scenario (LONG Setup)
• Condition: 4H candle closes above 3364
• Targets:
• First target: 3373
• Second target: 3382
• If 4H closes above 3382, extended targets will be:
• 3392
• 3400
• 3422
⸻
Bearish Scenario (SHORT Setup)
• Condition: 4H candle closes below 3353
• Targets:
• 3333
• 3329
• If 4H closes below 3329, extended targets will be:
• 3319
• 3313
• 3308
⸻
Key Notes
• Focus on intraday trading between these weekly levels as long as price remains within the range.
• Always apply strict risk management.

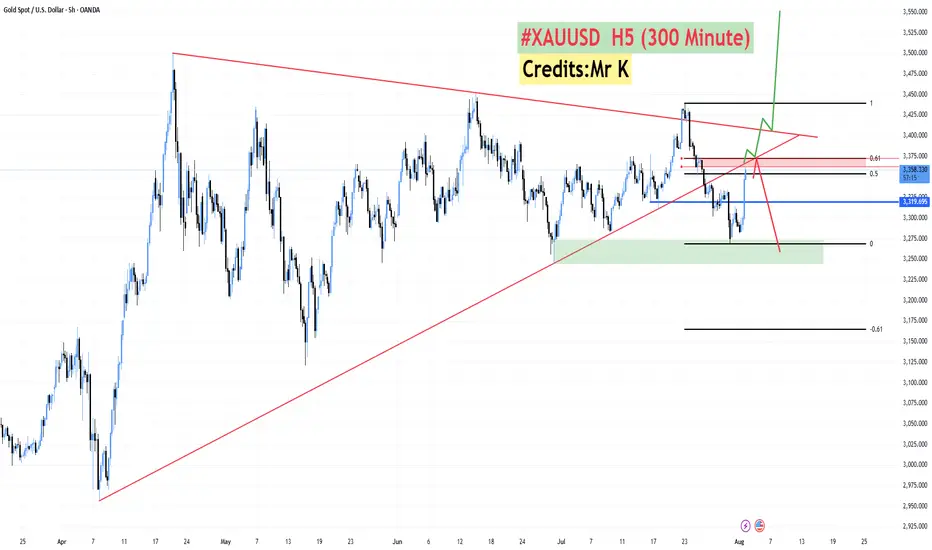
**#XAUUSD H5 Higher Timeframe Analysis**
📊 **#XAUUSD H5 Higher Timeframe Analysis**
What we witnessed today was a **tremendous recovery in Gold 🟡** after **3–4 consecutive bearish sessions 📉**.
📅 **Today’s candle** has **completely flipped the weekly structure**, turning a fully **bearish weekly candle into a bullish one 📈** — thanks to the **NFP data** that came in **favor of Gold and against the Dollar 💵❌**.
🔍 However, price is now approaching a **critical confluence zone**:
* 🧭 A **long-running trendline** (since April)
* 🔴 An **H4 Bearish Order Block**
* 📐 The **Fibonacci Golden Zone (0.50–0.618)** at **3362–3372**
📌 **From this level, we have two possible scenarios:**
1️⃣ **Sharp Rejection 🔻:**
Price may **reverse sharply** from the 3362–3372 zone and **resume the bearish trend**.
2️⃣ **Breakout & Trap Theory 🔺:**
If price **sustains above this zone**, it may signal that the recent **3–4 day drop was a fake breakdown**, designed to **trap sellers** and grab liquidity for a **further upside move**.
✅ **Confirmation will come if we get an H4–H6 bullish candle close above the trendline** and back inside the **buying zone of 3375–3390**.
🔓 **A breakout above the triangle pattern** will likely lead to a **strong bullish continuation 📈🚀**.
BUY XAUUSD ....GOLDBUY XAUUSD price gas reached a potential strong bullish orderblock and a well structured demand zone
use proper risk management
XAUUSD: Buy idea On XAUUSD we would have a high probability of having an uptrend depending on the configuration of the chart.

Gold Price Analysis July 29📉 XAUUSD ANALYSIS – IS THE CORRECTION OFFICIALLY STARTING?
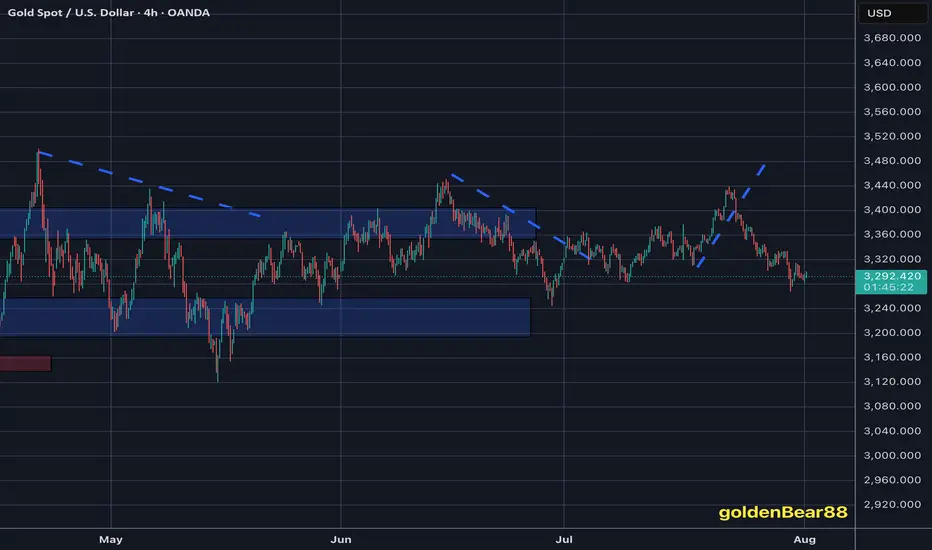
Gold has officially broken out of the bullish wave structure and left the rising price channel – an important technical signal that the bearish correction trend has been activated. This development opens up the possibility of retests of the broken trendline, and if that happens in today's session, this could be a good opportunity to look for SELL entry points in the new trend.
📌 Short-term trading strategy:
Potential selling zone: 3343 – 3345
Downside target: 3283 first, followed by the strong liquidity zone around 3250
Confirmation of bearish force: Price continues to maintain below the 3375 area – which will act as an important resistance level. Only when the daily candle closes back above this zone will the uptrend be re-established.
✅ Reverse buying strategy if there is a strong support signal:
Buy trigger zone: Observe the price reaction around the 3285 area - there needs to be a clear bearish rejection signal (pin bar/bullish engulfing candle...)
Deeper buying zone: 3251 - where liquidity is concentrated and there is a possibility of bottom-fishing demand appearing.
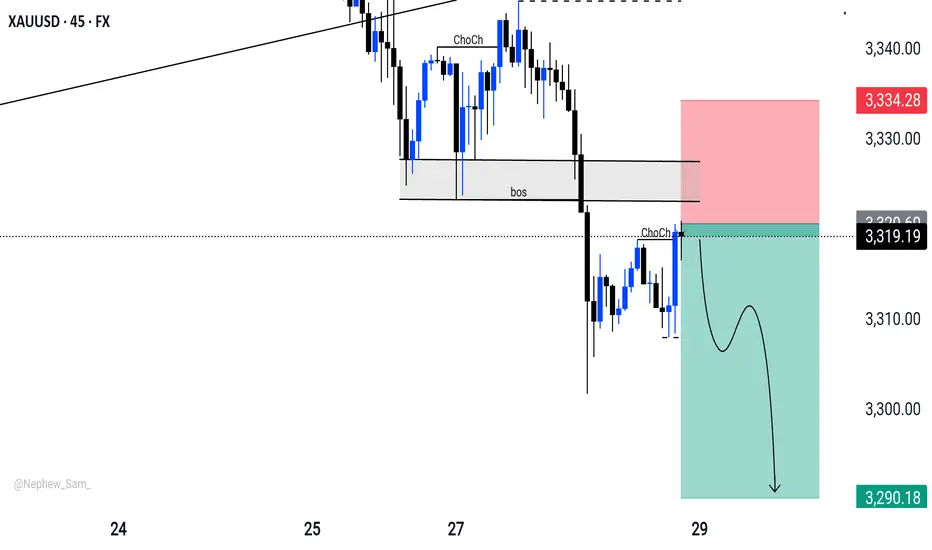
XAUUSD/GOLD 45M OUTLOOK 📉 XAUUSD Breakdown Play
Caught the Change of Character (ChoCh) and confirmed the Break of Structure (BoS) at premium supply.
Price tapped into the zone, printed another ChoCh – now targeting the next liquidity sweep.
🧠 Smart Money never chases – it positions.
📍Sell: 3320 | SL: 3334 | TP: 3290
Risk:Reward = 💰
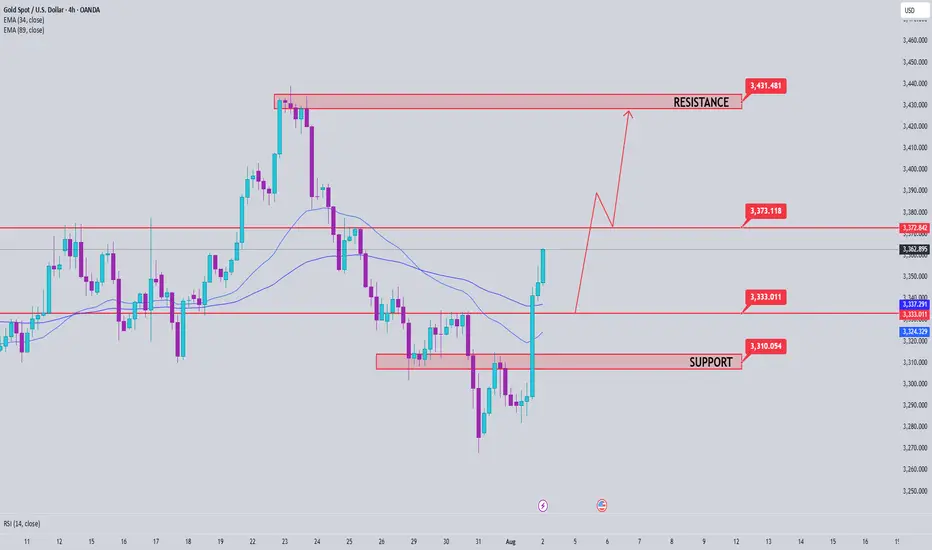
Gold price analysis week 32The recently released Nonfarm data has become an important catalyst, officially breaking the previous bearish wave structure and shaping a completely new uptrend for gold prices. Breaking above the wave 1 peak at the 3315 area is a clear confirmation signal that the downtrend has ended.
In that context, the trading strategy for next week should prioritize buying orders. This rally has the potential to push gold prices to historical peaks if the bullish momentum is maintained with stable trading volume.
Specific trading strategy:
Important support zone: 3333 – 3315
Short-term resistance zone: 3373 – 3416
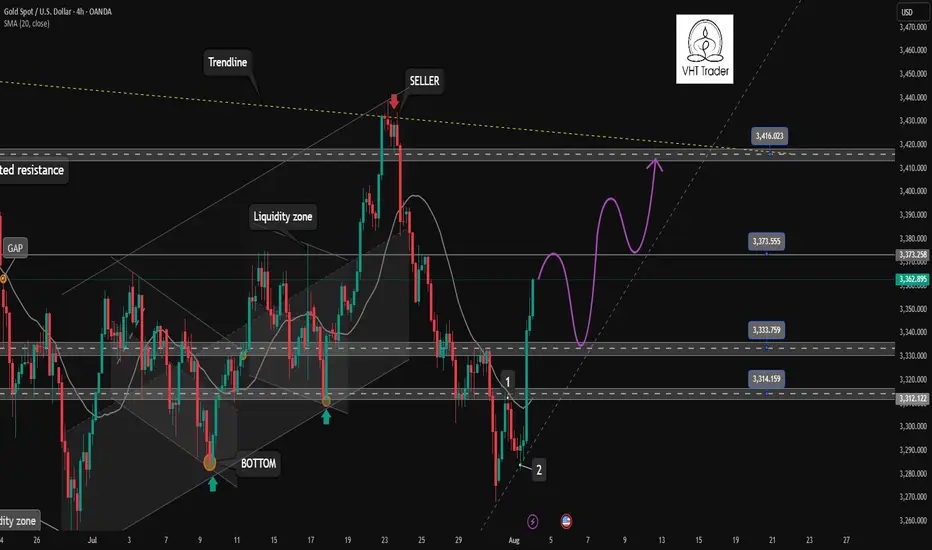
Gold establishes bullish wave. Wait for recovery point to BUY✏️ OANDA:XAUUSD Nonfarm announcement has shaped a new trend for gold price. completely broke the previous bearish wave structures and formed a new bullish trend with the break of wave 1 peak around 3315. Trading strategy next week only focuses on BUY signals. Maybe this bullish wave can make gold reach the all-time high.
📉 Key Levels
Support 3333-3315
Resistance 3373-3416
BUY zone: 3333 ; 3315 ( Strong support zone)
BUY DCA trigger Break resistance 3373
Target 3416
Leave your comments on the idea. I am happy to read your views.
Gold long: Completion of Cycle degree Wave 4Hello, in this video, I go through Gold Elliott Wave structure on a cycle level (again) before zooming in on the latest 5-waves structure that is Cycle level wave 4. I talk about using existing broken trendlines and how that allows me to determine the strength of a move when there are false breakouts, whether to the upside or the downside.
Lastly, I discuss on how to trade this on the short-term using lower timeframe and price action. Most importantly, where to set the stop and the rationale for it.
Good luck!

Gold Intraday Trading Plan 8/1/2025Although yesterday's retracement is a bit too deep, I am still bearish in gold in medium term as long as 3333 resistance is not broken. Therefore, I will still look for selling opportunities today.
Currently daily is in green bar while smaller timeframe shows bearish signs. If there is a double top formed near 3300, I will sell toward my weekly target at 3255.
Analysis of gold market operation strategies and ideas next week
Gold rallied unilaterally on Friday following positive non-farm payroll data, reaching a new high for the week. This week's candlestick formed a hammer pattern, suggesting further upside potential next week. Bulls continued their push late Friday, closing at 3363. Next week, we will continue to monitor short-term resistance around 3370-3375. We will continue to buy on pullbacks. If your current trading is not satisfactory, I hope I can help you avoid investment setbacks. Welcome to discuss your options!
Based on a 4-hour analysis, short-term resistance will be seen around 3370-3375 next week, with a key resistance around 3395-3400. We will continue to buy on pullbacks. In the intermediate range, we recommend maintaining a cautious wait-and-see approach. I will provide detailed trading strategies during the trading session, so please stay tuned.
Gold Trading Strategy:
Go long on gold pullbacks to 3330-335, with a stop-loss at 3318 and a target at 3370-3375. Hold on if it breaks above this level.
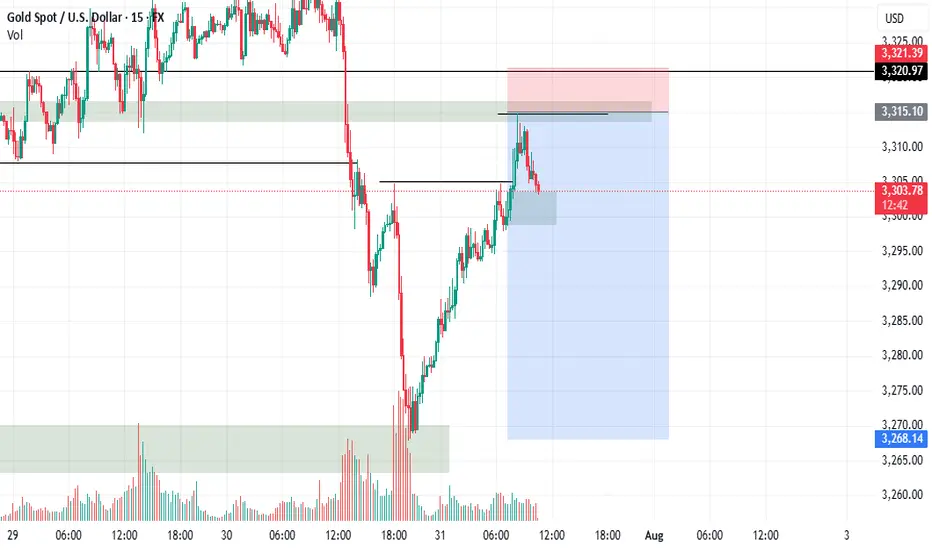
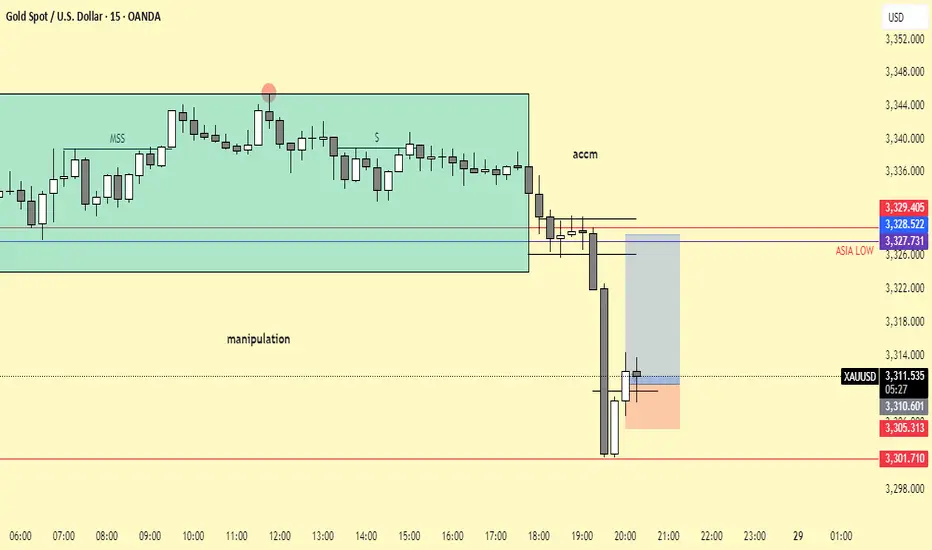
Gold Trend Reversal: MSS Completed Eyes on OB and Breaker Block!The gold market has executed a Market Structure Shift (MSS) in the New York session, indicating a trend reversal. Initially, the market made a Break of Structure (BoS) to the upside, but later dropped sharply and closed below the MSS level, confirming a bearish shift. Currently, the market is likely entering a retracement phase and may look to fill its Pending Demand (PD) arrays.
There are two critical levels from which the market could potentially drop again:
1. The first is an Order Block (OB).
2. The second is a Breaker Block (BB).
Keep a close watch on these two levels. If the market returns to either and presents bearish confirmation signals, it could resume the downward move towards swing lows.
Do Your Own Research (DYOR).

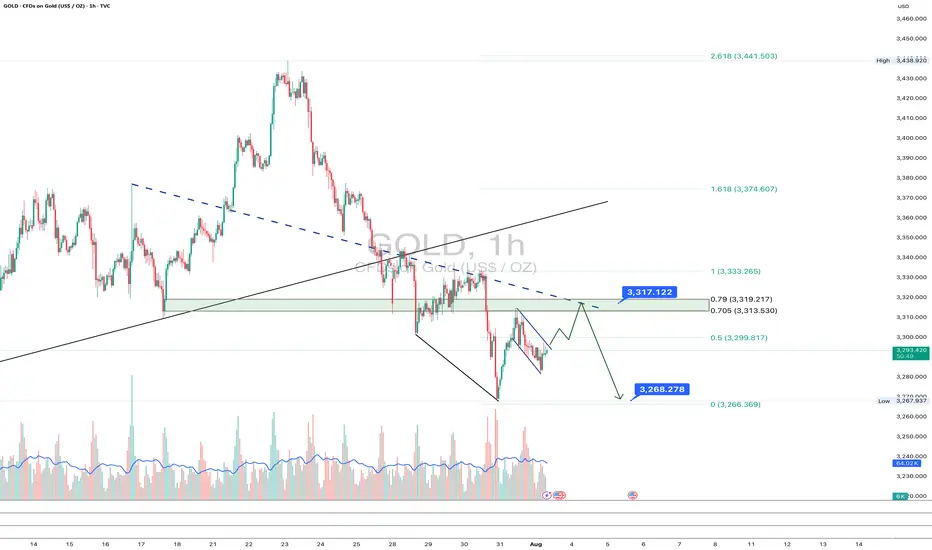
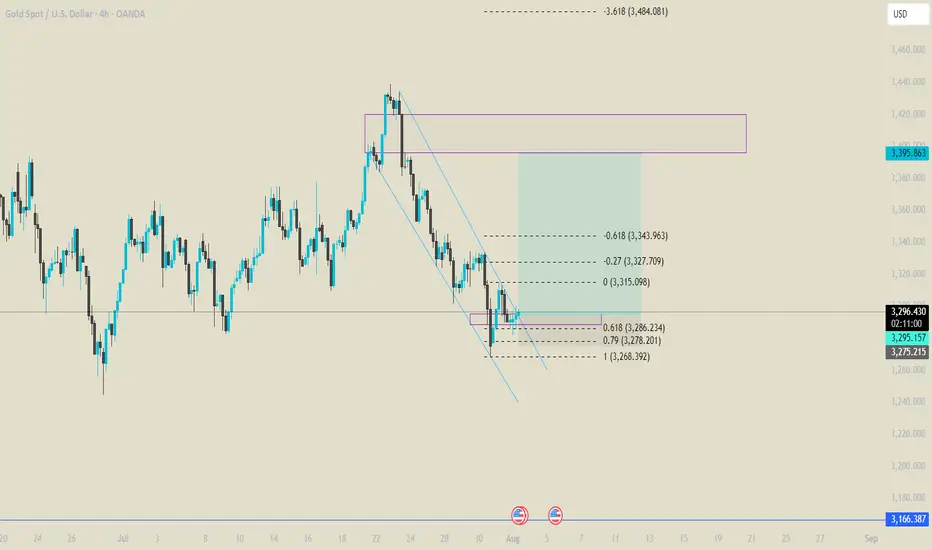
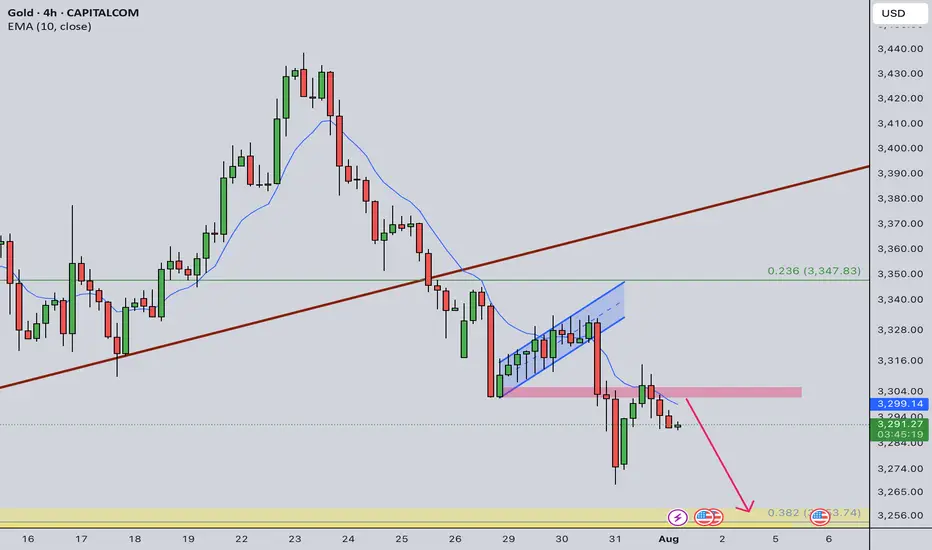
Gold: final pullback or bull trap?On the 1H chart, gold (GOLD) is forming a bullish flag after a sharp decline, which may just be a corrective move within a broader downtrend. The price is now approaching the key resistance zone around $3313–$3317 - this area holds the POC, broken trendline, and the 0.705–0.79 Fibonacci retracement from the last drop. This is the decision-making zone.
If bulls fail to push above it, we expect a move down toward $3268 - the next strong support and potential buy zone, also confirmed by Fibonacci and local demand. Stochastic divergence and slowing volume suggest a possible rebound from that level. However, if the price breaks and holds above $3317, this would indicate a local trend reversal, with targets at $3333 and $3374.
Watch the $3317 zone closely - bulls have yet to prove this is more than just a bounce.