Gold Price Rally: Why Hedge Funds Are Making Their Biggest Bet Glimmer of Gold: Why Hedge Funds Are Making Their Biggest Bullish Bet in Months
In the complex and often turbulent theater of global finance, the movements of so-called "smart money" are watched with an eagle's eye. When these sophisticated players, particularly hedge funds, move in concert, it often signals a fundamental shift in market sentiment. Recently, a powerful signal has emerged from the depths of the commodities market: hedge funds have dramatically increased their bullish bets on gold, pushing their net long positions to a 16-week high. This aggressive positioning is not a random fluctuation; it is a calculated response to a potent cocktail of persistent geopolitical instability, simmering trade tensions, and a growing conviction that the global economic landscape is tilting in favor of the ultimate safe-haven asset.
The surge in bullish sentiment represents a significant vote of confidence in the yellow metal. It suggests that some of the world's most well-resourced and analytically driven investors are looking past the daily noise of equity markets and are instead positioning themselves for a future where security, stability, and tangible value take precedence. They are not merely dipping their toes in the water; they are making a decisive, leveraged bet that the forces buffeting the global economy will continue to drive capital towards gold's enduring allure. This move has sent ripples across the financial world, prompting investors of all stripes to ask a critical question: What does the smart money see that we should be paying attention to?
Decoding the Data: A Sharp Turn Towards Bullishness
To understand the magnitude of this shift, one must look to the weekly Commitments of Traders (COT) report published by the U.S. Commodity Futures Trading Commission (CFTC). This report provides a detailed breakdown of positions in the futures markets, separating traders into different categories, including "Managed Money." This category, which primarily consists of hedge funds and commodity trading advisors, is a key barometer for speculative sentiment.
The latest data reveals a sharp and decisive increase in bullish conviction. Hedge funds significantly ramped up their gross long positions—outright bets that the price of gold will rise. Simultaneously, they have been closing out their short positions—bets that the price will fall. The combination of these two actions has a powerful magnifying effect on the "net long" position, which is the difference between the number of long and short contracts.
Reaching a 16-week high is particularly noteworthy. It indicates a reversal of previous caution or bearishness and the establishment of a new, more aggressive bullish trend. For months, hedge funds may have been hesitant, weighing the prospects of higher-for-longer interest rates against emerging geopolitical risks. The current data shows that the scales have tipped decisively. This isn't a gradual accumulation; it's a forceful pivot, suggesting a high degree of conviction in the upside potential for gold. This influx of speculative capital acts as a powerful tailwind for the gold price, creating upward pressure as more funds chase the emerging momentum.
The Three Pillars of the Golden Thesis
The coordinated move by hedge funds is not based on a single factor but on a confluence of three powerful, interlocking macro-economic and geopolitical narratives. Each pillar reinforces the others, creating a compelling case for holding gold.
1. The Unsettled World: Geopolitical Risk as a Prime Catalyst
Gold has, for millennia, served as the ultimate barometer of fear. In times of peace and prosperity, its appeal can wane in favor of assets that offer growth and yield. But in an environment of escalating geopolitical tension, its value proposition becomes unparalleled. The current global landscape is rife with such tensions.
Persistent conflicts in key regions continue to create uncertainty, threatening to disrupt energy supplies, shipping lanes, and international relations. The risk of these conflicts widening or drawing in other powers keeps a floor under the demand for haven assets. Beyond active conflicts, the world is witnessing a broader realignment of global power. The rise of multi-polarity and the challenging of the post-Cold War order create a backdrop of systemic instability.
Furthermore, political uncertainty within major economies adds another layer of risk. Election cycles in dominant nations can lead to unpredictable policy shifts on everything from trade and taxation to international alliances. This policy uncertainty makes investors nervous, prompting them to allocate capital to assets that are insulated from the whims of any single government or political outcome. Gold, being a stateless monetary asset with no counterparty risk, is the natural recipient of these capital flows. Hedge funds are betting that these geopolitical undercurrents will not only persist but potentially intensify, making gold an essential portfolio hedge.
2. The Friction of Trade: A Drag on Global Growth
The era of seamless globalization has given way to a period of strategic competition and trade friction. The ongoing trade disputes between the world's largest economic blocs, most notably the United States and China, have moved beyond mere rhetoric and are now an entrenched feature of the global economy. Tariffs, export controls, and national security-driven industrial policies are disrupting long-established supply chains and creating a more fragmented and less efficient global marketplace.
This environment is a significant headwind for global economic growth. The uncertainty surrounding trade policy makes it difficult for businesses to make long-term investment decisions, dampening corporate spending and hiring. Slower global trade directly translates to slower economic growth, which in turn puts pressure on corporate earnings and equity valuations.
In this context, gold shines. As an asset that does not rely on economic growth to generate returns, it acts as a valuable diversifier in a portfolio dominated by stocks and bonds. When growth falters, gold's role as a store of value becomes more pronounced. Hedge funds are positioning for a scenario where persistent trade tensions continue to weigh on the global economy, making riskier assets less attractive and defensive assets like gold more appealing.
3. The Central Bank Pivot: Anticipating Looser Money
Perhaps the most powerful financial driver for gold is the outlook for monetary policy, particularly from the U.S. Federal Reserve. The price of gold has an inverse relationship with real interest rates (interest rates minus inflation). When real rates are high, the opportunity cost of holding a non-yielding asset like gold is also high, as investors can earn a handsome, risk-free return in government bonds. Conversely, when real rates are low or falling, the opportunity cost of holding gold diminishes, making it a more attractive investment.
For the past couple of years, central banks have been in a fierce battle against inflation, raising interest rates at an aggressive pace. However, the market is now increasingly looking ahead to the next phase of the cycle: rate cuts. While the timing is still a matter of debate, the consensus is that the next major policy move from the Fed and other major central banks will be to lower rates to support a slowing economy.
Hedge funds are front-running this anticipated pivot. They are accumulating gold now in expectation that falling interest rates in the future will provide a significant tailwind for its price. Even before the cuts materialize, the mere expectation of looser monetary policy is enough to fuel a rally. Furthermore, there is a persistent fear that central banks might make a policy error—either by keeping rates too high for too long and triggering a deep recession, or by cutting rates too soon and allowing inflation to become re-anchored. Either scenario is bullish for gold, which performs well during both economic downturns and periods of high inflation.
This speculative demand from hedge funds is layered on top of a powerful, long-term structural trend: voracious buying from the world's central banks. For several years, central banks, particularly those in emerging markets like China, India, and Turkey, have been steadily diversifying their foreign reserves away from the U.S. dollar and into physical gold. This "de-dollarization" trend is a strategic move to reduce dependence on the U.S. financial system and to hold a neutral reserve asset in an increasingly fractured world. This consistent, price-insensitive buying from official institutions creates a strong and stable floor of demand for gold, providing hedge funds with the confidence to build their own large, speculative positions on top of it.
Conclusion: A Resounding Vote for a Golden Future
The sharp increase in bullish gold bets by hedge funds is more than just a statistic; it is a story about risk, fear, and the search for security in an uncertain world. It reflects a growing consensus among sophisticated investors that the confluence of geopolitical turmoil, economic friction, and an impending shift in monetary policy has created a uniquely favorable environment for the precious metal.
These funds are acting as canaries in the coal mine, signaling a potential increase in market volatility and a flight to safety. Their aggressive positioning, backed by billions of dollars in capital, can become a self-fulfilling prophecy, driving prices higher and drawing in more waves of investors. As the world continues to grapple with deep-seated structural changes, the decision by the "smart money" to make its largest bullish wager on gold in months is a clear and resounding signal: in the quest for a safe harbor, all that glitters is, once again, gold.
GOLDCFD trade ideas

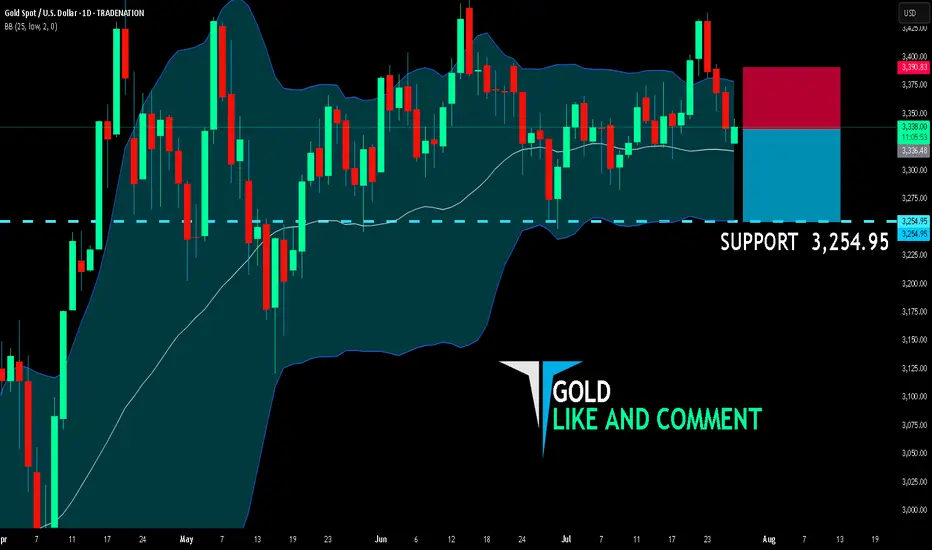
GOLD SENDS CLEAR BEARISH SIGNALS|SHORT
GOLD SIGNAL
Trade Direction: short
Entry Level: 3,336.48
Target Level: 3,254.95
Stop Loss: 3,390.83
RISK PROFILE
Risk level: medium
Suggested risk: 1%
Timeframe: 1D
Disclosure: I am part of Trade Nation's Influencer program and receive a monthly fee for using their TradingView charts in my analysis.
✅LIKE AND COMMENT MY IDEAS✅
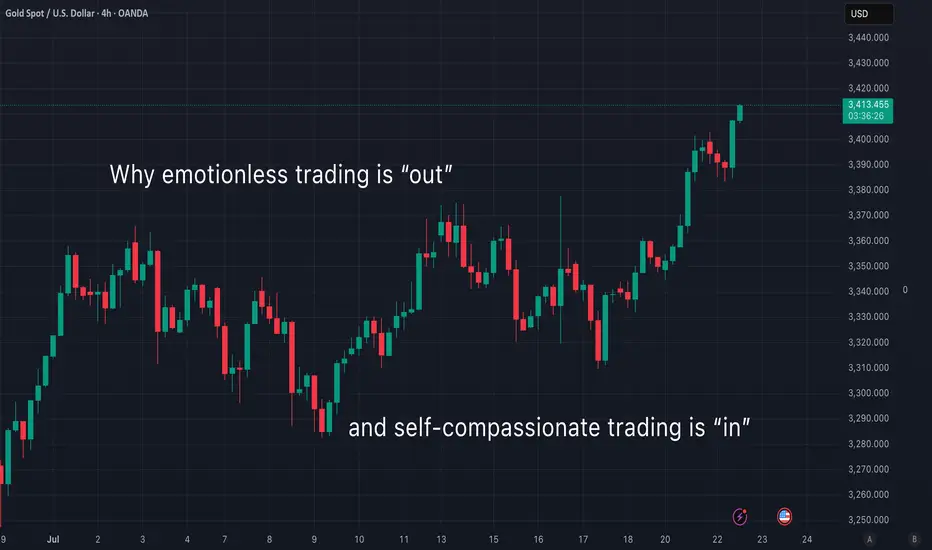
Why emotionless trading is out (and what to do instead)Curious about what self-compassionate trading really means?
Let’s do a little thought experiment together. Imagine you just closed a losing trade. You’re feeling disappointed and unmotivated. You invite two friends over to your home and tell them what happened. Which friend would you rather talk to?
🙋🏽♀️ Friend 1 says:
"What a failure you are. Why were you even stressed out? That’s so silly. Couldn’t you see this trade was going to be a loss? You should just give up—what’s the point of trying? I don’t understand how you could mess up the way you did. Let’s spend the afternoon going through everything you did wrong."
...Or would you prefer:
🙋🏽♀️ Friend 2 who says:
"I can see you’re feeling sad and disappointed about that last trade. I’m really sorry it didn’t go your way. But you know what? Losses are a part of trading—we all go through them. You’ll have another chance tomorrow. I can tell you’re doing your best. Let’s do something kind for ourselves today, and tomorrow you’ll get back to it. Don’t give up—I’m proud of you for chasing your dreams."
🤔 So, who would you choose?
I know this little experiment might sound a bit dramatic—but be honest, wouldn’t we all prefer Friend 2 ? And isn’t Friend 1 sounding suspiciously like that inner critic of yours?
For the longest time, trading advice has told us to "get rid of emotions" and stay completely “stress-free.” I wish it were that simple…
The truth is, trying to trade without emotions is like talking to yourself like Friend 1 . Not only is it impossible —it also builds a harsh, critical inner dialogue that damages both your confidence and motivation.
The reality is: we don’t have full control over our thoughts and emotions. They show up whether we want them to or not. If we could choose our emotional state, we’d all stay calm and focused every time we trade. But that’s not how the human mind works.
Instead of fighting our emotions, we can learn to open up to them—without judgment.
Self-compassionate trading means treating yourself like Friend 2 . It’s about acknowledging when things are tough, and being kind to yourself when stress or anxiety shows up. It’s about replacing harsh self-talk with encouragement, warmth and understanding.
👩🏽🔬 Some people think self-compassion is soft, ”girly”, or even “too emotional.” But guess what? It’s backed by tons of solid research. Studies show that self-compassion helps reduce self-criticism and improve motivation. It’s also an effective tool for managing tough emotions and reducing stress and anxiety.
Self-compassionate trading is a win-win approach—it helps you stay grounded and resilient while building a meaningful trading journey. So why not give it a try? 👇
💡 Pro Tip:
Next time you close a losing trade, find yourself in a losing streak, or just feel anxious about your performance—ask yourself:
“What would I say to a good friend who’s going through the same thing?”
Then offer that same kindness and support to yourself.
Happy (self-compassionate) trading! 💙
/ Tina the Trading Psychologist
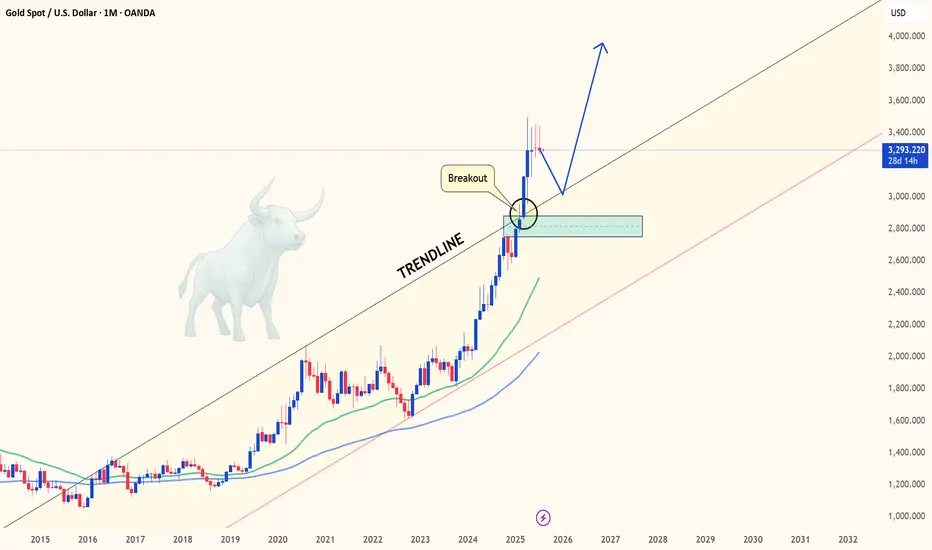
GOLD - Monthly breakout retest may confirm multi-year bull cycleHello everyone, what are your thoughts on the long-term outlook for XAUUSD?
Looking at the monthly chart (1M), we can clearly see that XAUUSD has broken out of the long-standing ascending channel that has held since 2015 — a major signal suggesting the start of a new bullish cycle. Price is now retesting the previously broken trendline, hinting at the possibility of a fresh upward leg to resume the longer-term bullish trend we've seen recently.
Personally, I'm targeting $3,600 in the medium term, and potentially $4,000 by 2026–2028 if institutional capital continues to rotate back into safe-haven assets like gold.
What about you — do you think BTC/USD will rise or fall in the coming years?
And what’s your target for it?

Bounce From Final Liquidity or Start of a Bullish Move? Bounce From Final Liquidity or Start of a Bullish Move?
After the FOMC event, gold completed a sweep of the final liquidity zone at 3269–3271 and rebounded strongly, in line with the broader bullish trend. The price has now recovered sharply and is gradually returning to the liquidity zones left behind after yesterday’s sharp drop.
📍 At the moment, gold is reacting around 3295, which aligns with a CP (Compression Point) Zone on the M30 chart. We're seeing a slight pullback here, and another retracement could occur before a strong upward continuation — potentially breaking out of the descending trendline that’s formed over recent days.
📊 Trading Plan & Key Levels
✅ BUY ZONE – Trend Continuation Setup
Entry: 3286–3284
Stop Loss: 3278
Take Profits:
3290 → 3294 → 3298 → 3304 → 3308 → 3312 → 3316 → 3320 → 3330 → …
💡 This is a prime area to look for re-entries into the dominant bullish move. Price action left a clean liquidity zone below after the aggressive upside reaction — ideal for riding the next wave.
❌ SELL ZONE – Only Valid Below VPOC
Entry: 3328–3330 (Volume Point of Control)
Stop Loss: 3335
Take Profits:
3324 → 3320 → 3315 → 3310 → 3305 → 3300
🔻 This is a high-probability short only if price stays below 3330. If gold closes above this VPOC region, the structure shifts to bullish and we should look for sells higher up — around 335x–337x zones.
📅 Monthly Candle Close – Watch for Indecision
As it’s the last trading day of the month, note that the past two monthly candles have printed doji-like wicks, signalling indecision and liquidity grabs. The market is still waiting for a clearer signal from the Fed on the first potential rate cut of the year.
🚫 Avoid emotional trading. This is a highly reactive environment, so careful risk management is key.
🧭 Final Thoughts
Gold continues to respect market structure and liquidity theory. The first major test lies at the 3313 resistance level — if broken, it opens the door to stronger bullish momentum toward the broader VPOC zone.
⏳ Be patient and only act when price confirms your bias.

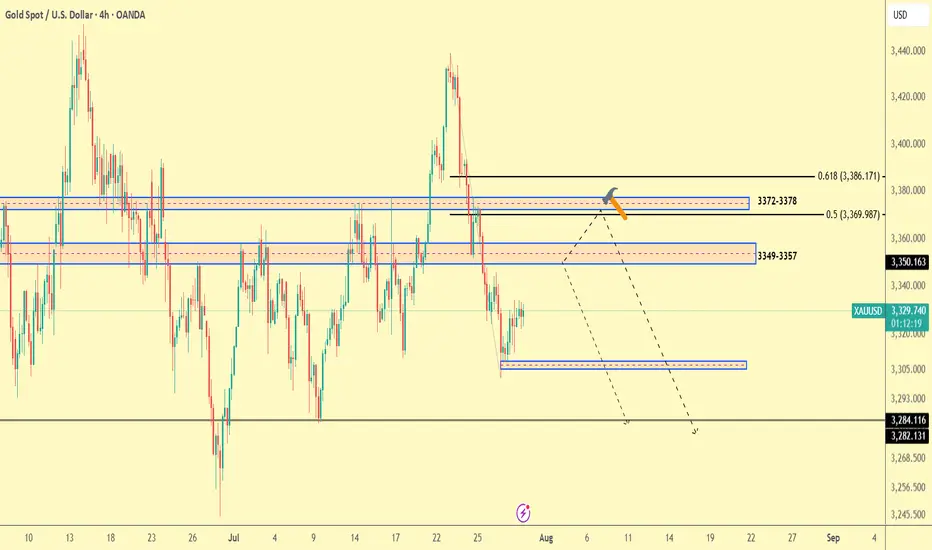
Gold Trade plan 30/07/2025Dear Traders,
This chart represents the XAU/USD (Gold / U.S. Dollar) pair on a 4-hour timeframe. The market is showing a series of Fibonacci retracements and key levels, with potential price action zones marked for future movements.
Key Levels:
Resistance Zones: At 3,422.105 (near the green line), followed by the 3,386.171 level (Fibonacci 0.618).
Support Zones: Major support is visible near 3,282.131 (bottom of the chart), with additional minor support levels at 3,305.000 and 3,293.000.
Mid-range Support: Around 3,369.987.
Potential Price Action:
The price recently dropped from higher levels, breaking below the previous support levels. The market seems to be testing lower support zones.
A potential move down towards 3,284.116 or 3,282.131 is likely if the current support levels do not hold.
Conversely, if price action holds the current support zone (3,329.040), a retest of the higher resistance at 3,350.163 could occur.
Fibonacci Levels:
Retracement Levels: The Fibonacci retracement is drawn with key levels, particularly around 3,372-3,378 and 3,349-3,357, acting as strong support or resistance.
Extensions: There is potential for the price to move towards the 3,420 region if resistance levels break.
Strategy Suggestion:
Short Position: Targeting lower levels near 3,282.131 or 3,284.116.
Long Position: If price holds above 3,329.040, target resistance at 3,350.163 and beyond.
Regards,
Alireza!
Gold Market Outlook – 1H ChartGold (XAU/USD) continues to show bearish momentum with lower highs and consistent structural breakdowns. Price is currently consolidating just above a key support zone (~3315), forming a descending triangle pattern — often a bearish continuation signal.
If the support breaks, the next liquidity zones lie around 3270–3250, with a deeper target near 3225, as highlighted by the green demand areas. Fundamental catalysts ahead (as shown by US economic events) could act as triggers.

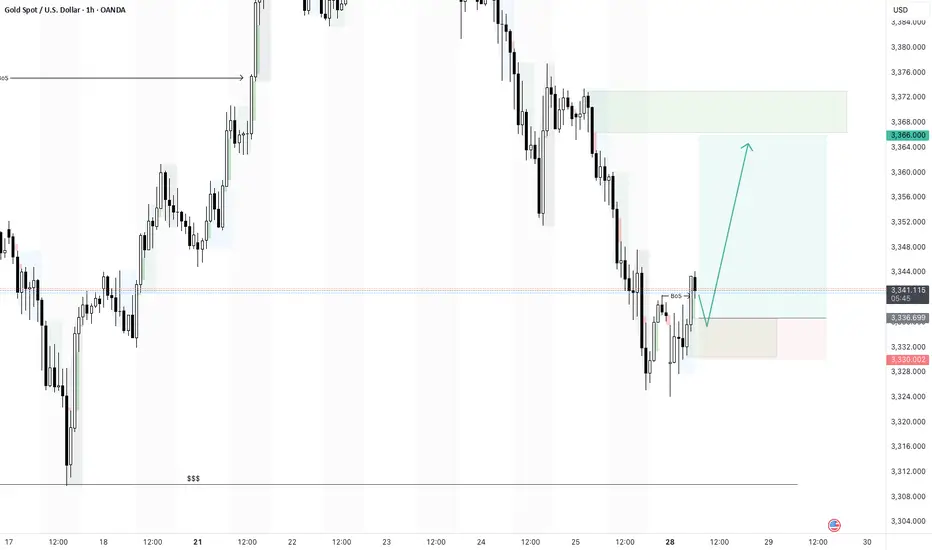
GOLD BUY TRADE IDEA • Price Action Context:
• Recent bearish leg shows a clear shift from premium to discount territory.
• Market is approaching a higher timeframe demand zone around $3,277 – $3,299 (highlighted red zone).
• Notable inducement below recent lows suggests engineered liquidity to fuel a potential reversal.
• Current Market Structure:
• After a deep retracement, price is expected to tap into the discount zone, where institutional buy orders may be resting.
• Anticipated bullish reaction following a liquidity sweep of the lows and demand mitigation.
• Smart Money Flow:
• Inducement ➝ Liquidity Grab ➝ Demand Tap ➝ Bullish Reaction setup in play.
• Internal structure likely to shift bullish after a sweep, potentially forming a higher low and aiming for a BOS (Break of Structure) on the upside.
• Upside Target:
• Short-term target area: $3,360 – $3,380.
• Possible continuation toward premium if internal structure confirms strength.
🧠 Smart Money Narrative:
1. Induced sell-off below structure for liquidity collection.
2. Approaching major POI (Point of Interest) in discount.
3. Anticipated entry point for institutions to buy gold at value.
4. Reversal expected toward premium imbalance areas.

XAUUSD: Buy ideaOn XAUUSD we have a very nice buy candle. Indeed, this candle reassures us of a high probability of an upward trend....

XAUUSD 28/2/25 - Morning bullish pushBased on the 1hr- there is a break of structure and i am looking for a bullish move this morning.
There is a chance that this trade fails as there is a 4hr equal low liquidity below which could draw the price to.
Im still going to take this trade and let price do its thing today.
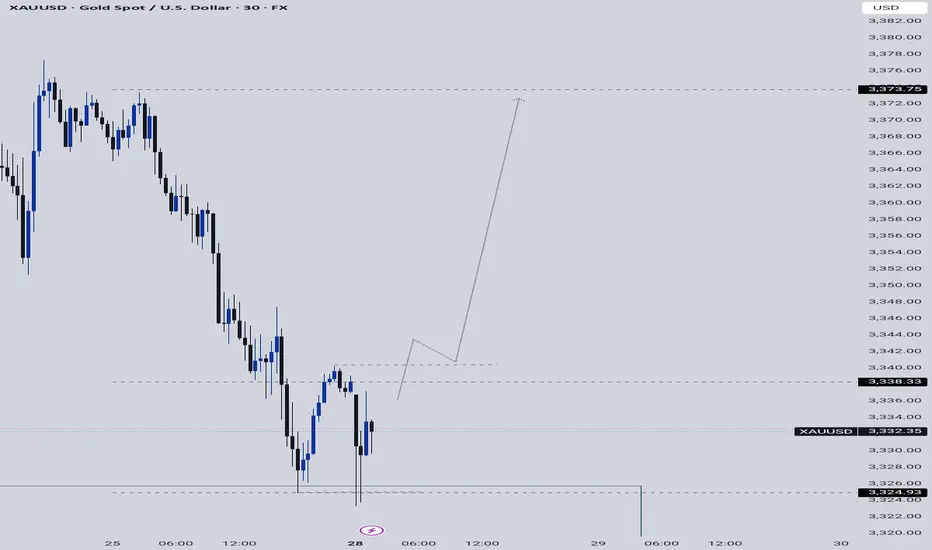
Gold (XAU/USD) Daily Trading Plan - 28th July 2025🔺 Technical Analysis
Gold opened the Asian session this week with a slight retracement, testing the 0.382 Fibonacci Retracement level before bouncing back strongly to last week's closing price around 3339. This move further solidifies the price action from a technical perspective.
Notably, gold has broken through a minor resistance on the M15 timeframe, invalidating the bearish structure and forming a full-bodied H1 candle. This sets the stage for a potential corrective uptrend to unfold.
On the Daily timeframe, the initial session's decline retested the bullish trendline and bounced back within the boundaries of the flag pattern. It's likely that this week, the price will continue towards the end of this pattern, providing a clearer confirmation of the medium-term trend.
🔺 Key Macroeconomic News
This week promises to be volatile with several crucial economic announcements, particularly as it marks both the end of the month and the start of a new one. Two key events that traders should pay close attention to are:
FOMC Interest Rate Decision: Always a focal point for the market, with significant impact on safe-haven assets like gold.
Non-Farm Payroll (NFP) Report: Vital US labour market data, capable of triggering substantial movements in both the USD and gold.
Therefore, be prepared for potential market shocks and exercise careful risk management.
📈 Trading Strategy & Considerations
Given the technical setup and upcoming macroeconomic events, consider the following:
Potential Corrective Uptrend: The invalidated bearish structure on M15 and the strong H1 candle suggest a short-term bullish bias for a corrective move.
Daily Flag Pattern: Monitor price action as it approaches the end of the flag pattern on the Daily timeframe for medium-term trend confirmation.
High Volatility Ahead: Exercise extreme caution around the FOMC and NFP announcements. These events can lead to significant and rapid price swings.
Risk Management: Prioritise strict risk management. Consider reducing position sizes or employing wider stop-losses during high-impact news events.
Disclaimer: This analysis is for informational purposes only and does not constitute financial advice. Trading involves significant risk, and you should only trade with capital you can afford to lose.

XAU/USD) Bearish Trend Read The captionSMC Trading point update
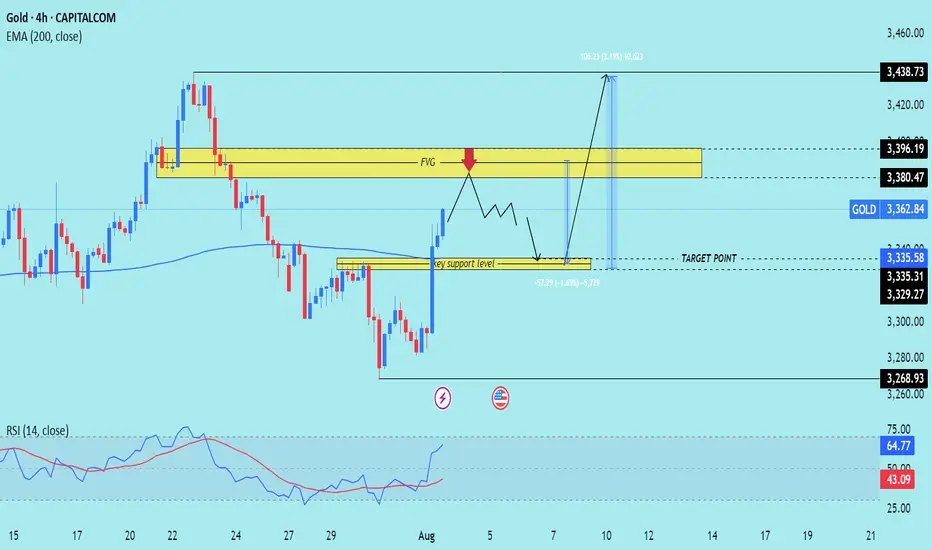
Technical analysis of (XAU/USD) on the 4-hour timeframe, showing both a potential retracement and a bullish continuation.
---
Technical Breakdown:
1. Current Market Structure:
Price recently made a strong bullish push from the key support level (~3,329–3,335), breaking structure to the upside.
It is now approaching a Fair Value Gap (FVG) and resistance zone between 3,380.47 and 3,396.19.
2. Key Zones Identified:
FVG / Resistance Zone: 3,380.47–3,396.19 — where price might initially reject (red arrow) due to unfilled imbalance and previous supply.
Key Support Zone: 3,329.27–3,335.31 — potential area of re-entry or demand if price pulls back.
EMA 200 (Blue): Currently at 3,335.58, aligning with key support.
3. Price Path Scenarios:
Primary Expectation: Price may tap into the FVG, face rejection, then pull back into the key support level for a higher low.
From there, it is projected to bounce back strongly toward the ultimate target at 3,438.73, marking a 3.19% upside move.
4. RSI (14):
RSI at 64.77, indicating strong bullish momentum but not yet in overbought territory. Favorable for continuation, but a short-term correction is possible.
Mr SMC Trading point
---
Trade Idea Summary:
Bias: Bullish (after a short-term rejection)
Entry Zones:
Watch for rejection at 3,380–3,396
Look to enter on a retest of 3,335–3,329 support
Target Zone: 3,438.73
Invalidation: Sustained breakdown below 3,329 or bearish engulfing with high volume
EMA & RSI Support: EMA 200 backs bullish bias; RSI confirms momentum
Please support boost 🚀 this analysis)
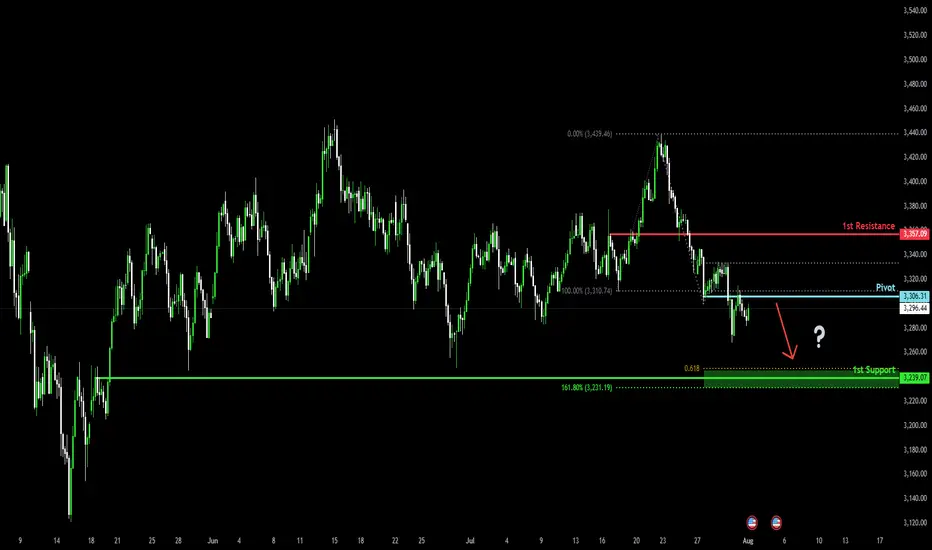
Potential bearish drop?The Gold (XAU/USD) has reacted off the pivot and could drop to the 1st support.
Pivot: 3,306.31
1st Support: 3,239.07
1st Resistance: 3,357.09
Risk Warning:
Trading Forex and CFDs carries a high level of risk to your capital and you should only trade with money you can afford to lose. Trading Forex and CFDs may not be suitable for all investors, so please ensure that you fully understand the risks involved and seek independent advice if necessary.
Disclaimer:
The above opinions given constitute general market commentary, and do not constitute the opinion or advice of IC Markets or any form of personal or investment advice.
Any opinions, news, research, analyses, prices, other information, or links to third-party sites contained on this website are provided on an "as-is" basis, are intended only to be informative, is not an advice nor a recommendation, nor research, or a record of our trading prices, or an offer of, or solicitation for a transaction in any financial instrument and thus should not be treated as such. The information provided does not involve any specific investment objectives, financial situation and needs of any specific person who may receive it. Please be aware, that past performance is not a reliable indicator of future performance and/or results. Past Performance or Forward-looking scenarios based upon the reasonable beliefs of the third-party provider are not a guarantee of future performance. Actual results may differ materially from those anticipated in forward-looking or past performance statements. IC Markets makes no representation or warranty and assumes no liability as to the accuracy or completeness of the information provided, nor any loss arising from any investment based on a recommendation, forecast or any information supplied by any third-party.
XAUUSD
XAUUSD Updated in 5M :
The gold signal is marked on the chart based on the latest price changes and the supply and demand in the market. These points include the entry point, stop loss, and take profit
Gold big data is here! Gold prices are igniting the market!Market News:
Spot gold fluctuated narrowly in early Asian trading on Wednesday (July 30), currently trading around $3,325 per ounce. London gold prices recovered some of their losses on Tuesday after falling for the fourth consecutive day, as the US dollar gave up some of its earlier gains, boosting international demand for gold. Declining US Treasury yields and a weak US labor market report also prompted investors to buy gold. The gold market is currently at a critical turning point. Fundamental buying and selling factors are in fierce competition: on the one hand, easing global trade tensions are suppressing safe-haven demand; on the other hand, falling US Treasury yields and expectations of a possible Federal Reserve shift are providing support. Meanwhile, progress in US-China trade negotiations, Trump's tough stance on Russia and the Middle East, and ongoing geopolitical tensions continue to add further uncertainty to the future of the gold market. Furthermore, attention will be paid to the Bank of Japan and Bank of Canada's interest rate decisions, the US second-quarter GDP data and the July ADP employment data. Second-quarter GDP data from Germany and the Eurozone also warrant attention.
Technical Review:
Gold bottomed out and rebounded, stopping at the 3310 level before rising sharply above the 30 mark. The daily chart closed with a small positive candlestick pattern. The 10/7-day moving averages remain converging, suppressing the 57 level above. The RSI stopped below the 50-day moving average and adjusted downward, with the price trading below the middle Bollinger Band at 40. A four-hour chart golden cross formed and pointed upward. The hourly MACD momentum bar is above zero, while the RSI is flattening, indicating a neutral trend. Gold technically remains in a wide range of fluctuations. The trading strategy is to sell high and buy low. Plan to buy low at 3318/06 and sell high at 3346/58. The release of important data today will affect the original technical trend of gold and silver, increasing volatility. Be aware of market risks.
Today's Analysis:
Although gold rebounded yesterday, the momentum wasn't particularly strong, with the upward trend remaining erratic. Bullish volume remains insufficient. Today's key events will be the non-farm payroll report and the Federal Reserve's interest rate decision. Pre-market activity is unlikely to see a significant upturn, so we'll have to wait for the data to provide direction. Expect volatility before the release! The slope of gold's 1-hour rebound doesn't necessarily indicate a deep V-shaped pattern. Gold hasn't yet reversed, and a second bottom is possible. Only if gold doesn't break a new low during this second bottoming out could a double bottom form. Gold is still expected to decline in the Asian session. If gold rebounds and comes under pressure, continue selling. A deep V-shaped reversal is only possible if gold breaks through and stabilizes at the 3345 level. Until then, continue selling at high prices.
Trading strategy:
Short-term gold: Buy at 3310-3313, stop loss at 3300, target at 3340-3360;
Short-term gold: Sell at 3343-3346, stop loss at 3355, target at 3310-3300;
Key points:
First support level: 3310, Second support level: 3292, Third support level: 3284
First resistance level: 3338, Second resistance level: 3346, Third resistance level: 3358

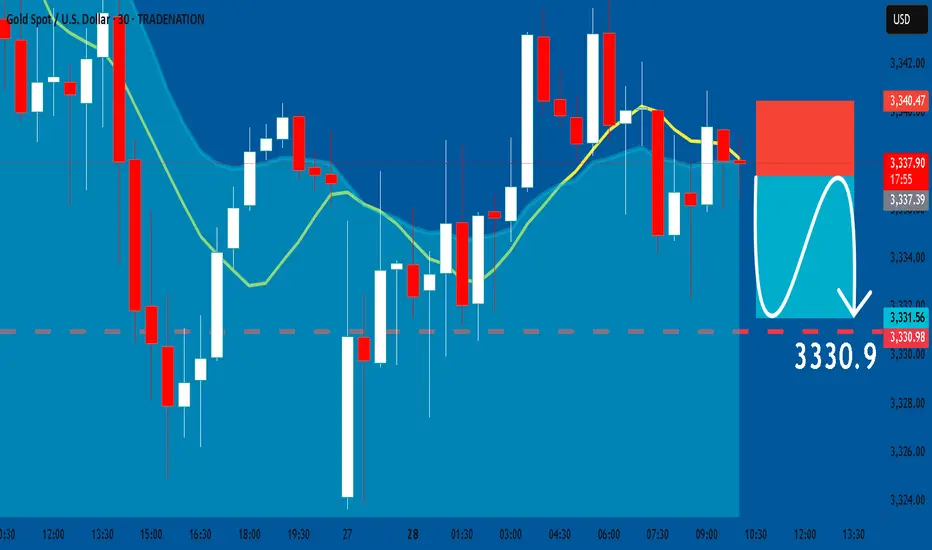
GOLD: Short Trade with Entry/SL/TP
GOLD
- Classic bearish setup
- Our team expects bearish continuation
SUGGESTED TRADE:
Swing Trade
Short GOLD
Entry Point - 3337.3
Stop Loss - 3340.4
Take Profit - 3330.9
Our Risk - 1%
Start protection of your profits from lower levels
Disclosure: I am part of Trade Nation's Influencer program and receive a monthly fee for using their TradingView charts in my analysis.
❤️ Please, support our work with like & comment! ❤️
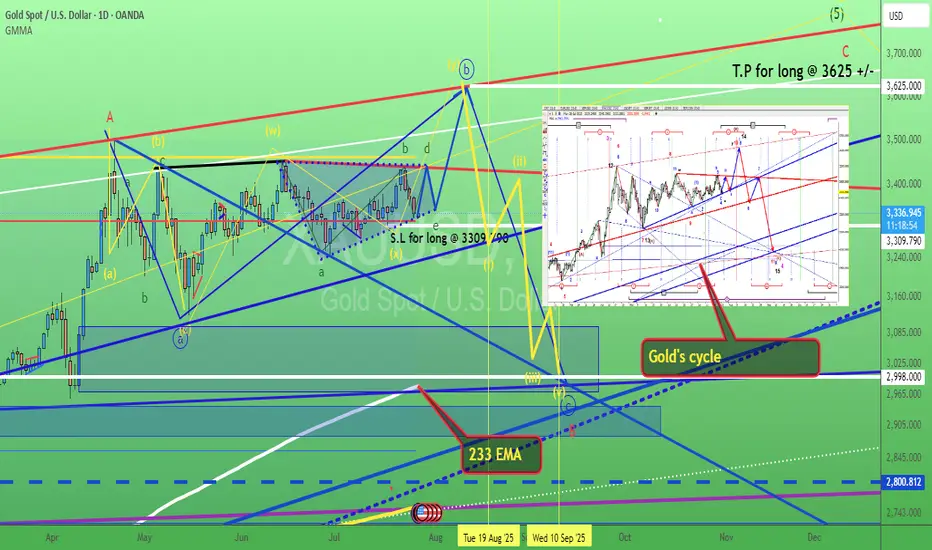
Gold. Bull Trap "triangle". 28/July/25XAUUSD, by checking gold latest speed of chart with its cycle. we might have a bull 'trap" triangle. A base for rallying to ATH again before a very deep pullback toward 233 Daily EMA which have not been "touched" for long time...
XAUUSD Gold just jumped to our 4H POI, we now wait for confirmation for buys to the upside targeting new highs.
How's your outlook?
Gold Intraday Trading Plan 7/28/2025As explained in my weekly post, I am bearish on gold in short and medium term right now. Moreover, in smaller timeframe, the trendline has been broken. I am looking for selling opportunity from the retesting of the trendline, which is around 3352. My target for today is 3300, ultimate target for this week is 3252.

XAUUSD 4H – Massive Sell Setup: Gold Crash Incoming? Gold (XAUUSD) just tapped into a key liquidity zone near the 38.2% Fibonacci retracement at $3,364, followed by a sharp rejection. This aligns with the upper channel resistance and a bearish confluence from previous supply zones.
Price has failed to break above the dynamic EMA cluster and is showing signs of exhaustion after a relief rally. If momentum follows through, this could mark the beginning of a deeper selloff targeting major downside levels.
Short Setup
Entry: Around $3,349–$3,364 (rejection zone)
SL: Above $3,379
🚨Strong bearish engulfing candle confirms seller pressure
🎯 Take Profit Targets (Fibonacci):
TP1: $3,305 (38.2%)
TP2: $3,275 (61.8%)
TP3: $3,241 (Full move – 100% Fibonacci extension)
This setup offers high risk-reward if the rejection holds and price breaks below the mid-zone structure at $3,330. A drop below $3,305 could accelerate the move as liquidity gets swept.

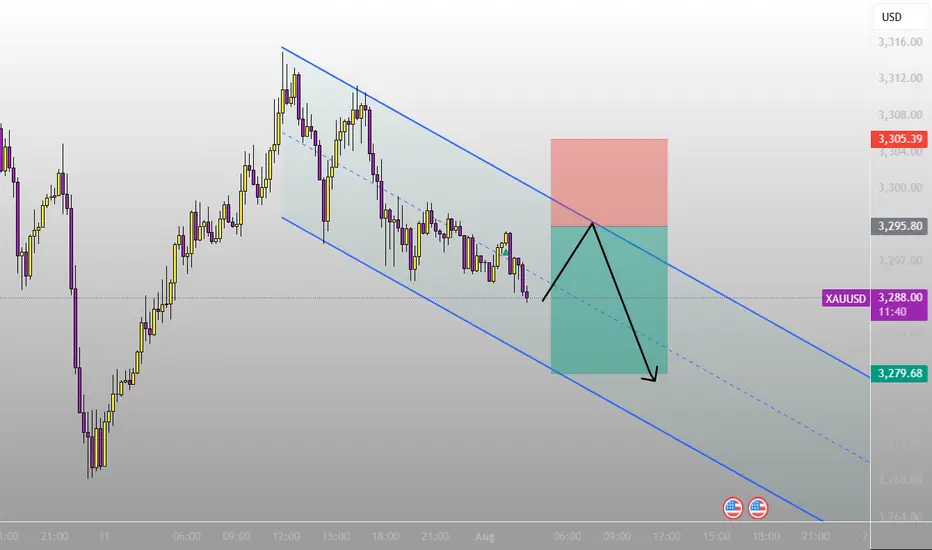
XAUUSD Technical AnalysisTechnical Analysis – Symmetrical Triangle with Retest
Current Market Situation
The chart shows a symmetrical triangle pattern, which is a continuation pattern often followed by strong directional movement.
The price has broken below the triangle, signaling a potential bearish move.
Currently, the price is in the retest phase of the broken triangle, which is an important area to confirm the bearish trend before continuing downward.
Key Zones
Retest Zone (Pullback): Located between current price and 3,374, which is a strong resistance area.
Targets (TP):
TP1: 3,322.97
TP2: 3,285.87
TP3: 3,262.59
Possible Scenarios
✅ Bearish Scenario (Preferred):
If the price holds below the retest zone, we expect a continuation to the downside towards:
Target 1: 3,322.97
Target 2: 3,285.87
Target 3: 3,262.59
⚠ Bullish Scenario (Alternative):
A daily close above 3,374 will invalidate the bearish scenario and may trigger a reversal.
Conclusion
The market shows a strong technical indication of a bearish continuation after confirming the retest.
Any daily close above 3,374 would cancel the bearish scenario.
It is recommended to monitor price action closely in the retest zone for confirmation before entering trades.

XAUUSD Weekly Outlook – August 4–8, 2025New Month. New Week. New Questions.
Will the market reward hesitation — or bold reaction?
Will POTUS pump price with policy noise, or will smart money fade the manipulation?
August is historically a quieter month for hedge funds — but don’t mistake silence for safety. It's also the time when the Fed retreats to Jackson Hole, reflecting and recalibrating. Will September bring another rate cut… or another twist?
Stay sharp. This isn’t a month to sleep on.
"Last week's game plan played out nearly to perfection — well, almost! Let’s dive in and break down where gold could be headed next week."
Gold kicks off August with a strong breakout above $3360, powered by a weakening U.S. dollar, rising global risk appetite, and persistent institutional demand. With Jackson Hole on the horizon and shifting Fed expectations, volatility is set to spike. The big question: will gold extend above premium, or retrace to rebalance?
After the last rejection near 3440, price broke cleanly below its ascending channel. Now, gold appears to be forming a potential lower high around the broken trendline — a rejection here could trigger a drop toward the key $3250 support zone.
🟡 XAUUSD – August Macro Outlook
💰 Price: $3362
📅 Date: August 3, 2025
📈 Bias: Bullish but extended — high in premium
🔸 Monthly Overview
📊 Trend: Bullish continuation (CHoCH April 2023)
🧱 Supply Zone: 3350–3439 → monthly wick trap
⚠️ RSI 80+, price nearing 100% Fib extension
🔮 Breakout above 3439 → 3505 / 3610 next
🔻 Rejection → pullback to 3270 / 3180
🔸 Weekly Outlook
💥 Structure: Strong bullish, EMA stack intact
🟥 Final HTF Supply: 3350–3439 (currently testing)
🟦 Demand Below: 3270 → 3215 → 3070
🎯 Targets if breakout: 3505 → 3560 → 3610
🔸 Daily Structure
⚔️ Now testing: 3355–3375 → last valid supply
🎭 Above that → internal trap at 3398–3412
🧨 Final ceiling at 3430–3439 — breakout or reversal?
🔸 H4 / H1 Key Zones
🟥 Supply: 3360–3375 / 3385–3398 / 3430–3439
🟫 Flip Long Zone: 3322–3310
🟦 Bullish Demand: 3285–3260 → 3222–3205
⚠️ RSI elevated, watch for reaction not breakout
🔹 Execution Plan
✅ Above 3439 → Expansion to 3505 / 3610
🔁 Pullback to 3325 / 3285 → Sniper long zones
🔻 Rejection from 3375 → Short scalp → Target 3320
📌 3439 = Key Monthly Pivot
🟢 Hold above → New expansion wave
🔴 Fail below → Retrace toward value
Extended:
🔸 Scenario 1: Breakout and Expansion
If bulls push through 3375 with conviction and break above 3439, gold enters a fresh leg of macro price discovery. This would activate a clean expansion path toward:
3405 (short-term extension)
3505 → 3560 → 3610 (Fibonacci projections)
3740 (full trend extension if momentum persists)
This scenario requires solid bullish confirmation, especially on H4 or D1 structure. Traders should look for LTF OB re-entries or bullish flags above 3350 to join the trend safely.
🔸 Scenario 2: Rejection and Retrace
If gold rejects from the 3360–3375 zone and fails to hold above it, a controlled retracement is likely. Key downside targets include:
3325 → first flip zone for re-entry
3285 → origin of the latest rally (strong buy zone)
3215–3180 → high-timeframe demand and imbalance fill
Only a breakdown below 3260 would threaten the bullish structure and shift bias toward neutral or bearish.
🔸 Conclusion
Gold is approaching its inflection point. The macro trend is intact, but momentum is stretched, and the market now demands clear validation.
📌 3439 remains the weekly pivot:
Above → Expansion toward 3500+
Below → Retracement to reclaim value
For next week, the most probable path is early consolidation inside 3360–3375, followed by a decisive reaction — either continuation toward 3405+, or a corrective drop toward 3325/3285 to reset structure.
Disclaimer: For educational context only.
#XAUUSD #Gold #SmartMoney #TradingAnalysis #SMC #USD #GoldOutlook
