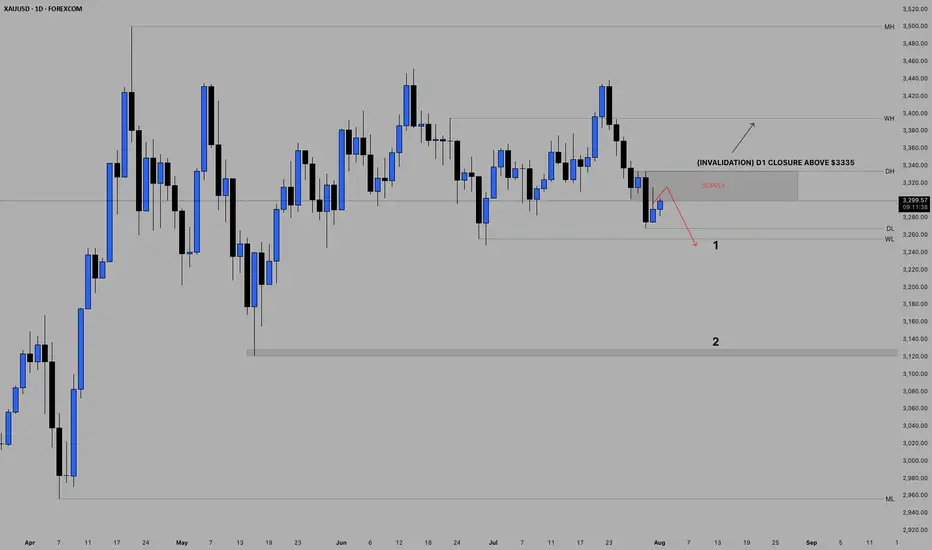
POSSIBLE BEARISH CONTINUATION ON GOLDBased on price action, Gold presents a very bearish sentiment from the daily point of view.
The indicated supply region may be the area of interest for the build up of the sells if indeed Gold is bound for the monthly lows.
Confirmation is needed for an entry.
GOLDCFD trade ideas
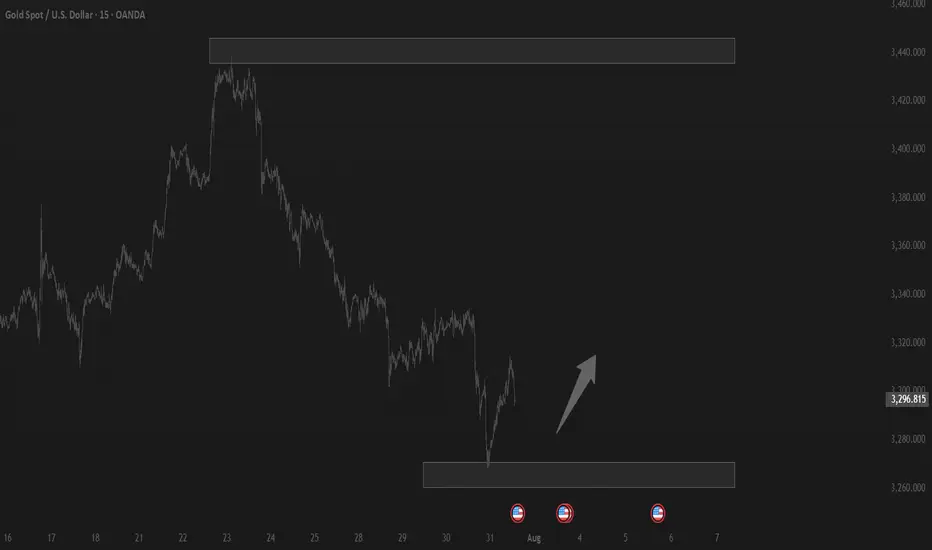
Trading balanceTrading balance The price of the asset has rebounded from the balance zone. With the prospect of growth into the resistance zone.
Xausd techinical analysis.Xausd techinical analysis next move posibale at h1 time frame not finchinical advice.

Is the gold correction over?✏️Yesterday's D1 candle closed above the Breakout 3363 zone. This shows that the buyers in the US session are still strong. There is a possibility of a liquidity sweep in the Tokyo and London sessions, then in the New York session, Gold will recover and increase again. The uptrend is really broken when Gold confirms a close below 3345. In this case, we have to wait for 3320 to confirm the BUY point. The gold uptrend at this time also needs new momentum to be able to move towards ATH 3500.
📉 Key Levels
Support: 3345-3320
Resistance: 3373-3418
Buy zone: 3345 (bullish wave structure maintained); BUY DCA break 3373
Buy zone: 3320 (Strong support zone)
Target: 3417
Leave your comments on the idea. I am happy to read your views.

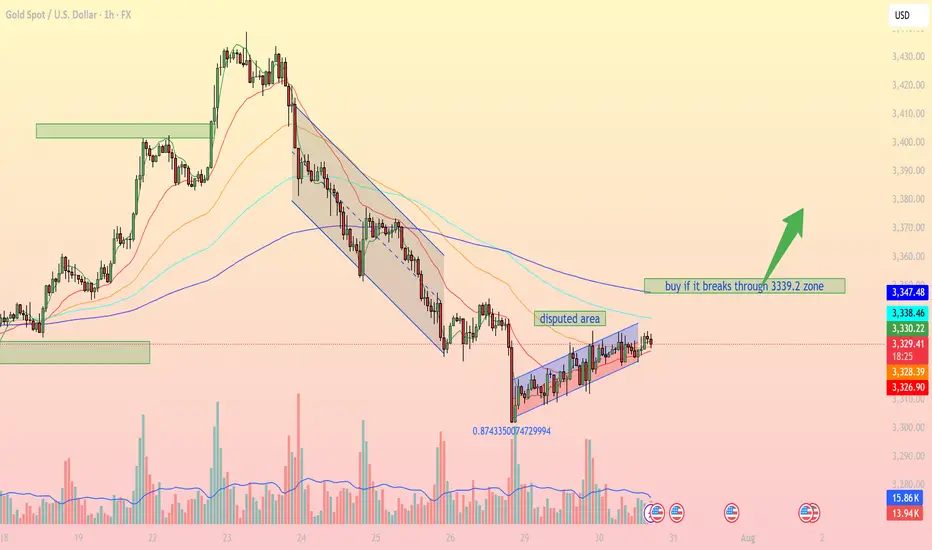
Accumulation pattern awaiting breakout confirmationIntraday Outlook: Accumulation pattern awaiting breakout confirmation
On the 1H timeframe, XAUUSD is forming a clear consolidation pattern within a narrow ascending channel after falling from a prior distribution zone. Buyers are attempting to regain control, but strong resistance remains around the 3,339 – 3,347 USD area.
1. Technical Breakdown:
Trendline & Channel: Price is currently moving inside a small rising channel, indicating a short-term bullish bias, though momentum remains limited.
EMA Dynamics: EMA 20, 50, and 100 are beginning to converge, signaling a potential breakout. A bullish EMA crossover (EMA20 > EMA50) could confirm stronger upward momentum.
Disputed Area: This zone represents heavy indecision between bulls and bears. A clear breakout above or below is needed for directional clarity.
Fibonacci Level: The 0.874 retracement level from the recent low shows strong buyer interest, potentially forming a short-term bottom.
2. Key Support & Resistance Levels:
3,339.2 USD Major resistance – needs to be broken for bullish continuation
3,347.4 USD Next resistance if breakout occurs
3,328.2 USD Immediate support (current price zone)
3,326.7 USD Strong support if price retraces
3. Suggested Trading Strategies:
Scenario 1 – Breakout Buy Strategy:
Entry: Buy if price breaks and closes above 3,339.2 USD on the 1H chart.
Stop Loss: Below 3,328 USD.
Take Profit: First target at 3,347, extended targets at 3,358 and 3,372 USD.
Scenario 2 – Pullback Long Entry:
If price fails to break resistance, consider buying the dip near the 3,326 – 3,328 USD support zone for a better risk-reward setup.
Scenario 3 – Breakdown Sell Setup:
If price breaks below 3,326 USD and exits the channel, a bearish move towards 3,295 – 3,300 USD becomes likely.
Gold is in a key consolidation phase, with the 3,339 USD resistance acting as the decisive breakout zone. Traders should closely monitor price action, volume, and EMA behavior to catch the next directional move.
Follow for more trading strategies like this. Save this post if you find it useful!
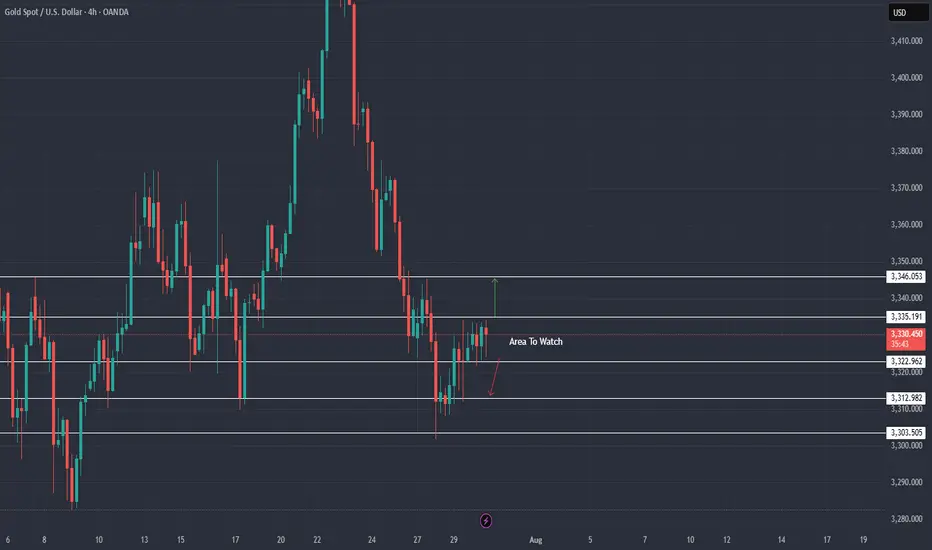
July 30, 2025 - XAUUSD GOLD Analysis and Potential Opportunity🔍 Key Levels to Watch:
• 3384 – Resistance
• 3375 – Key resistance
• 3365 – Resistance
• 3345 – Resistance
• 3336 – Resistance
• 3325 – Key support
• 3310 – Support
• 3300 – Psychological level
• 3283 – Major support
• 3275 – Support
• 3265 – Support
📈 Intraday Strategy:
• SELL if price breaks below 3325 → target 3320, then 3315, 3310, 3300
• BUY if price holds above 3330 → target 3336, then 3345, 3350, 3356
👉 If you find this helpful or traded using this plan, a like would mean a lot and keep me motivated. Thanks for the support!
Disclaimer: This is my personal view, not financial advice. Always use proper risk control.

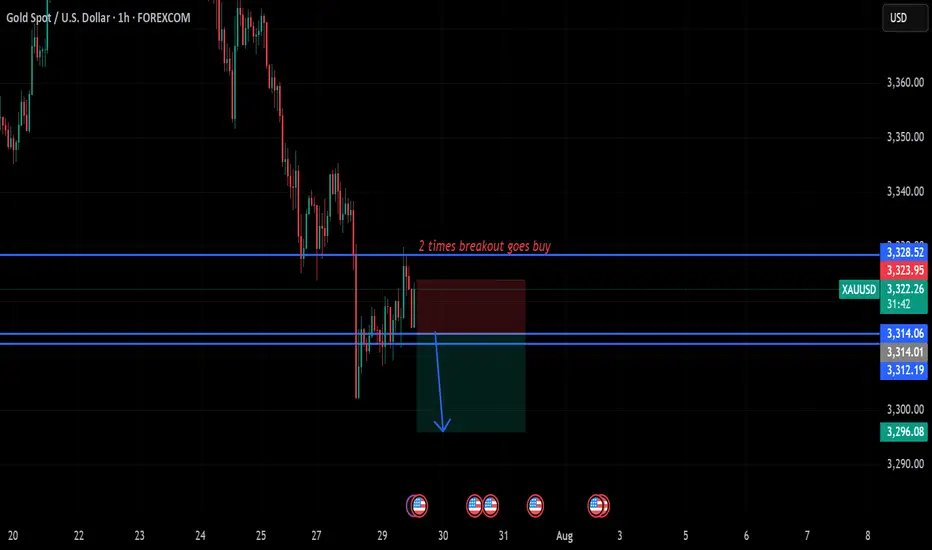
gold on sideways#XAUUSD price await double breakout above 3328.6 for bullish to take place. But now we await for any breakout to take trade.
Below 3314 holds sell continuation, target 3296, stop loss 3324.
Above 3328.6 on 2 times breakout will start bullish till 3340.
Gold Market Technical Analysis and Trading StrategiesGold Market Technical Analysis and Trading Strategies
Current Trend Analysis
Gold prices entered a technical rebound after testing key support at $3,300 and are currently trading in a narrow range between $3,315 and $3,320. This area constitutes a key bull-bear dividing line, acting as both upper resistance at the hourly chart's descending channel and technical resistance from a previous low. Since retreating from the April high of $3,500, gold prices have fallen 5.7%, primarily due to the Federal Reserve's hawkish stance and a stronger dollar.
Key Price Analysis
Resistance Zone: 3,320-3,325 (upper channel edge + Fibonacci 23.6% retracement level)
Support Level: 3,300, a psychological barrier; a break below could see prices fall to 3,280-3,260.
Bull-Bear Divide: A break above 3,320 could see prices rise to 3,340-3,353; a break below 3,310 would signal a continuation of the trend.
Market Sentiment and Momentum
COMEX net long positions have fallen to a year-to-date low, reflecting subdued market sentiment. The MACD hourly chart shows a bottoming divergence, indicating weakening short-term downward momentum, but shrinking trading volume raises doubts about the sustainability of the rebound. A doji candlestick appears after consecutive negative closes on the daily chart, reflecting a temporary equilibrium between bulls and bears.
Trading Strategy Recommendations
Primary Strategy: Set up short positions on dips under pressure between 3320-3325, with a stop-loss above 3332. Targets are 3310-3305. A break below targets 3280.
Secondary Strategy: Try a small buy position if the price stabilizes at 3315, with a strict stop-loss below 3310 and a target of 3330-3340.
Position Management: Limit risk per trade to 1-2%, with a stop-loss of $6-8.
Risk Warning: Focus on a breakout above the 3315-3320 area. Performance in the European session may indicate the direction of the US market. Be wary of volatility risks arising from changes in US economic data and Fed policy expectations. The medium- to long-term downward trend remains unchanged; strict stop-loss orders are recommended for short-term trading.

XAU / USD 4 Hour ChartHello traders. Looking at the 4 hour chart, I have not changed a thing from my last post on Friday of last week. Saying that, we are my area of interest to see if we hold support or keep moving down. It's only Monday, so I am in not trying to force or rush a trade. Big G gets a shout out. Pre NY volume starts as of this writing here in the US. Let's see how things play out, be well and trade the trend. Happy Monday :)

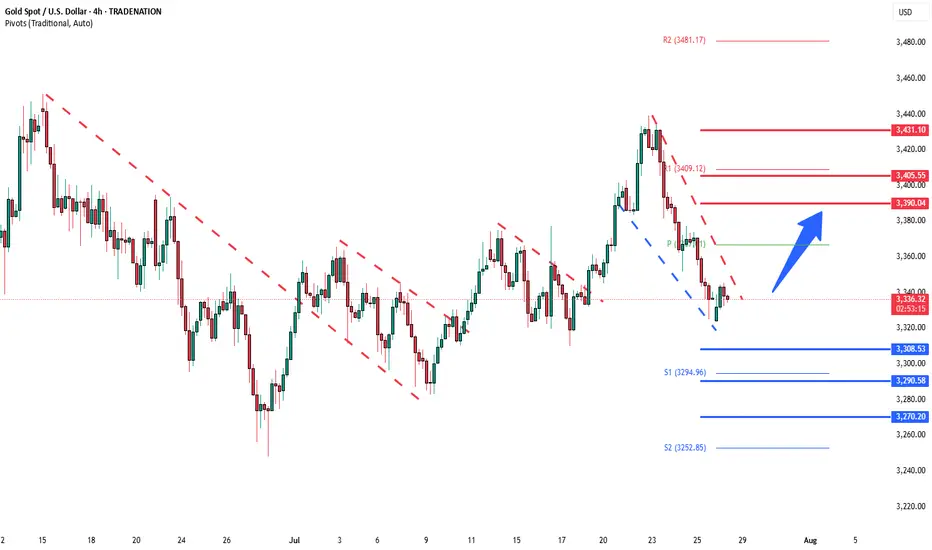
Gold protracted consolidation The Gold remains in a bullish trend, with recent price action showing signs of a continuation breakout within the broader uptrend.
Support Zone: 3308 – a key level from previous consolidation. Price is currently testing or approaching this level.
A bullish rebound from 3308 would confirm ongoing upside momentum, with potential targets at:
3387 – initial resistance
3400 – psychological and structural level
3435 – extended resistance on the longer-term chart
Bearish Scenario:
A confirmed break and daily close below 3308 would weaken the bullish outlook and suggest deeper downside risk toward:
3290 – minor support
3268 – stronger support and potential demand zone
Outlook:
Bullish bias remains intact while the Gold holds above 3308. A sustained break below this level could shift momentum to the downside in the short term.
This communication is for informational purposes only and should not be viewed as any form of recommendation as to a particular course of action or as investment advice. It is not intended as an offer or solicitation for the purchase or sale of any financial instrument or as an official confirmation of any transaction. Opinions, estimates and assumptions expressed herein are made as of the date of this communication and are subject to change without notice. This communication has been prepared based upon information, including market prices, data and other information, believed to be reliable; however, Trade Nation does not warrant its completeness or accuracy. All market prices and market data contained in or attached to this communication are indicative and subject to change without notice.
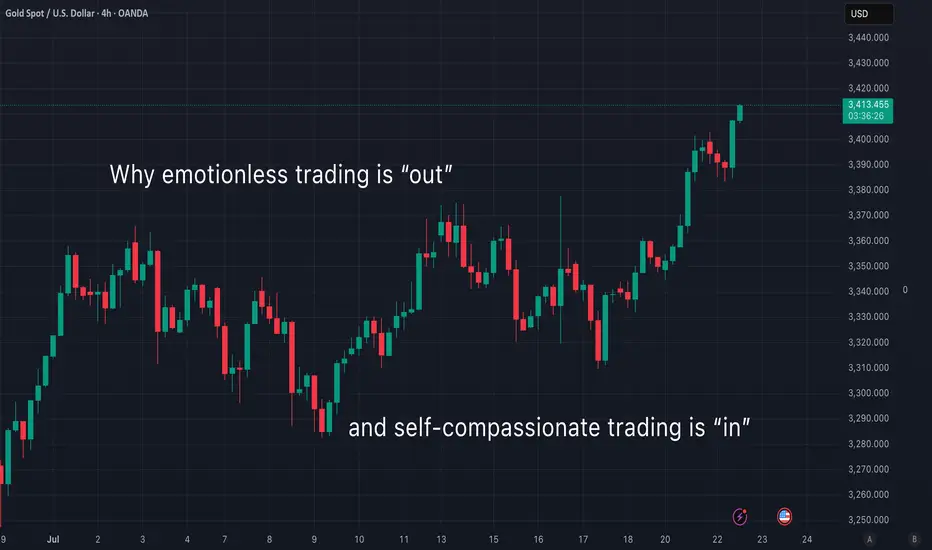
Why emotionless trading is out (and what to do instead)Curious about what self-compassionate trading really means?
Let’s do a little thought experiment together. Imagine you just closed a losing trade. You’re feeling disappointed and unmotivated. You invite two friends over to your home and tell them what happened. Which friend would you rather talk to?
🙋🏽♀️ Friend 1 says:
"What a failure you are. Why were you even stressed out? That’s so silly. Couldn’t you see this trade was going to be a loss? You should just give up—what’s the point of trying? I don’t understand how you could mess up the way you did. Let’s spend the afternoon going through everything you did wrong."
...Or would you prefer:
🙋🏽♀️ Friend 2 who says:
"I can see you’re feeling sad and disappointed about that last trade. I’m really sorry it didn’t go your way. But you know what? Losses are a part of trading—we all go through them. You’ll have another chance tomorrow. I can tell you’re doing your best. Let’s do something kind for ourselves today, and tomorrow you’ll get back to it. Don’t give up—I’m proud of you for chasing your dreams."
🤔 So, who would you choose?
I know this little experiment might sound a bit dramatic—but be honest, wouldn’t we all prefer Friend 2 ? And isn’t Friend 1 sounding suspiciously like that inner critic of yours?
For the longest time, trading advice has told us to "get rid of emotions" and stay completely “stress-free.” I wish it were that simple…
The truth is, trying to trade without emotions is like talking to yourself like Friend 1 . Not only is it impossible —it also builds a harsh, critical inner dialogue that damages both your confidence and motivation.
The reality is: we don’t have full control over our thoughts and emotions. They show up whether we want them to or not. If we could choose our emotional state, we’d all stay calm and focused every time we trade. But that’s not how the human mind works.
Instead of fighting our emotions, we can learn to open up to them—without judgment.
Self-compassionate trading means treating yourself like Friend 2 . It’s about acknowledging when things are tough, and being kind to yourself when stress or anxiety shows up. It’s about replacing harsh self-talk with encouragement, warmth and understanding.
👩🏽🔬 Some people think self-compassion is soft, ”girly”, or even “too emotional.” But guess what? It’s backed by tons of solid research. Studies show that self-compassion helps reduce self-criticism and improve motivation. It’s also an effective tool for managing tough emotions and reducing stress and anxiety.
Self-compassionate trading is a win-win approach—it helps you stay grounded and resilient while building a meaningful trading journey. So why not give it a try? 👇
💡 Pro Tip:
Next time you close a losing trade, find yourself in a losing streak, or just feel anxious about your performance—ask yourself:
“What would I say to a good friend who’s going through the same thing?”
Then offer that same kindness and support to yourself.
Happy (self-compassionate) trading! 💙
/ Tina the Trading Psychologist
SUPER BUY GOLD XAUUSD Gold has ripped all levels of take profit and has gone up and gave us a small amount of drawdown with huge gains in return, simple trading price action and (M&Ws)
XAU / USD 4 Hour ChartHello traders. We have news thins morning, we have Trump and Powell this afternoon. I am not trading the news, but I did mark the area we need to break out of. I can see this going either way. I will check back later. Be well and trade the trend. Beware the volatility and trade safely today. Big G gets a shout out.
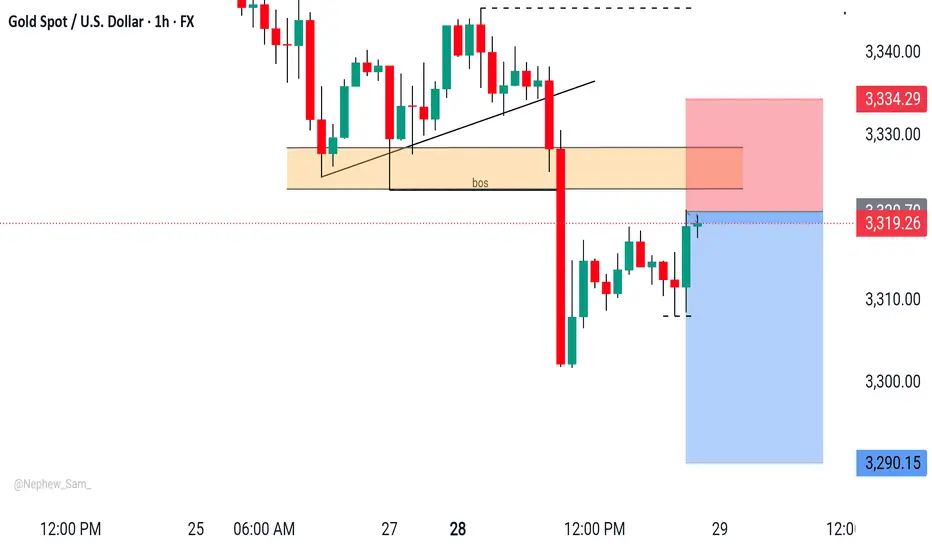
XAUUSD H1 Outlook XAUUSD - Smart Money in Play
Perfect CHoCH & BOS confirmation.
Price tapped into the supply zone — now rejecting hard.
Entry aligned.
Target: 3,290 ✅
Let it melt. 🧊📉

XAUUSD FULL WEEKLY STRUCTURE MAPHello traders! 🌟
We’re stepping into a pivotal week for gold (XAUUSD), and the weekly chart tells a story of tension, liquidity hunts, and potential big moves. Let’s dive into the three truly critical zones, backed by SMC/ICT logic, Fibonacci, EMAs, RSI, and fair‑value gaps — all in one elegant map. 🎨✨
🔹 HTF Overview & Macro Pulse
Current Price: 3336
Weekly Trend: Bullish overall, but momentum is fading as price coils under premium highs.
EMAs (5/21/50/200):
EMA5 & EMA21 are flattening beneath price, hinting at stall.
EMA50 sitting near 3120 as a deep support magnet.
RSI (Weekly): Cooling from ~75 down to ~66, showing bearish divergence vs those upper wicks.
Fair‑Value Gaps:
Unfilled 3365–3405 zone above — institutional imbalance still waiting.
Partially filled 3280–3320 below — common reaction pocket.
Fibonacci Extensions (1984 → 3365 high): 127.2% at 3405, 161.8% at 3439 — the exact top of our supply wick.
Macro Catalysts This Week
Wed (Jul 30): FOMC + Fed Statement
Thu (Jul 31): Core PCE + Unemployment Claims
Fri (Aug 1): NFP + ISM Manufacturing
Prepare for violent spikes into one of our zones — then trade the reaction.
🔸 The Three TRUE Weekly Zones
W1 Supply (Ultimate Wick Zone)
🔥 3350 – 3439
This entire wick from May–July is YOUR one and only supply zone on weekly.
Pure liquidity sweep area
Confluence: unfilled fair‑value gap, 127–161.8% Fib, RSI divergence
Every touch here is a short‑trap until we see a full weekly close above 3439.
W1 Demand (Primary Buy Zone)
🌊 3220 – 3285
The last robust order block & BOS base before gold ran vertical.
Confluence: filled FVG, weekly OB body, EMA21 target, RSI back at 50
Ideal sniper entry after a news‑driven sell‑off into this range.
Deep Discount Block
🛡️ 2960 – 3050
The origin of the full 2024–2025 bull trend — true institutional accumulation.
Confluence: March 2024 CHoCH base, EMA50/200 proximity, 78.6–88.6% Fib retrace
Only for a major quarterly reset; not on the immediate radar unless USD spikes dramatically.
🧭 Strategy & Execution
Short Bias: Wait for a liquidity spike into 3350–3439 (likely around FOMC/NFP), then watch for a clean rejection candle.
Long Bias: After a thrust down into 3220–3285, look for wick‑based rejection plus EMA21 hold and a bullish engulf on weekly.
Avoid the mid‑zone between 3285–3350 — that’s noise, not structure.
Patience is everything. Let price sweep, then let us strike. The real power trades this week will be born from clear structure — not guesswork.
💬 What’s your favorite zone to watch? Drop a comment below!
👍 Smash that like🚀🚀🚀 if you found this map helpful, and hit follow for more GoldFxMinds sniper blueprints.
Disclosure: Analysis based on Trade Nation’s TradingView feed. I’m part of their Influencer Program.
GoldFxMinds 💛

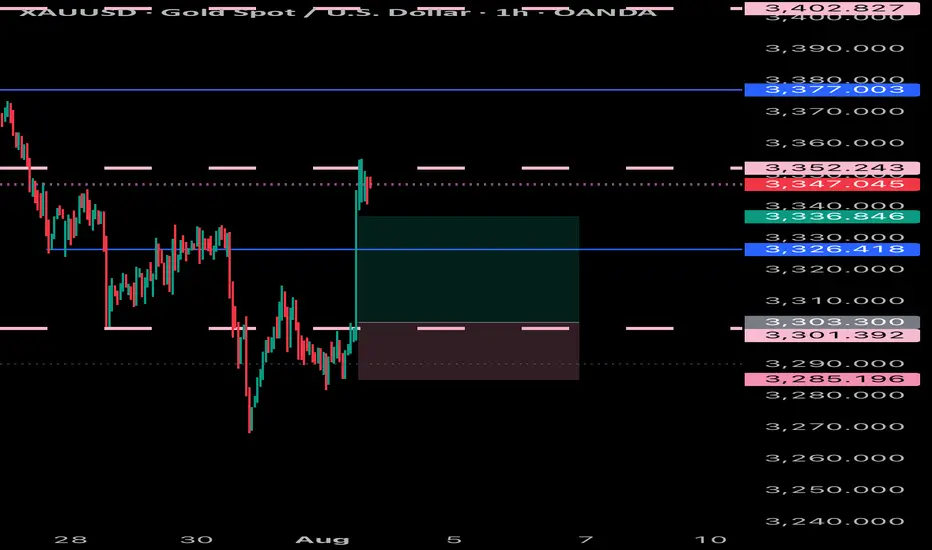
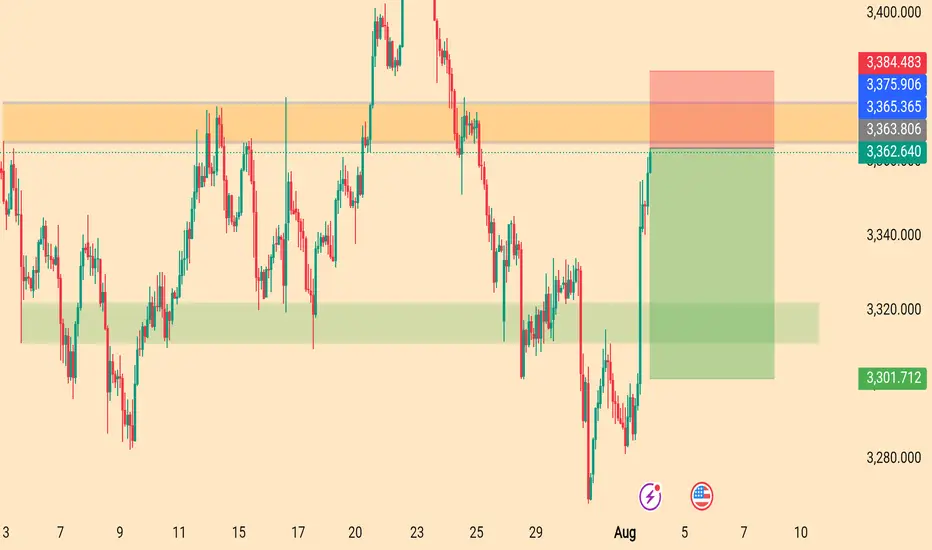
XAUUSD OUTLOOK BEARISH MOVE POSSIBLE 4/8/2025🔻 XAUUSD – Short-Term Bearish Bias
Key resistance at 3363–3370
Below this zone, expecting 3335 / 3325
Breakout failed – now watching for downside
#GoldAnalysis #XAUUSD #BearishStructure
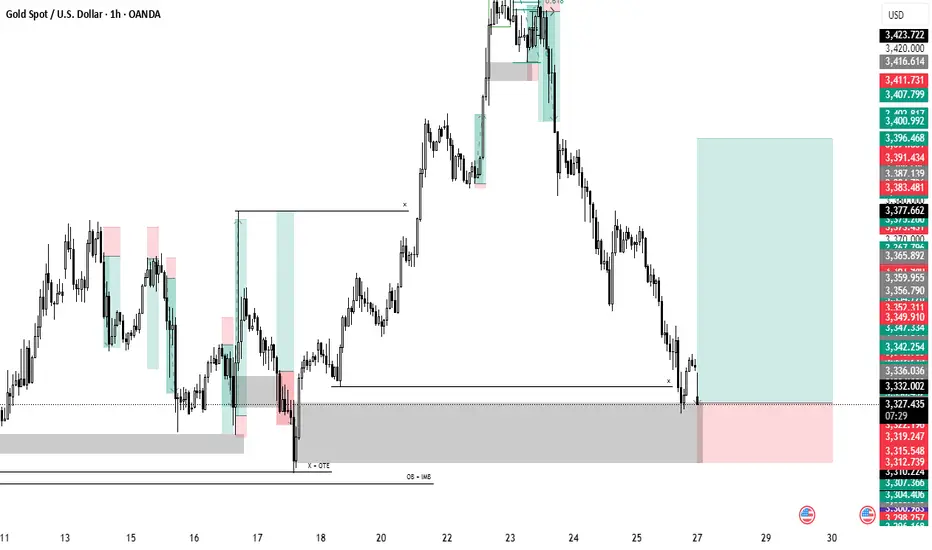
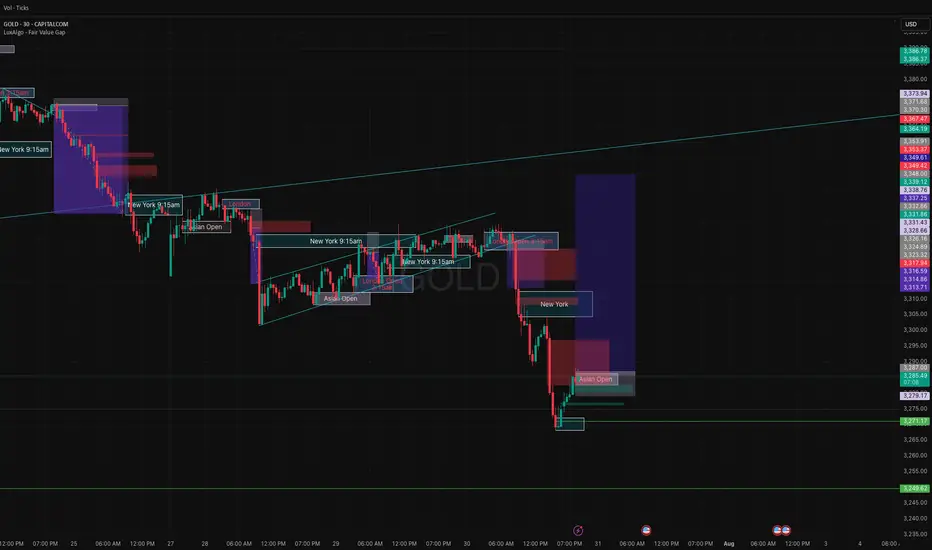
XAUUSD analysis - 1H FVG and OB setupsOn the 1H timeframe, price is currently approaching two key supply zones (OB 1H):
🔴 First OB zone: around 3354 – 3360
🔴 Second OB zone: around 3368 – 3370
We're watching these zones for potential short setups, only with confirmation on the lower timeframes (5M or 3M).
If price reacts to one of these OBs, we expect a move down toward the green 1H demand zone around 3280 – 3290, where a long setup may later form.
📌 Key scenarios:
1️⃣ Price hits the first OB → confirmation → short
2️⃣ Price moves to the second OB → confirmation → short
3️⃣ Target for both setups = green OB around 3280
4️⃣ No entry without confirmation from LTF
❗️ Do NOT enter without lower timeframe confirmation.

Gold OutlookI think Gold is about to do a minor recovery Pump , after days of Red, maybe we are about to see some relief green, this is my very first long trade
XAU / USD 4 Hour ChartHello traders. Here is a lower time frame analysis pertaining to the weekly that I recently posted. Area to watch is marked. It is the end of the month, things get tricky. Trade carefully. Be well and trade the trend. Shout out to Big G. Happy Wednesday.

Gold at intraday critical levelIf stays below 3308, Sell target 3257
If breaks above 3308 with significant H1 close, buy target 3334. Apply risk management to enjoy trading at its best.

XAUUSD Analysis TodayHello traders, this is a complete multiple timeframe analysis of this pair. We see could find significant trading opportunities as per analysis upon price action confirmation we may take this trade. Smash the like button if you find value in this analysis and drop a comment if you have any questions or let me know which pair to cover in my next analysis
