Technical Analysis - Gold (XAU/USD) - 4H ChartI’ve dissected the market using Elliott Wave theory and uncovered key signals that most overlook. Here's my breakdown:
## 📌 **Setup Overview*
I'm tracking a complex wave structure that hints at the final stage of a corrective pattern, setting the stage for a potential bullish rebound.
## 🎯 **Entry Strategy**
I’ve identified a prime buy zone around **3,350USD**—just above current market levels. This isn’t just a number—it's where price action and wave theory converge. High-probability setup with a tight stop. Above 3,380
## 🧭 **Projected Move**
While I’m eyeing short-term upside, the larger wave pattern suggests the potential for a deeper correction targeting the **3120.000 USD** area. I’m preparing for both scenarios to stay ahead of market sentiment.
---
GOLDCFD trade ideas

GOLD Melted , 2 Best Places To Sell Clear , Don`t Miss 200 Pips Here is My 30 Mins Gold Chart , and here is my opinion , we Again Below 3377.00 and we have a 30 Mins Candle closure below this strong res , so i`m waiting the price to go back and retest this res and new support and give me a good bearish price action to can enter a sell trade and we can targeting 200 pips , and we have a good res @ 3365.00 we can sell from it also if the price didn`t reach 3377.00 and targeting from 100:200 pips , and if we have a Daily Closure below This res this will increase the reasons for us , just wait the price to back a little to retest it and then we can sell it . if we have a daily closure aboveit this idea will not be valid anymore .

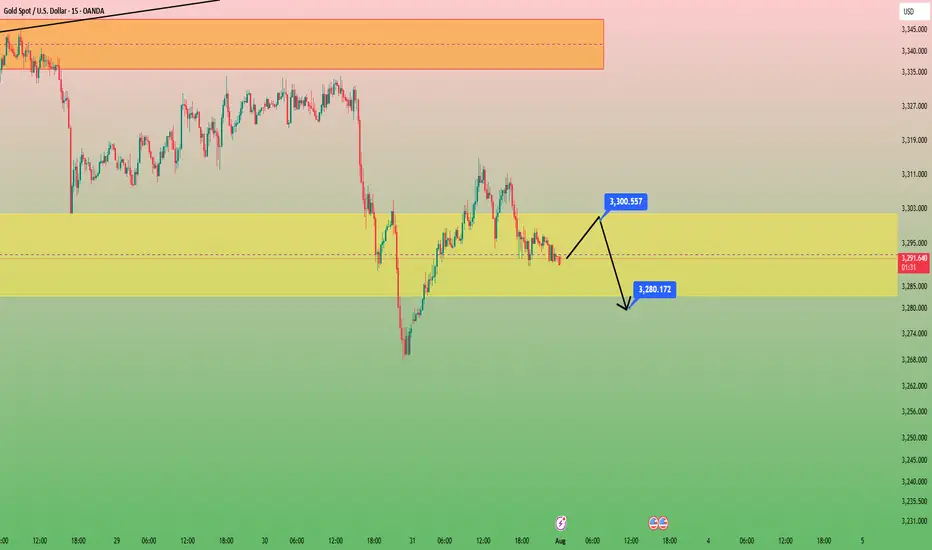
GOLD in 15minHello to all traders. 😎😎
I hope all your deals will hit their targets. 🎉🎉
After yesterday's heavy drop on the last day of July. We had a weak growth.
I think the price will retest $3300 and we will have another drop to the $3280 area. Look for short positions in the $3300 area.
Remember that this is an analysis and be sure to do money management when trading.
What Do You Think?
Which scenario do you think is happen? **Share your thoughts!** ⬇️
Don't forget that this is just an analysis to give you an idea and trade with your own strategy. And don't forget the stop loss🛑🛑🛑
❤️❤️❤️The only friend you have in financial markets is your stop loss❤️❤️❤️
Please support me with your ✅' like'✅ and comments to motivate me to share more analysis with you and share your opinion about the possible trend of this chart with me 🙏😊
Be Happy , Ali Jamali
XAUUSD Update CONSOLIDATIONAfter bullish rejection, Gold make a new lower and break 3283 support level.
Now it seemslike bounce to make a correction and retest 3305 resistance.
If 3305 reject, price will continue moving downside and retest 3245 support.
If it break 3245...it will continue to find it support, near 3205 support zone.
Have a blessing day !

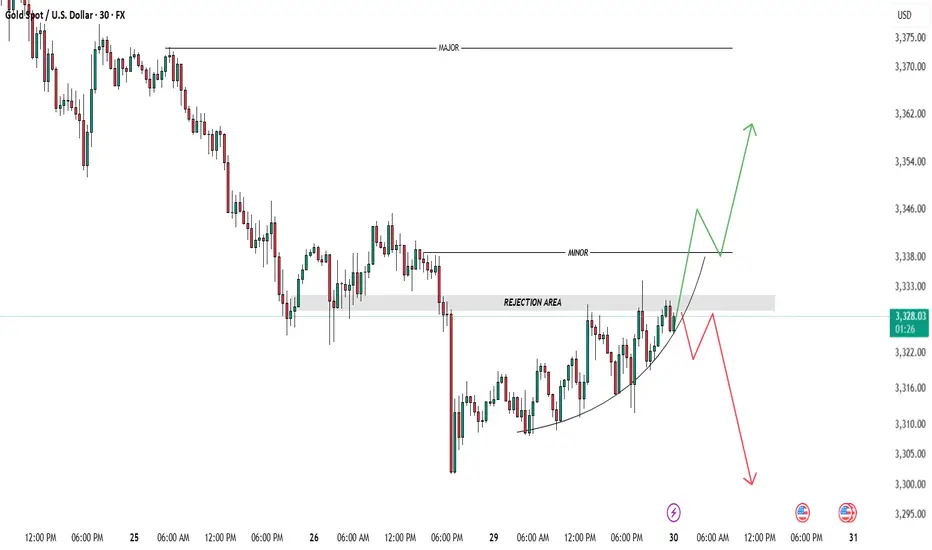
GOLD -Key Levels-Wait for Confirmation!Gold (XAUUSD) is now testing a critical Rejection Area 📍 (around 3,328–3,333), right beneath a minor CHOCH zone. This is a key decision level, and I'm just waiting for price to show its intrest – no early entries here. ⚠️
🔼 Bullish Scenario:
Price fails to hold above minor CHOCH ✅
Comes back to retest the Rejection Area as support 🧱
If we get a clean bounce + confirmation, I’ll look for buys toward 3,346 → 3,360 🎯
🔽 Bearish Scenario:
Price rejects from minor CHOCH ❌
Gives strong bearish confirmation 🔻
Then retests the Rejection Area as resistance 🚫
That’s my cue to short toward 3,310 → 3,295 📉
NOTE: possibility is that market take all liquidity from sell side. Avoid Taking any trade untill setup is clean.
Being patient here. Confirmation is everything! Let’s see🔍💡
Avoid Mid-Zone Entries!
XAUUSD 4H | Clean break & retest | Bearish "XAUUSD 4H | Clean break & retest ✅ Bears stepping in at supply zone, targeting next demand area below. 🏹
Entry: 3331 | SL: 3348 | TP: 3246"

How to seize the key turning points in the gold market?The market is ever-changing, and following the trend is the best strategy. When the trend emerges, jump in; don't buy against it, or you'll suffer. Remember not to act on impulse when trading. The market is a haven for all kinds of resistance, so don't hold onto positions. I'm sure many people have experienced this: the more you hold onto positions, the more panic you become, leading to ever-increasing losses, poor sleep, and missed opportunities. If you share these concerns, why not try following Tian Haoyang's lead and see if it can open your eyes? I'm always here for you if you need help, but how can I help you if you don't even offer a hand?
Gold did not fall below 3280 during the day on Friday and started to fluctuate in the range of 3280-3300. The non-farm payroll data was bullish, and it directly broke through the pressure of 3315, and then broke through the important pressure of 3335 again. As of now, it has reached a high near 3355. The non-farm payroll data market has almost been exhausted. Next, we will focus on the technical form adjustment. At present, you can consider light shorting in the area near 3355-3370. After all, chasing long is risky, and the technical side needs to be adjusted. If your current operation is not ideal, I hope I can help you avoid detours in your investment. Welcome to communicate with me.
Based on the 4-hour chart, short-term resistance is near 3355-3365, with a focus on the key resistance level of 3370-3375. Short-term buy orders should be taken if a rebound continues. I'll provide detailed trading strategies at the bottom of the page, so stay tuned.
Gold operation strategy: Short gold in batches when gold rebounds to 3355-3370, with the target being the area around 3340-3335. Continue to hold if it breaks through.
XAUUSD Long SetupXAUUSD has shown good sign on the zone and possible movement has been shown in the analysis. Consider it take the setup with keeping your risk management in consideration.
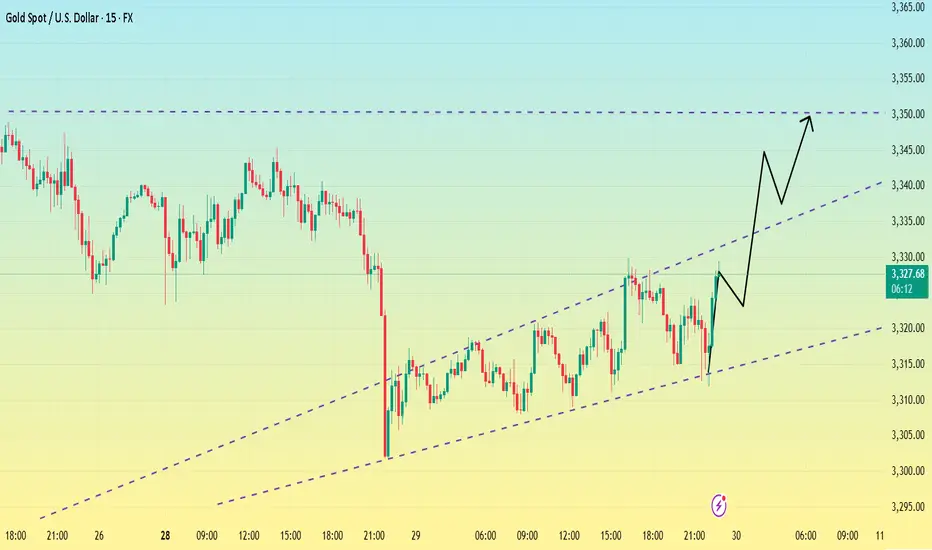
Gold Bullish trend h1 chart target Now full bullish
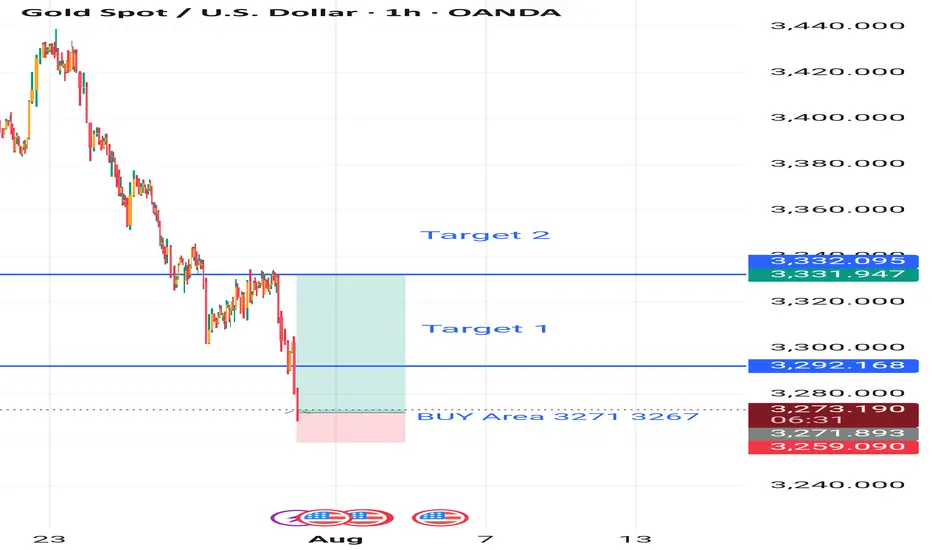
Gold buy from 3271
3267 sl 3259 target 3338 don't miss trade best of luck 🤞
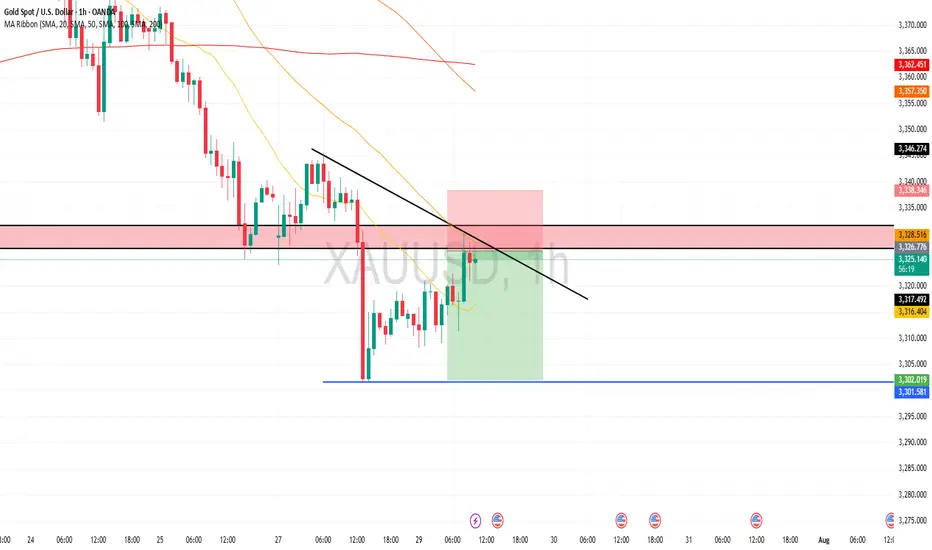
Bottoming out? Be wary of the market.After a sharp drop to around 3300 on Monday, gold rebounded, reaching a high of around 3330 so far.
From the 1-hour chart,Gold has now broken out and stabilized within the hourly chart's downward trend channel. The key upward level is currently around 3330. If it breaks above 3330 again, caution is advised; it may test 3345-3350. Conversely, if it fails to break above 3330, gold may consolidate between 3300-3330 before the non-farm payrolls release.
From a short-term 15-minute perspective, the current 15-minute range has been broken out and stabilized. The current situation is unfavorable for bears. Based on the trend, a breakout above the 15-minute range would indicate a rebound. However, until 3330 holds, the 3320-3330 range is the only option. However, the current trend favors a bullish pullback, so I'm not too keen on shorting. Therefore, focus on support at 3320.
If it fails to break below 3320, enter a long position near 3320. The upper target is the top of the 3345-3350 range.
Excellent Profit on my Selling ordersAs discussed throughout my Friday's session commentary: "My position: I am Highly satisfied with recent results and will take early weekend break (no need to Trade more). If however you decide to Trade today, Sell every High's on Gold / no Buying until Monday's session (my practical suggestion)."
I have successfully re-Sold Gold from #3,338.80 with set of Selling orders, first batch I have closed around #3,327.80 Support for the fractal and second batch on #3,320.80 / another Support in extension / Highly satisfied with my Profits. I was aware that if Gold invalidates #3,318.80 Support / #3,310.80 extension can follow my Profit was already great to allow myself to Risk more which can backfire anytime.
Technical analysis: Not a bad start of the Trading week overall as the Price-action followed yesterday's session Gravestone Doji reversal formation into series of Bearish Hourly 4 chart’s candles, Gold is settling for a new Higher Low’s within former Hourly 4 chart’s Descending Channel. Despite this, the Weekly (#1W) candle remains on a (# -1.83%) and mostly Bearish values on my instruments. Daily chart continues to pile heavy Selling pressure on Gold so Technically my Short positions will see their value. The current Price-action is exactly on the Higher Low’s Upper zone as there is significantly more potential on the downside and as a results I do expect #3,300.80 psychological benchmark test as current decline is directly correlated with uptrend extension on DX (# +1.03%) and will most likely close the week in green values.
My position: I will continue re-Sells starting with #3,332.80 Resistance and my continuation will be re-Sell every High's on Gold unless Gold closes the market above #3,352.80 benchmark.

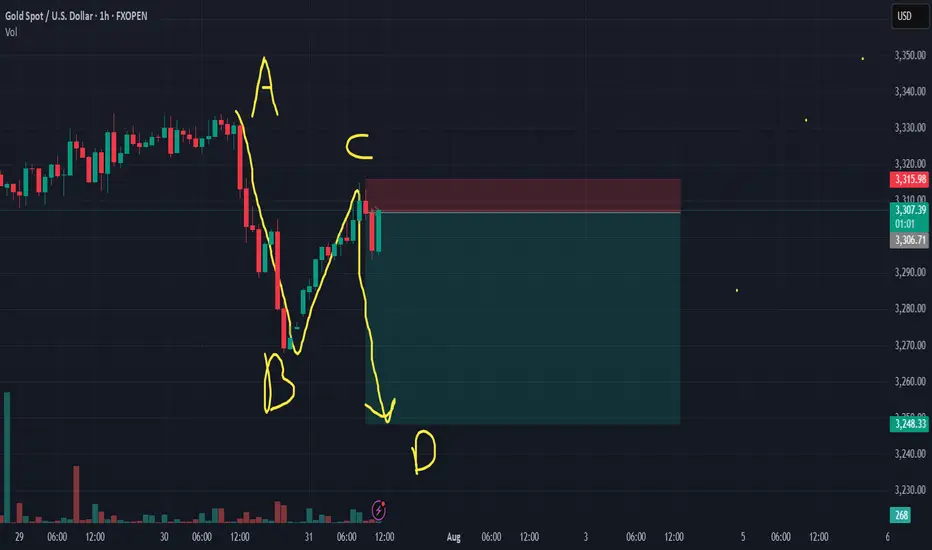
Gold Exhausted it Self Trying To take liquidity From The ATHFOREXCOM:XAUUSD
I'd Wait for a Retest On 3.333 For a short With That We have to confirm That the OB on 3.269 breaks With a Good 4h candle, we can Target 3.200 going From there

GOLD for short timeCaption important🛑🛑🛑
Hello to all traders. 😎😎
I hope all your deals will hit their targets. 🎉🎉
Gold has broken a key trendline on the 4H chart, and I believe the bearish move could continue today, potentially down to at least $3300.
My expectation is that price will first reach the $3335–$3340 zone. From there, you can look for a good short opportunity, with a suggested stop-loss at $3355.
If you’re willing to take on more risk, you could consider opening a short position from the current level around $3325, using a reasonable position size.
Personally, I prefer to wait for price to reach the orange zone ($3335) and enter a solid short position from there.
What Do You Think?
Which scenario do you think is more likely to happen? **Share your thoughts!** ⬇️
Don't forget that this is just an analysis to give you an idea and trade with your own strategy. And don't forget the stop loss🛑🛑🛑
❤️❤️❤️The only friend you have in financial markets is your stop loss❤️❤️❤️
Please support me with your ✅' like'✅ and comments to motivate me to share more analysis with you and share your opinion about the possible trend of this chart with me 🙏😊
Be Happy , Ali Jamali

Gold is in the Bearish Direction after Breaking SupportHello Traders
In This Chart GOLD HOURLY Forex Forecast By FOREX PLANET
today Gold analysis 👆
🟢This Chart includes_ (GOLD market update)
🟢What is The Next Opportunity on GOLD Market
🟢how to Enter to the Valid Entry With Assurance Profit
This CHART is For Trader's that Want to Improve Their Technical Analysis Skills and Their Trading By Understanding How To Analyze The Market Using Multiple Timeframes and Understanding The Bigger Picture on the Charts
XAUUSD Eyeing Liquidity Grab – M30 OB Zone in PlayPrice is respecting the ascending trendline and consolidating near a key resistance level. A bullish breakout is expected, with a potential retest of the trendline and the M30 Order Block (OB) zone acting as a key demand area.
📈 Trade Plan:
Wait for a minor pullback into the OB and trendline confluence
Look for bullish confirmation to go long
Target the liquidity zone above (around 3347)
📌 A clean structure and bullish order flow hint at a continuation to the upside.

Daily gold analysisDaily gold analysis
A long position with the target and stop loss as shown in the chart
The trend is up, we may see more upside
All the best, I hope for your participation in the analysis, and for any inquiries, please send in the comments.
He gave a signal from the strongest areas of entry, special recommendations, with a success rate of 95%, for any inquiry or request for analysis, contact me

GOLD Possible Scenario Gold break the Major support but the price didnot pullback so aggressively and buyers have reduced looks like it will likely go down to 3300-3280 range. the major sell point will be 3355-3360.

XAUUSD Analysis todayHello traders, this is a complete multiple timeframe analysis of this pair. We see could find significant trading opportunities as per analysis upon price action confirmation we may take this trade. Smash the like button if you find value in this analysis and drop a comment if you have any questions or let me know which pair to cover in my next analysis.

XAUUSD
XAUUSD Updated in 15M :
The gold signal is marked on the chart based on the latest price changes and the supply and demand in the market. These points include the entry point, stop loss, and take profit.
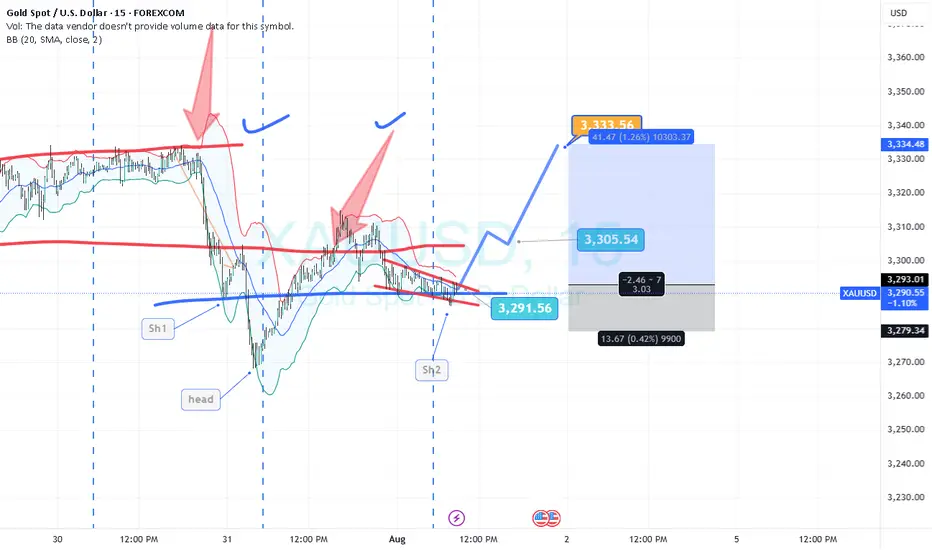
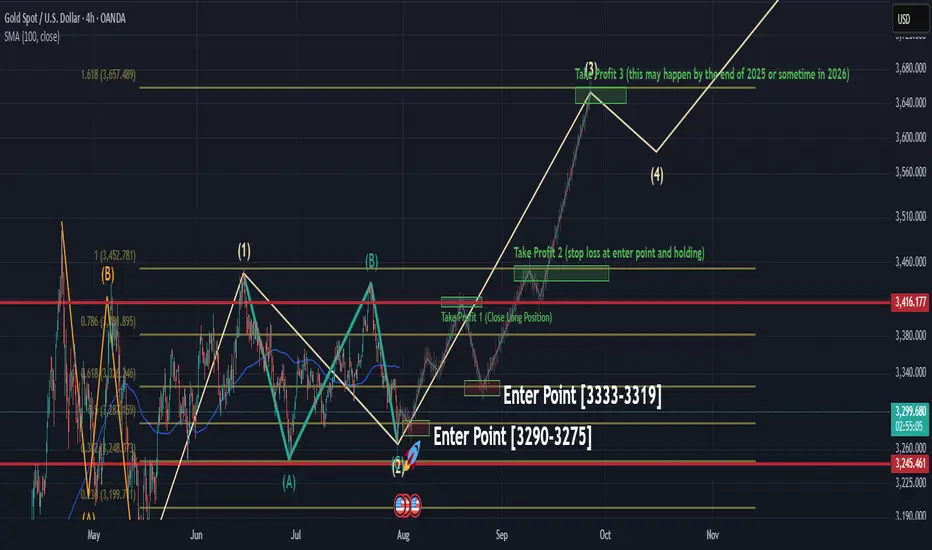
Roadmap to 3982: Key Long Entries and Profit ZonesThe initial long entry zone is between 3290 and 3275 .
From this range, an uptrend is expected to begin, targeting 3416 , which is our first exit point to close the initial long position.
After that, we wait for the next long entry , ideally around 3333 to 3319 . A new upward movement from this range is expected to reach 3455 . At this level, we continue to hold the position while placing the stop loss at the entry level to protect profits.
The next take profit target is 3650 , which may be reached by the end of 2025 or in 2026.
The final target is 3982 , which is likely to be hit in 2026, as the market may not have enough strength to reach it in 2025.
XAUUSD SELLING CONTINUATIONXAUUSD had a constitutional impulsive move and is about to take a sharp fall
