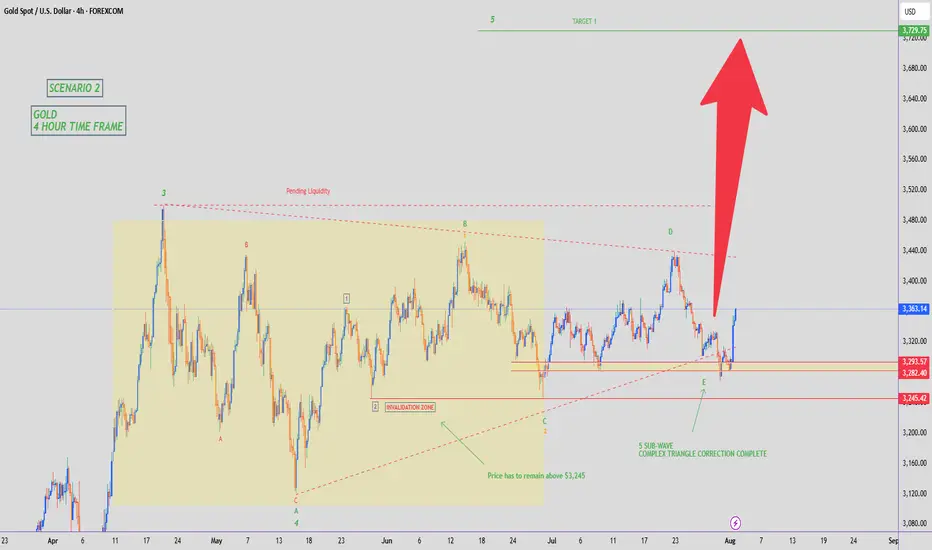
GOLD - WAVE 5 BULLISH TO $3,734 (UPDATE)As I said on our last update, this 'Gold Bullish Scenario' remains valid as price has still failed to close below $3,245 (Wave 2) low.
As long as Gold remains above Wave 2 high ($3,245), this Gold bullish bias remains an option. As traders we always have to be prepared to adapt to different market conditions.
GOLDCFD trade ideas
XAUUSD
XAUUSD Updated in H1 :
The gold signal is marked on the chart based on the latest price changes and the supply and demand in the market. These points include the entry point, stop loss, and take profit
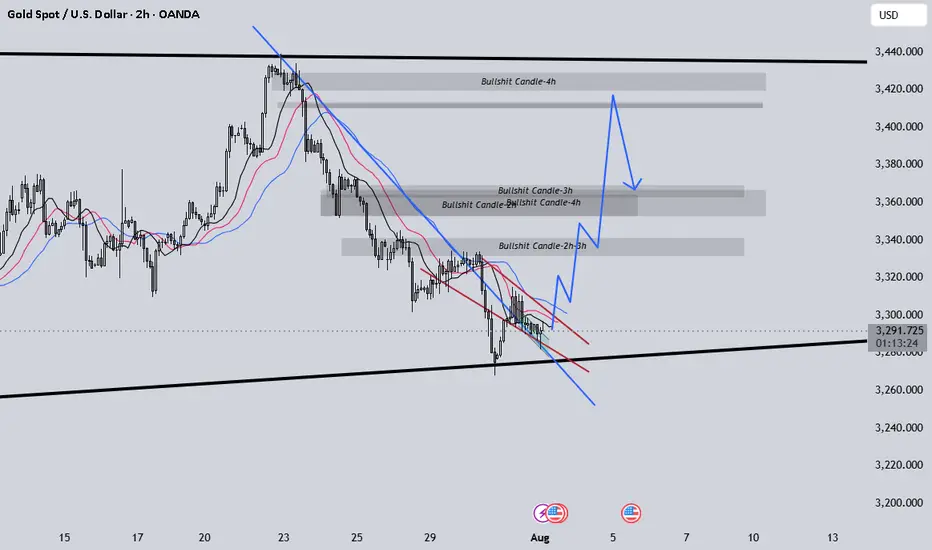
I maintain my #3,277.80 and #3,252.80 TargetsI didn't engaged any re-Sell orders throughout yesterday's session and re-Sold Gold on #3,295.80 ahead of Asian session, with plan to keep orders over-night. However due NFP, Gold might be stationary / ranging until the news as I closed both of my orders on #3,291.80 / each #9.000 Eur Profit and my #3,300.80 pending Sell limit has been triggered over-night which is now running in Profits with Stop on breakeven. I do expect #3,277.80 and #3,252.80 Targets to be met within #1 - #3 sessions and if there aren't NFP numbers, I would keep all three orders / set of Selling orders maintaining my first #3,277.80 Target. Due the news, Gold might fluctuate within Neutral Rectangle until the news.
Technical analysis: My earlier Selling configuration / Technical expectations was confirmed on Hourly 4 chart under prolonged weakness and Price-action respecting the trend-line guarding the downtrend (very Bearish formation) as Hourly 1 chart is already an aggressive Descending Channel (width opened on Williams) that should reach it’s next local Low’s (currently Trading slightly below Double Bottom) and Oversold state near my take Profit of #3,252.80 benchmark. If the bands are widened Traders may witness #3,277.80 test, also if gets invalidated and #3,270.80 gives away, #3,252.80 mark extension test is inevitable. In any case I will update my Targets or levels of Profit taking if I decide to exit earlier than #3,252.80 benchmark to be in accordance with the Daily chart’s period / I already ride Selling wave since #,3,300's and my Profit will be already good to ignore.
My position: DX is soaring, Gold is under Bearish Technical developments and #3,252.80 benchmark is my final Target of current Selling leg. Only factor which can reverse this Intra-day but not postpone is NFP. I expect downside Jobs surprise which may reverse DX from local High's however hot upside surprise will make Gold test #3,252.80 Intra-day. NFP or not I do believe Gold is Bearish. Trade accordingly.
Direct Buy In Gold : Coming Currently gold is trading under falling wedge pattern which will explode soon once volume will come . Buying here is good idea imao
XAUUSD: BUYThere are some good trading opportunities in the market. That's when to buy. Gold prices haven't fallen further since falling back to 3390. There's no further negative news. Therefore, there won't be a significant short-term decline. Our focus will be on tomorrow's non-farm payroll data update. This is a crucial factor that can cause gold prices to rise or fall significantly in the short term.
I'll update you with real-time buy and sell opportunities. This is based on research from the Swing Trading Center. It's highly authoritative. Don't miss out! Remember to stay tuned.
XAUUSD: BUY 3292-3282 TP 3320. SL 3265

Gold is faking a bullish trapWe are gonna go down to the 3294 level before we see a bounce up. The 3294 level is gonna show up as a strong support to push trough the 3345 area.
Xauusd sell to buy ideaThere is going to be more sells all the way down to the support zone before a big buy to ALL TIME HIGH let's anticipate

Gold remains below trend line ahead of FOMCAhead of today's US GDP and FOMC policy decision, gold was trading little-changed. The metal has breached its 2025 bullish trendline, which was positioned in the $3,330–$3,350 area. This breakdown shifts the technical outlook to mildly bearish, although further downside confirmation is needed through the loss of additional support levels to solidify bearish control.
From a bullish standpoint, the metal must reclaim and hold above the broken trendline to reignite upward momentum. However, the longer it remains below the $3,330–$3,350 zone, the greater the likelihood of a short-term correction—particularly if the immediate support at $3,300 fails. A break below this level would expose the June low at $3,247 as the next significant support.
By Fawad Razaqzada, market analyst with FOREX.com
On the upside, resistance is now stacked at $3,350, $3,385, and $3,430
7/30: Watch for Sell Opportunities in the 3352–3363 ZoneGood morning, everyone!
After a period of consolidation and decline, gold has found preliminary support near the 3300 level, and early signs of a bottom formation are emerging. The key technical level now lies around the 3332–3337 resistance zone. Based on current price structure, a breakout is likely, with major resistance seen at 3352–3358, while 3323–3316 serves as the primary support range.
However, caution is warranted as today’s ADP employment data may significantly influence short-term price action. Whether gold can hold above the 3337–3343 level depends on the data's impact.
From a broader perspective:
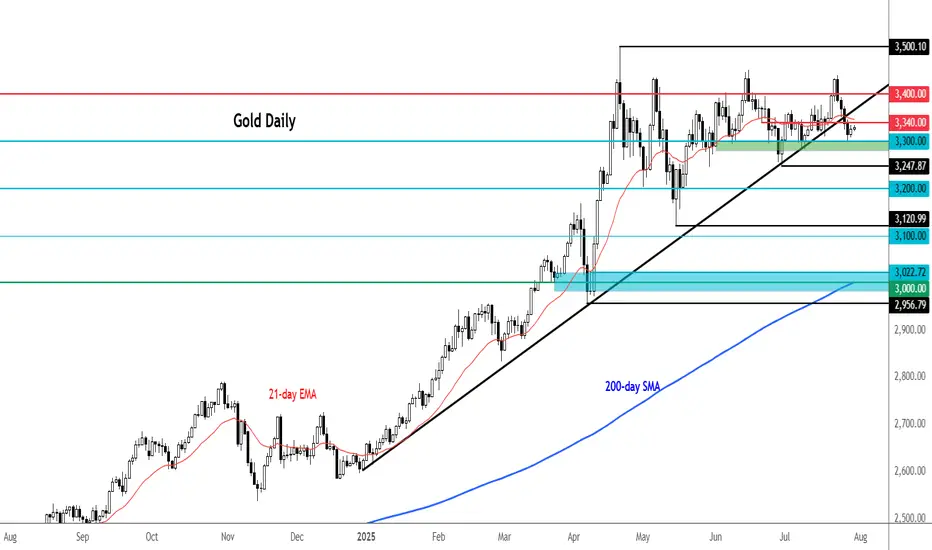
On the weekly chart, the 20-period moving average (MA20) has climbed to around 3276, yet the overall structure remains bearish for bulls
On the daily chart, gold is still trading below the MA60, facing notable resistance
This week's key events — ADP (Wednesday), jobless claims, and NFP (Thursday and Friday) — will likely shape gold’s medium-term trend
Trading Strategy for Today:
Focus on the 3313–3353 trading range, and be highly responsive to data-driven volatility.
Important note: If gold rises to 3343–3358 before the ADP release, then regardless of whether the data is bullish or bearish, the preferred approach is to sell into strength, as a post-data pullback is a likely scenario.

XAUUSD – TCB Strategy Setup✅ TCB Strategy Analysis
Trend Phase
HTF Bias: Recently shifted from bearish to potential bullish — clear breakout from descending channel.
Current Structure: Price has broken above channel and retested former structure resistance (~3325) as support.
Bias: Bullish continuation forming.
🚨 XAUUSD – TCB Strategy Setup (EP1 Active, EP2 Pending) 💥
Price just broke out of the descending channel and is now forming a solid base above the 3325 zone.
✅ EP1 (Pullback Buy) already triggered after price retested support.
📍 EP2 will activate on clean breakout + retest of 3330 zone.
🎯 Targets:
• TP1: 3348
• TP2: 3356–3360
If price loses 3325 structure, we reassess. For now, I’m bullish while structure holds.
This setup aligns 100% with the TCB Strategy:
Trend Phase: Bullish structure forming
Countertrend: Liquidity sweep + reclaim
Breakout Phase: Incoming on 3330 retest
🧠 Flow with structure, not emotion.
💬 Drop your comment if you're trading Gold too.
#TCBFlow #XAUUSD #GoldAnalysis #SmartMoney #BreakoutTrading #FlowWithTCB
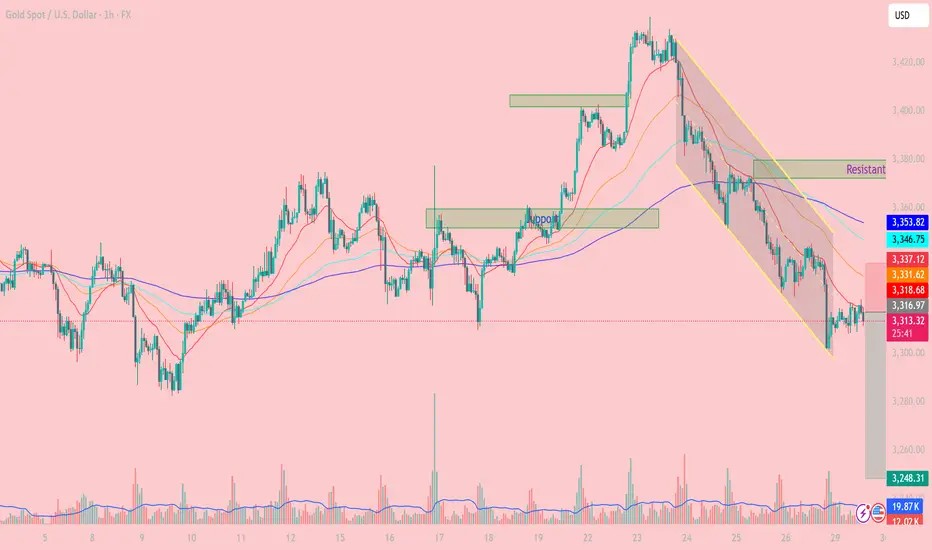
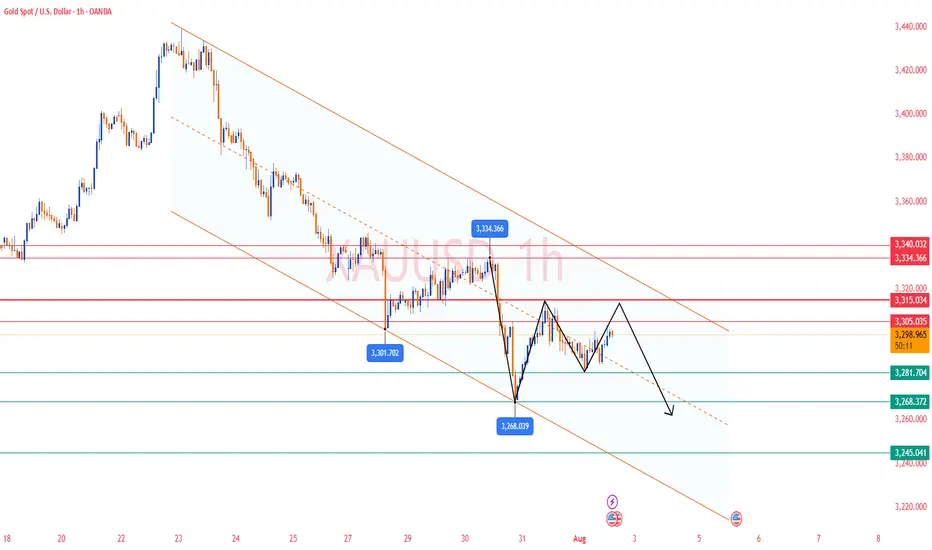
Downward Pressure Resumes After Channel BreakdownXAUUSD OANDA:XAUUSD – Downward Pressure Resumes After Channel Breakdown: Key Levels and Strategy for Today
As of the July 29 session, gold (XAUUSD) remains under short-term bearish pressure, having broken below the descending price channel on the 1H timeframe. The market structure confirms a dominant bearish trend as price continues to trade below the EMAs cluster.
1. Price Action and Market Behavior
XAUUSD is forming a clear sequence of lower highs and lower lows, confirming a short-term downtrend.
Price is currently hovering around $3,316 after breaking below the lower boundary of the channel, signaling potential continuation of the sell-off.
2. Key Resistance and Support Levels
Immediate resistance: 3,337 – 3,346 USD (aligned with EMA20, EMA50 and prior channel resistance).
Major resistance: 3,378 – 3,385 USD (confluence of Fibo and former high).
Near-term support: 3,300 USD (psychological level).
Major support: 3,248 USD (projected target based on measured move from channel height).
3. Technical Indicators
EMA20 and EMA50 are both below EMA200, forming a classic “death cross” – a strong bearish signal.
Volume increased on the breakdown, reinforcing the strength of bearish momentum.
RSI remains below 50, indicating weak bullish retracements and room for further downside.
4. Trading Strategy
Primary Strategy: Sell on Rally
Ideal entry zone: 3,331 – 3,346 USD.
Stop Loss: Above 3,353 USD (above key resistance zone).
TP1: 3,300 USD.
TP2: 3,248 USD (extended target based on breakout structure).
Alternative Strategy: Countertrend Long
Only consider buy setups if strong reversal candles and bullish RSI divergence appear near 3,248 USD.
XAUUSD continues to face downside risk after the channel breakdown. Unless bulls reclaim the 3,337 – 3,346 zone, price is more likely to drift lower toward 3,300 and potentially 3,248. Traders should remain patient and wait for clean setups around these key zones.
Follow for more strategies and remember to save this post if you found it helpful.
Let me know if you'd like a short version for the TradingView caption or hashtags suggestion.
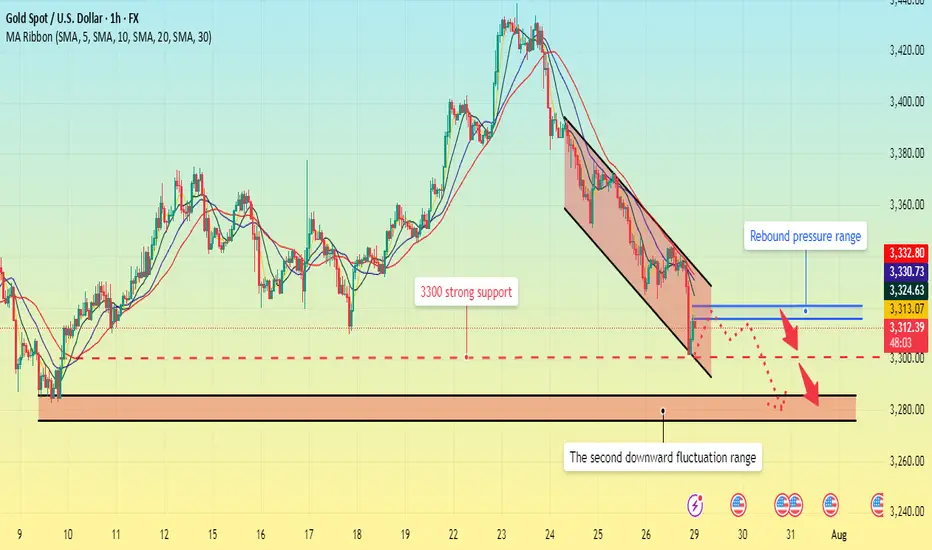
Gold fell below support. What will be the subsequent trend?The 1-hour moving average of gold continues to show a downward short position, indicating that the downward momentum is still sufficient; the wave pattern of gold's current decline remains intact, but the rebound strength is very weak, showing an obvious short trend of gold. Moreover, when gold rebounded in the short term, obvious resistance began to form above 3320, and the upward momentum was slightly insufficient.
From the daily chart, before 3300 fails to fall, it is likely to fluctuate around 3300-3350. On the contrary, if it falls below 3300, it is likely to reach the bottom of the 3385-3375 range.
This week is a super data week. The data of each day may affect the trend of gold on that day, but it will not form a unilateral strong trend. Therefore, the volatility before and after the data is released is likely to be large, so traders should focus on the following data:
1. US ADP employment report, US second quarter GDP preliminary value;
2. Federal Reserve interest rate decision;
3. US PCE annual rate, monthly rate;
4. The last trading day of this week will usher in non-agricultural data.
Institutional Footprint Detected Gold Hits FVG + Breaker Block.GOLD has now entered a significant confluence zone, aligning with both a bullish Fair Value Gap (FVG) and a breaker block areas commonly respected by institutional algorithms. In the process, it has also swept sell-side liquidity resting below recent lows, which often serves as fuel for a reversal. This combination of technical factors suggests a high-probability scenario for a bullish bounce from this region.
Traders should closely monitor price behavior around the marked Equal Relative Liquidity (ERL) zone for additional confirmation before executing any trades.
Always conduct your own analysis (DYOR) and manage risk accordingly.

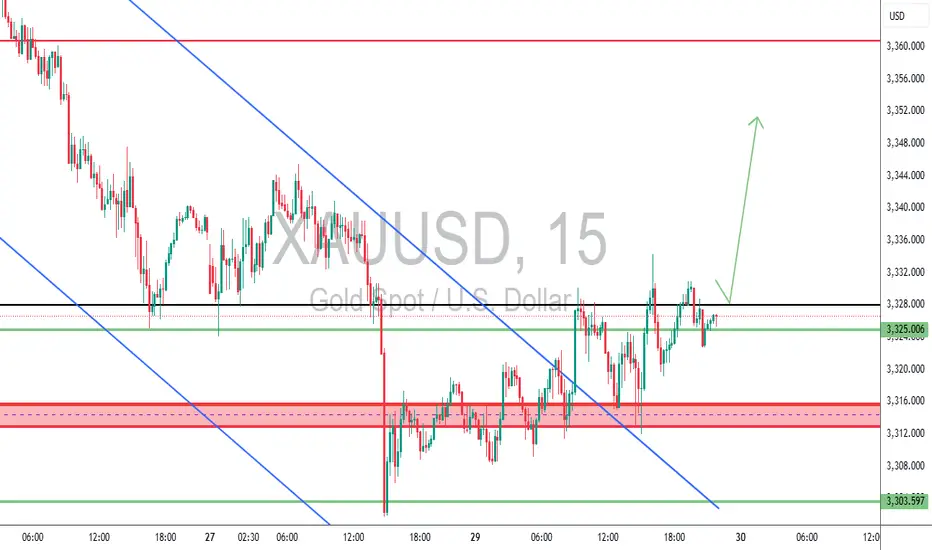
XAUUSD 4HOUR TIME FRAME ANALYSISOn the 4-hour chart, XAUUSD has recently pulled back into a well‐defined demand zone just above 3 330, offering a low-risk entry around 3 338. Here’s how the setup looks:
Trend Context
• Over the past week, gold has carved out a gentle up-slope, tracing higher highs and higher lows from 3 300 up toward 3 395.
• Price dipped back to test the rising 50-period moving average.
Key Levels
• Entry (3 338): Aligns with the confluence of the 50-period MA and a horizontal support zone (3 330–3 340), where buyers staged a rally earlier in the week.
• Stop-Loss (3 307): Placed just beneath the swing low at 3 315 and below the trendline connecting the last two higher lows—giving room for noise while protecting against a deeper reversal.
Momentum & Oscillators
• RSI (14): Currently around 45, rising from the 40 region. This suggests bearish exhaustion is waning and room remains before overbought conditions.

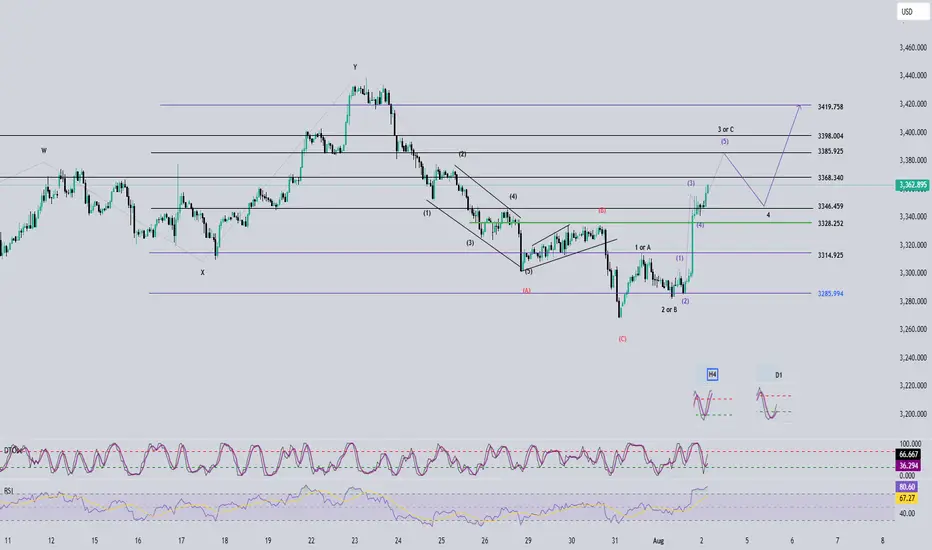
Elliott Wave Analysis – XAUUSD, August 4, 2025📊
🔍 Momentum Analysis:
D1 Timeframe: Momentum continues to rise strongly. It's expected that the price will keep rising for at least two more trading days, pushing the momentum indicator into the overbought territory, reinforcing the current bullish trend.
H4 Timeframe: Momentum is showing signs of a potential bearish reversal, indicating a possible corrective pullback during Monday’s trading session.
H1 Timeframe: Momentum is strongly bullish, especially evident from the powerful upward move on Friday. Price may continue rising at the open of the Asian session, potentially creating a Gap. However, caution is advised, as this Gap could signal exhaustion.
📌 Wave Pattern Analysis:
Given Friday's strong price action, the primary scenario currently favors wave 3 within the 5-wave bullish structure (12345 – black). However, we cannot entirely eliminate the possibility that this is wave C within an ABC corrective structure (black).
Presently, the price is forming a smaller 5-wave bullish structure (blue), likely in the final wave 5. Attention should be paid to two critical target zones:
🎯 Blue Wave 5 Targets:
• Target 1: 3368
• Target 2: 3385
⚠️ Next Scenario:
Upon completing the blue 5-wave structure, a corrective move downward will occur.
• If the correction does not break below 3315, the larger 5-wave bullish structure (12345 – black) is confirmed, and the price will continue upward to complete black wave 5.
• If the correction breaks below 3315, the structure shifts to an ABC corrective pattern (black), increasing the likelihood of a deeper decline to complete the larger corrective wave C (red).
🧩 Combining Momentum & Wave Analysis:
• D1 momentum strongly supports the continuation of the bullish trend.
• H4 momentum forecasts a short-term bearish correction on Monday, aligning with the formation of wave 4 correction.
• H1 momentum suggests the possibility of a Gap at Monday's Asian session open, marking the beginning of a corrective pullback as momentum reverses.
🎯 Short-term Trading Plan:
We will trade the current blue wave 5 with the following limit order plan:
✅ Sell Limit Zone: 3385 – 3387
⛔️ Stop Loss (SL): 3399
🎯 Take Profit (TP1): 3368
🎯 Take Profit (TP2): 3355
📌 Note:
The detailed trading plan for capturing the larger wave 4 correction (black) will be updated once sufficient evidence confirms the completion of the blue wave 5.
Happy trading, everyone! 🚀
Go long on gold at low prices, targeting above 3400.Go long on gold at low prices, targeting above 3400.
Gold 4-Hour Chart:
As shown in the chart, from a macroeconomic perspective, despite the rise in gold prices, it remains trapped within a trend channel.
Currently, gold prices are under pressure in the 3370-3380 range.
On Friday, driven by risk aversion, gold prices briefly rose to $3363. With the Federal Reserve resuming its rate hikes over the weekend, expectations for a September rate hike have risen to 80%.
The most robust strategy for gold prices next week: enter long at low prices and manage your position accordingly.
Going long at current prices is not recommended. Instead, watch for potential declines due to profit-taking after the price dips.
Upward resistance lies near 3370 and 3380, where previous reversals occurred.
Every waterfall pattern offers a buying opportunity on the decline.
Although gold is currently strong, if we are bullish, we should not chase the gains. Simply wait patiently for prices to fall back to lower levels before going long.
Short-term intraday trend
Upside focus: Resistance at 3372-3385
Downside focus: Support at 3345-3340 and 3315-3320.
Gold Strategy:
1: Buy on the first dip into the 3338-3343 range, with a small stop-loss and a target price of 3370-3380.
2: Go long at low prices and control position size. This is definitely the most stable trading strategy. Patiently maintain a swing strategy. Target 3400+.
3: Continue to monitor resistance near 3440 next week. As shown in the chart, a converging triangle pattern may form.

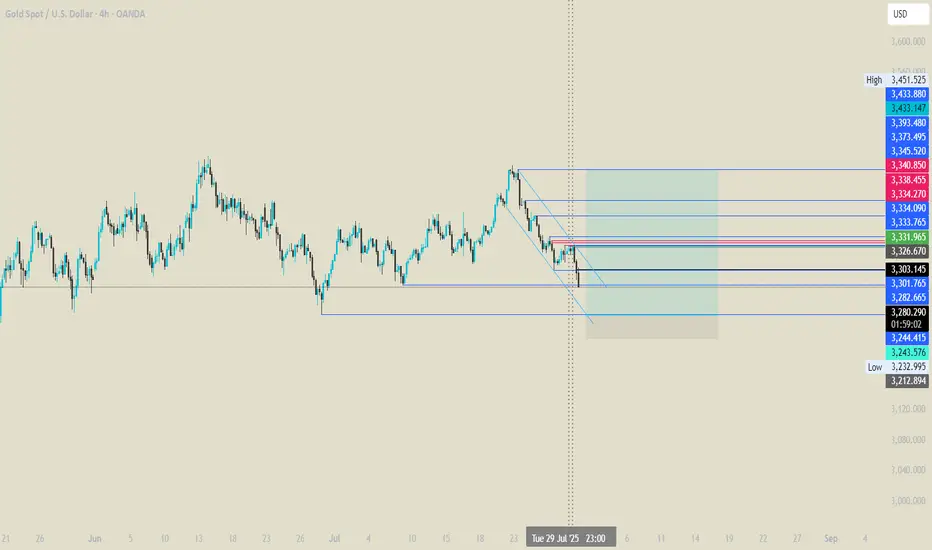
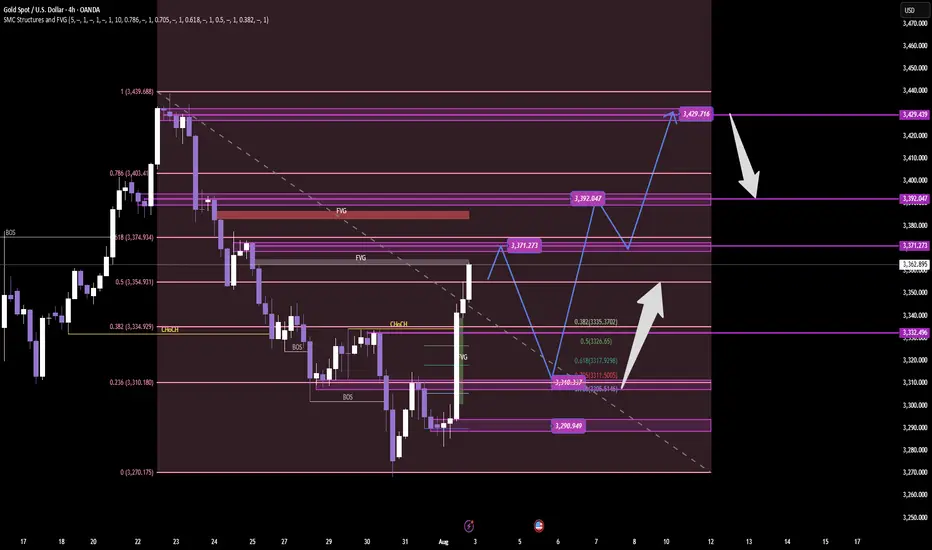
GOLD – SMC ProTrading Breakdown Plan Next WEEK GOLD – SMC ProTrading Breakdown | Clinton Scalper | 4H Timeframe
XAUUSD is currently displaying clear institutional order flow behavior after a deep liquidity sweep at the end of July. Here’s a full breakdown using advanced SMC (Smart Money Concepts) methodology:
🔍 1. Liquidity Sweep at the Low
Price maintained a series of lower highs and bearish structure until it executed a classic liquidity grab between 3,270 – 3,290. This is a textbook move by Smart Money: sweep retail stop orders before initiating a reversal.
This zone aligned with:
✅ Untapped Fair Value Gap (FVG)
✅ Reversal Order Block (OB)
✅ Fibo 0.236 of the mid-term bullish leg
After the sweep, the market printed a micro CHoCH, indicating early signs of smart money accumulation.
🧠 2. CHoCH → BOS → Reaccumulation Structure
CHoCH (Change of Character) marks the first break in the bearish microstructure – suggesting a possible shift.
Then, price delivered a BOS (Break of Structure) around the 3,334 zone, confirming bullish intent.
Buy-side is now:
Positioned from a deep discount zone
Mitigating key inefficiencies
Targeting higher liquidity zones above current price
Price is currently reacting to a previous supply OB around 3,362.
📐 3. Institutional Order Flow & Target Zones
Now that price is in a key reaction zone, we prepare for two high-probability scenarios:
🅰️ Continuation Scenario (Reaccumulation)
A retracement to the 3,317–3,311 zone (Fibo 0.5–0.618) could offer a premium re-entry
This area is stacked with:
FVG
Order Block
Equal lows liquidity
🔼 From there, potential targets include:
🎯 TP1: 3,371 – previous imbalance zone
🎯 TP2: 3,392 – minor liquidity cluster
🎯 TP3: 3,429 – premium OB and high-liquidity zone
🅱️ Distribution Scenario (Bearish Rejection)
If price fails to hold bullish structure and forms a bearish CHoCH around 3,392–3,429
This would signal a distribution zone, and potential reversal back toward 3,290 support
🔂 4. Smart Money Flow Logic
“Smart Money doesn’t follow price. They lead price to liquidity.”
This chart reflects the complete Sweep → CHoCH → BOS → Mitigation → Expansion sequence. A classic SMC Pro model where:
Liquidity is engineered and swept
Structure is shifted
Price returns to mitigate institutional entries
Price expands into external liquidity
📌 Clinton Scalper Outlook:
We don’t chase reversals – we track the footprints of capital. The real edge is understanding where smart money is positioned, and aligning with their narrative.
🔔 Stay tuned for continued updates using this precise and probability-driven Pro SMC framework.
Gold Analysis and Trading Strategy | August 1✅ Fundamental Analysis
🔹 Trump Signs New Tariff Executive Order
On July 31, President Trump signed an executive order imposing a new round of tariffs on countries including Canada and India, while Mexico was granted a 90-day grace period. This move has once again heightened global trade uncertainty, fueling risk-off sentiment and providing support to gold.
🔹 Dollar Strength Limits Gold's Upside
Despite the increase in risk aversion, the U.S. Dollar Index has risen sharply, exerting downside pressure on gold. As a result, the price of gold remains capped, with a tug-of-war between bulls and bears dominating market dynamics.
🔹 Key U.S. Economic Data in Focus
The U.S. Non-Farm Payrolls (NFP) report is the major event on the calendar today. It is expected to be a decisive driver for short-term gold direction:
If the data is bullish for gold (e.g., weak job growth or slower wage increases), gold may retest the 3340 level.
If the data is bearish for gold (e.g., strong job gains or higher wages), gold may break below 3260, continuing its downward trend.
Ahead of the data release, gold is likely to remain in a consolidation range, with market participants generally adopting a cautious stance.
✅ Technical Analysis
🔸 Daily Chart Structure:
Gold printed a gravestone doji yesterday, characterized by a long upper shadow, indicating strong selling pressure at higher levels. The overall trend remains weak. After four consecutive daily declines followed by a minor rebound, another strong bearish candle has emerged, signaling a continuation of the downtrend.
🔸 Hourly Chart Structure:
On the 1-hour timeframe, gold remains below all major moving averages, which are aligned in a bearish formation. Despite multiple rebound attempts, each high has been lower than the last, reflecting diminishing bullish strength. The second U.S. session high was capped around 3310. If today's rebound fails to break above that level, the bearish trend remains dominant.
🔴 Resistance Levels: 3305 / 3315 / 3340
🟢 Support Levels: 3275 / 3260 / 3245
✅ Trading Strategy Reference:
🔻 Short Position Strategy:
🔰Consider entering short positions in batches if gold rebounds to the 3305-3310 area. Target: 3285-3270;If support breaks, the move may extend to 3250.
🔺 Long Position Strategy:
🔰Consider entering long positions in batches if gold pulls back to the 3245-3250 area. Target: 3265-3275;If resistance breaks, the move may extend to 3285.
🔥Trading Reminder: Trading strategies are time-sensitive, and market conditions can change rapidly. Please adjust your trading plan based on real-time market conditions. If you have any questions or need one-on-one guidance, feel free to contact me🤝
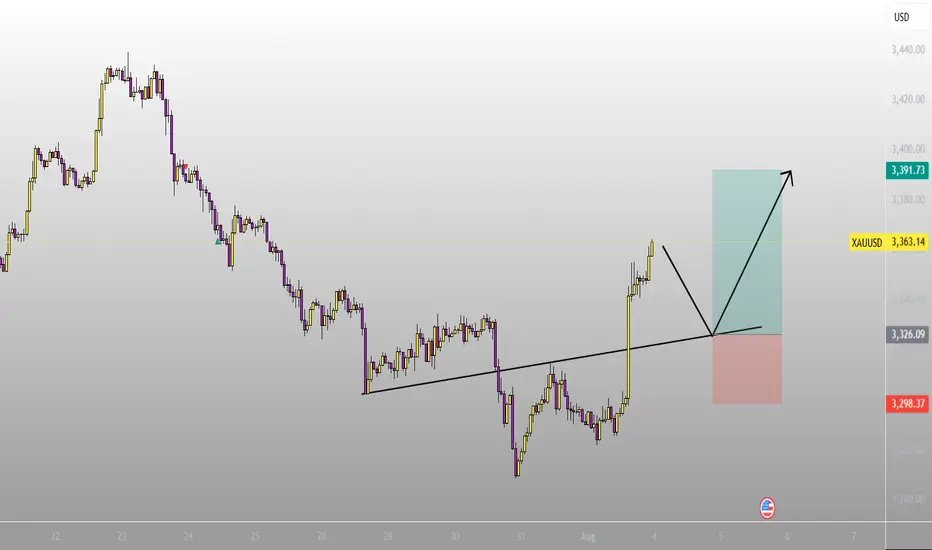
Will gold continues the uptrend from now?I have notice that price retraces in 5 waves before continued go up, from Jun 2025 onwards until now (refer to chart above), and now price has went for 5 waves, and had break the last lower low level. I am going to anticipate the long with my strategy, projecting to higher high of this up trend.

COOChI expect XAUUSD to sell beyond 100 pips after the impulse correction which retested a resistance key level.

MACRO CONTEXT & NEWS FLOW IMPACT — "WHY THE HELL IT MOVED"🔥 I. MACRO CONTEXT & NEWS FLOW IMPACT — "WHY THE HELL IT MOVED"
Yesterday’s move was a classic institutional fakeout followed by controlled accumulation. Today is retest day. Watch VWAP and order flow like a hawk. Don’t chase, wait for reversion and load at value.
📅 Date: July 30, 2025
📰 Event:
US Employment Cost Index: Lower than expected
Core PCE: Cooled off
Market Implication: Fed easing is now on the table.
DXY Weakens → Real yields drop → Gold gets bought like crazy.
👊 Institutional Logic:
Rate-sensitive assets (Gold, Bonds) exploded after the release.
Algorithmic reaction to macro signal: DXY down → XAU bid hard → MegaBar explosion.
BUT institutions needed liquidity to enter big → they faked a breakdown first.
That’s institutional deception 101.
📉 II. DAILY CHART ANALYSIS — THE BIG BOYS' GAMEBOARD
🗺️ Structure:
Price dropped from 3,355 to 3,258 in 3 days — a high-velocity markdown.
On July 30, Price printed a Megabar reversal (Massive range, delta-flush, volume spike).
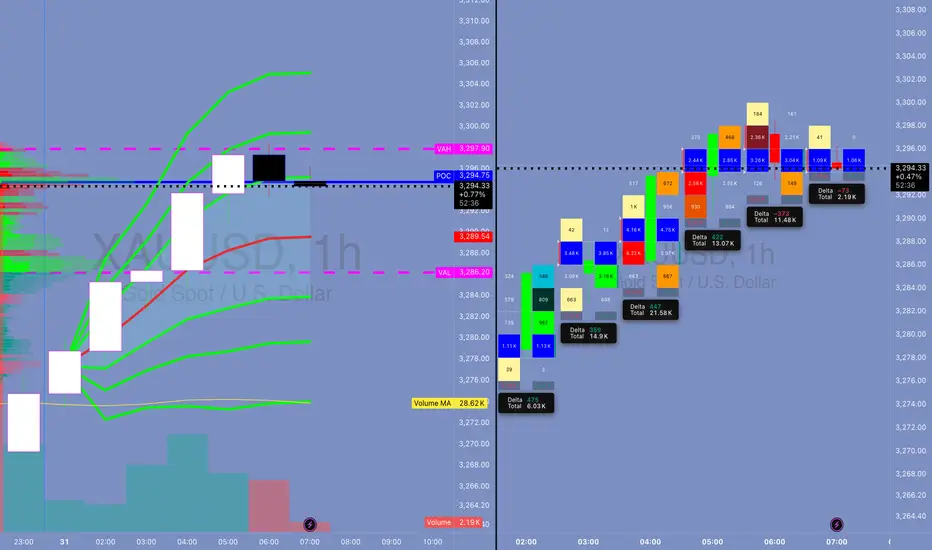
VAH = 3,294.90 capped upside.
POC = 3,288.91, and VAL = 3,282.90 held beautifully.
🔍 Institutional Pattern:
This is a classic “Flush > Absorb > Mark-up” sequence.
Textbook from “Technical Analysis and Stock Market Profits”:
“Volume confirms intention, range confirms commitment. A wide bar with climax volume at low implies the exhaustion of sellers and transfer of ownership.”
🔑 Key Daily Stats:
📉 Delta Flush: -584K
🔁 Reversal Delta: +70K
🔊 Volume spike: >450K (Well above 30-day volume MA)
💡 Inference:
This bar did not print because of retail buying. It’s smart money rebuying from panic sellers.
⏱️ III. 4H / 1H TIMEFRAME: ORDERFLOW & REACCUMULATION
📌 4H Chart:
📍 Megabar with -191K delta near 3,258 (Volume: 191.14K)
Immediate absorption by dark blue and green delta bars — this was not retail reversal.
VWAP reversion in play — price gravitates toward 3,294 (VWAP anchor zone)
🔁 1H Chart:
Rapid stair-stepping: Each hourly candle had higher lows and strong deltas.
Volume built from super-POC 3,289 to super-VWAP 3,295.25.
Final hour: exhaustion wick → distribution into resistance.
🧠 Institutional Tactic:
They used Volume by Price congestion to hold price between FVRP bounds:
Low Volume Nodes (LVNs) = acceleration zones
High Volume Nodes (HVNs) = consolidation + absorption zones
🔍 IV. 15M / MICROSTRUCTURE — WHERE THE GAME WAS REALLY PLAYED
🔬 VWAP Stack Analysis:
VWAP: 3,294.61
D-VWAP: 3,289.30
Super-VWAP Cluster held price in check — real institutional price magnet.
🔄 Delta Flow (15m):
Delta climbed from -3.15K → +3.21K in 1.5 hours.
Imbalance flipped bullish near POC.
🎯 FPVR Mapping (Volume Profile Right Side):
Thickest distribution volume occurred at 3,287 – 3,295
Value tightly packed = fair price.
Institutions are loading in value, not chasing.
⚙️ V. INDICATOR & MOMENTUM SIGNALS — INSTITUTIONAL CONFLUENCE ZONES
Tool Signal
VWAP Anchored VWAP tagged and respected — classic institution level
SMA50 Capped daily move (3,342) — still a long-term bearish lid
HMA5/9 Bullish crossover on 15m/1H – signals momentum alignment
Volume MA Volume climax confirms effort at lows, signaling phase change
🔩 VI. TECHNICAL SEQUENCING OF EVENTS (STEP BY STEP)
Asia Session: Tight range, price floats around VAL (3,282)
London Session: Fake breakdown to 3,258 – traps late shorts
NY Pre-News: Choppy price action within FRVP range
Macro News Drop: Megabar → -191K delta flush
Next Candle: Delta flips +21.2K → Absorption confirmed
Price Walks Up: Controlled bid to VWAP
End of Day: Distribution at VAH → price capped by VWAP band
💣 Final move = algorithmic mean reversion + VWAP auction completion
🧬 VII. ADVANCED ORDERFLOW INTERPRETATION
⚔️ MEGABAR (The Trap Setup):
Volume = 191K+
Delta = -191K (yep, full-on flush)
What happened?
→ Late shorts + stop runs + SL hunters got rekt.
→ Institutions absorbed, switched algo, and reversed.
🧱 FVRP (Fair Value Range Profile):
Defined by VAL (3,282.90) and VAH (3,294.90)
Institutions play inside this range for risk efficiency
They accumulate low and distribute high within it
🔄 Delta Rotation:
Delta Rotation = Shift from Negative Accumulation → Positive Distribution
Classic rotation confirms phase transition
🧠 VIII. INSTITUTIONAL OBJECTIVE (WHAT THEY WANTED)
Primary Goal: Create liquidity void below → Enter large long positions
Secondary Goal: Return to VWAP zone and unload
Tertiary Goal: Signal to market: "We're in control, stay out or get punished"
This is textbook Volume Profile Auction Theory in motion.
🎯 IX. HYPOTHETICAL TRADE SETUP (EDUCATIONAL PURPOSE ONLY)
🧾 Trade Plan: Institutional VWAP Reversion Play
Order Type: Buy Limit
Entry: 3,287.00
Stop Loss: 3,279.00 (below VAL & invalidation)
Take Profit: 3,300.00 (Super-VAH zone)
Confidence: 85%
R/R: 1:1.6
💡 Justification:
Entry at POC + SMA50 cluster
Stop below structural invalidation zone
Target near major supply
This is the exact playbooks funds run during reaccumulation rotations
🧠 X. EDUCATIONAL TAKEAWAY — WHAT YOU SHOULD LEARN
Volume is truth. If volume spikes at lows, it’s not weak hands — it’s smart money flipping.
VWAP is magnet. Everything mean-reverts back to VWAP in controlled auctions.
Delta tracks aggression. Sharp delta reversals = algorithm switch.
Megabar = signal. Huge candle + volume + delta = possible phase shift.
FRVP = roadmap. Price doesn’t move randomly — it moves to balance imbalances.
🔚 CONCLUSION — YESTERDAY’S LESSON
July 30, 2025 wasn’t just a bullish day — it was a textbook institutional deception-reversion cycle. If you understand:
How the news was used
How the megabar printed
How the volume clustered
How the VWAP held
… then you’re not trading blindly.
You’re trading with the damn architects of the market.
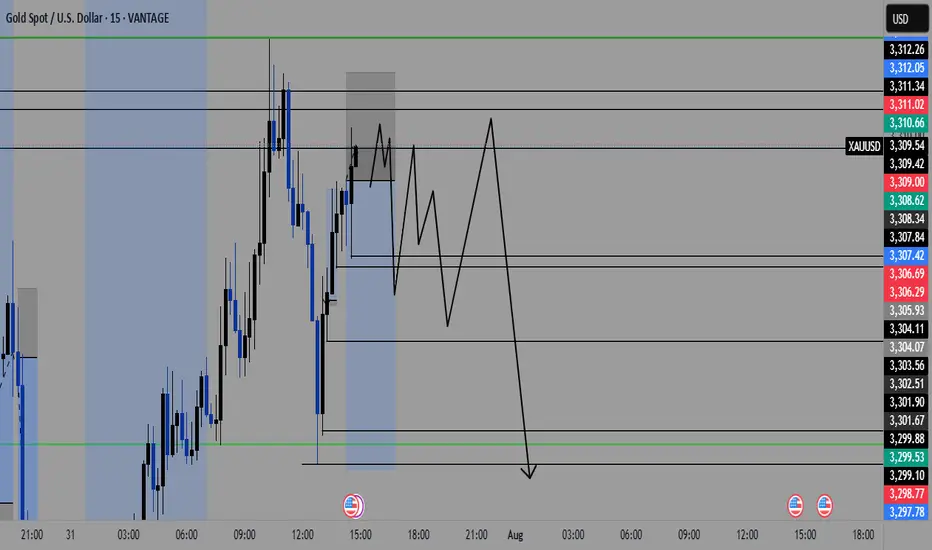
Has gold bottomed out on July 30?
Key Influencing Factors
Negative Factors:
A stronger US dollar: A rebound in the US dollar index is suppressing gold prices.
Recovering risk appetite: Market demand for safe-haven assets is weakening.
Rising real interest rates: Expectations of Fed policy are impacting the cost of holding gold.
US-EU trade agreement: Easing geopolitical tensions will weaken gold's safe-haven appeal.
Potentially bullish variables:
Federal Reserve policy signals: A dovish statement on Wednesday could boost gold prices.
Geopolitical risks: Uncertainties such as the Sino-US trade negotiations and the situation in the Middle East remain.
Technical Analysis
Trend Analysis:
Short-term weakness (four consecutive negative daily candlestick patterns), but the broader bullish trend remains.
Key support level: 3300-3285 (falling below or falling to 3250); resistance level: 3330-3345 (breaking through may end the pullback).
Key Levels:
Downward Support: 3310-3300 (short-term), 3285 (strong support). Upper resistance: 3335-3345 (trend reversal expected after a breakout).
Trading Strategy
Short-term Trading:
Long positions primarily at low levels: Try a light buy position in the 3300-3310 area, with a stop-loss below 3285 and a target of 3330-3345.
Short selling at high levels is auxiliary: If it rebounds to 3335-3345 and is under pressure, you can short sell with a stop loss above 3350 and a target of 3310-3300.
Follow up on the breakout: If it breaks through 3345 strongly, you can chase long positions; if it falls below 3285, be wary of a rebound after a false break.
Medium- to Long-term Strategy:
Watch for potential bottoming opportunities near 3285. If it stabilizes, place long positions in batches, betting on dovish signals from the Federal Reserve or escalating geopolitical risks.
Risk Warning: Data-sensitive period: This week's Federal Reserve decision and economic data may trigger significant volatility, so position management is crucial. US Dollar Trends: The US dollar and gold prices show a significant negative correlation, so the US Dollar Index should be monitored closely.
Risk of false break: There may be a trap below 3300, which needs to be confirmed in combination with the K-line pattern.
Summary: Gold is under short-term pressure, but the medium- to long-term bullish outlook remains unchanged. Focus on the effectiveness of support in the 3300-3285 area and the direction of the Federal Reserve's policy. We recommend a flexible approach, using key breakthroughs as a guide for directional analysis, and cautiously holding positions before data releases.

Gold long from 3242LOOKING FOR LONGS AT AROUND THAT REGION.
gold looks good .
Lets wait for this to unfold.