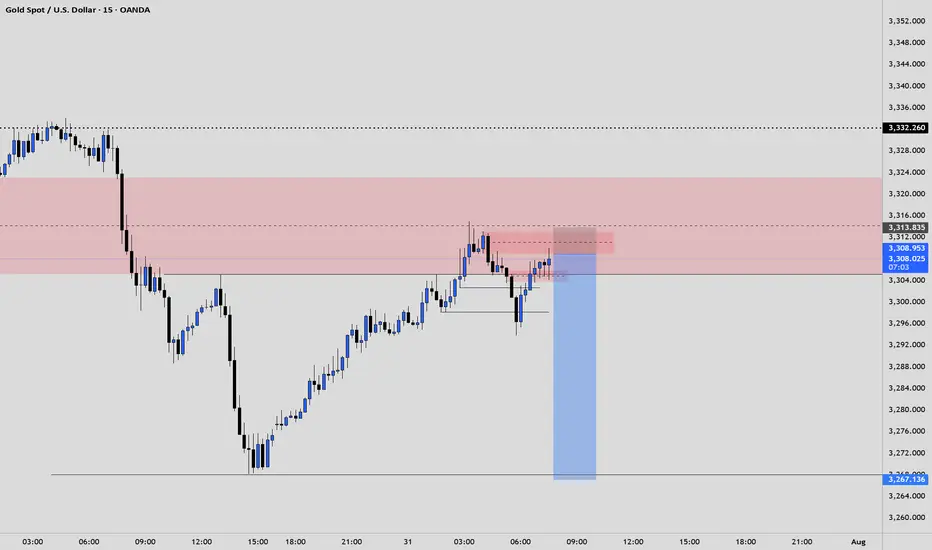
XAUUSD ShortElite analysis - NEWS TRADE
Executed of a 3m OB
Targeting lower LPs
Price is reacting at New Event of this OB.
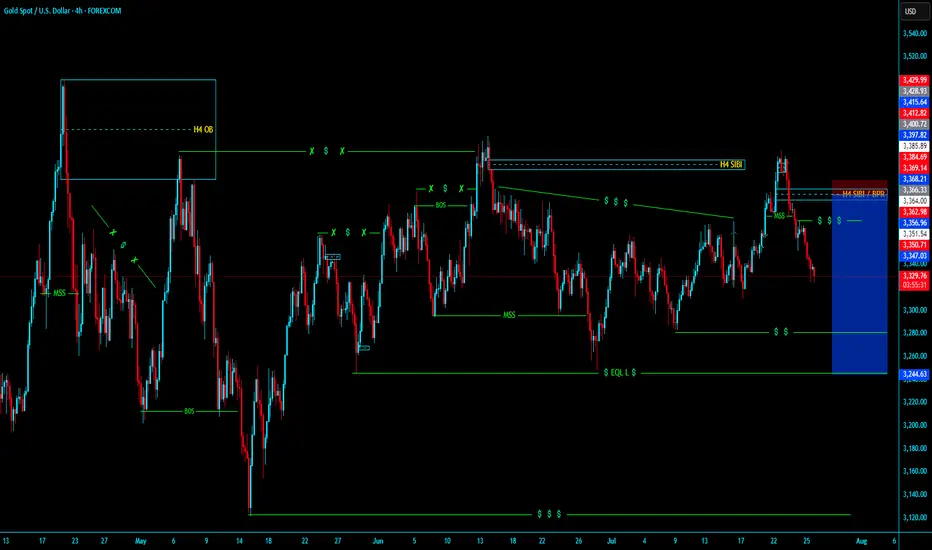
GOLDCFD trade ideas
XAUUSD SELL SHORTXAUUSD SELL SHORT
- In Daily TF H4 TF Market is bearish
Selling from H4 SIBI In LTF Valid MSS then our entry
XAUUSD bullish reversal from a demand zoneThe setup also aligns with a liquidity sweep below previous lows, which could trigger a reversal. Price is now breaking minor resistance levels, creating early confirmation for bullish momentum.
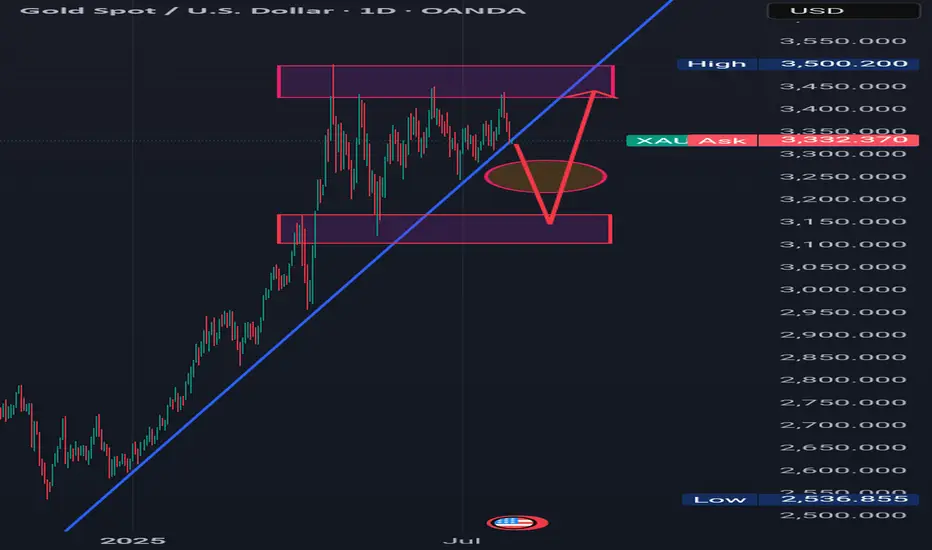
Gold Breakout or Pullback Ahead?Currently, price is in a correction phase within this rising channel after hitting the upper resistance near $3,438. The pullback is moving toward the mid and lower channel zones, which is healthy for a bullish continuation. Gold is in a healthy pullback phase inside a bigger bullish trend. If support at $3,358 – $3,373 holds, expect an upward push back to $3,438 → $3,487 → $3,517 in the coming sessions. Only a clean break below $3,309 would signal a deeper bearish move.
Gold is likely to consolidate or retest the lower channel support ($3,358 – $3,373). If buyers defend this zone, the price is expected to bounce back toward $3,400 – $3,420 and eventually retest $3,438.
Key Price Zones
- Main Resistance: $3,438 (if broken, potential rally toward $3,487 → $3,517)**
- Immediate Support: $3,373 (first reaction level)
- Major Support: $3,358 (key level to protect bullish structure)
- Potential Higher Low Zone: Around $3,342.44
Expected Price Behavior
- If gold holds above $3,373 – $3,358, it is likely to form a new higher low near $3,342 – $3,358 before attempting to push higher.
- A successful breakout above $3,438 would indicate continuation of the bullish momentum targeting $3,487 and $3,517 ).
- Failure to hold above $3,358 may open the door for a deeper correction toward $3,309, but the overall trend remains bullish unless that level is broken.
Trend Outlook
- Short-Term Trend: Consolidation / corrective pullback within a bullish channel
- Medium-Term Trend: Bullish (higher lows and breakout structure intact)
- Long-Term Trend: Bullish as long as the channel holds above $3,309
Gold is currently in a pullback phase after a strong bullish breakout. The market is likely forming a higher low and may resume upward momentum once the $3,373 – $3,358 zone is confirmed as support. A breakout above $3,438 would validate a bullish continuation toward $3,487 - $3,517.
Note
Please risk management in trading is a Key so use your money accordingly. If you like the idea then please like and boost. Thank you and Good Luck!

XAUUSD is still bearish Gold is currently below rising channel and holding the Range of 3320-3335,although yesterday implusive drop is incompleted without testing 3290-3280
What's possible scanarios we have?
▪️I'm still on bearish side till 3345 is invalidated and candle flips above. I open sell trades at 3332 again and holds it .
if H4 & H1 candle close above 3345 I will not hold or renter sell.
▪️Secondly if H4 candle closing above 3345 this down move will be invalid and Price-action will reached 3370.
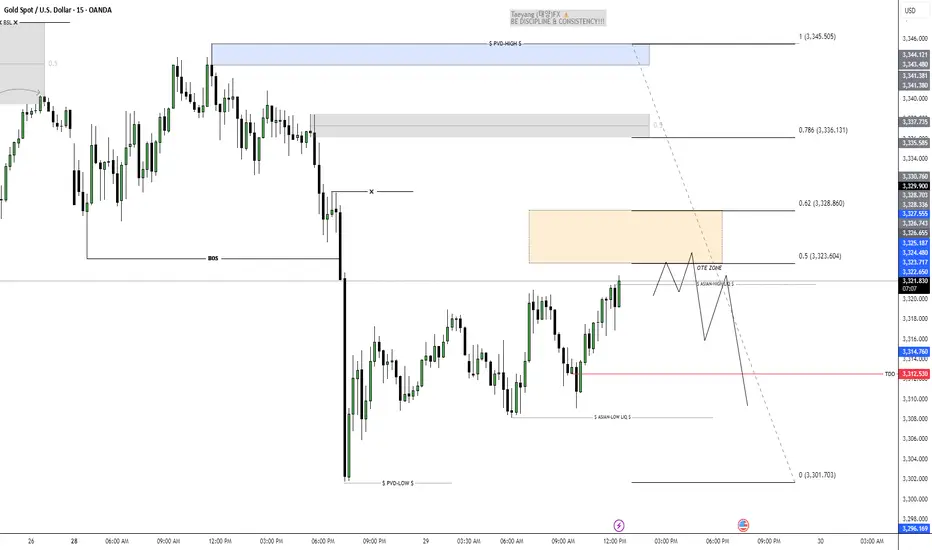
asian high sweep modelxauusd 15min view asian high sweep model with ote zone go with some ltf1min confirmation
Bullish or Bear trapHello Traders 👋
What are your thoughts on XAUUSD
Looking at the daily timeframe I anticipate manipulation by market players on gold.
Is likely that market players will stop Hunt Traders who have their stop losses at the different lows which is indicated with a red circle.
For every buyer there must be a seller and for every seller there must be a buyer.Where they are no sellers in the market the institutions will want to trigger stop losses in order to buy,which is known as stop hunting.That is to takeout previous buyers in the market and generate liquidity to buy.
And this stop hunting usually happens in a ranging market.
Looking at the structure of gold we can see that gold is ranging,
We can see a low or support of the range which was previously resistance and turned support for the ranging market.
I see the market using sell liquidity to liquidate buyers and react at the support or low of the range and move up to the range of the resistance
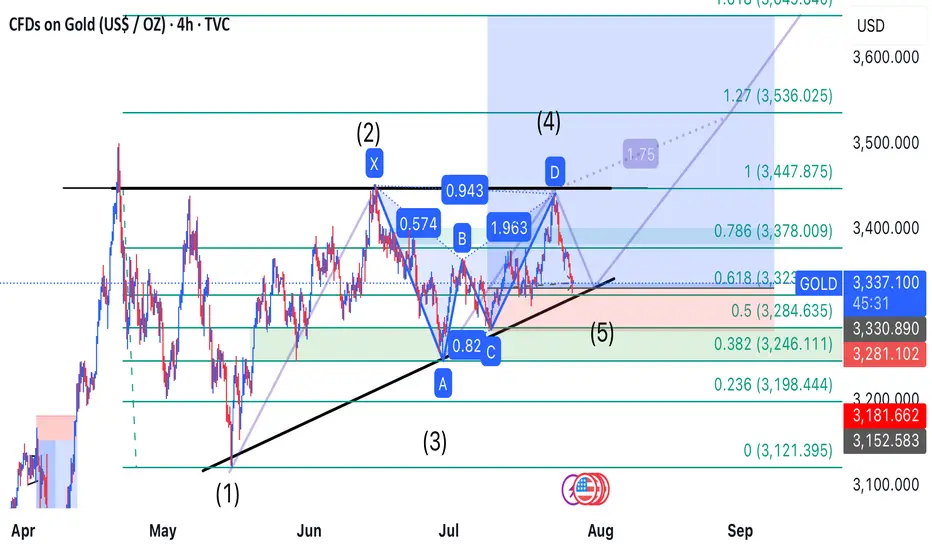
Gold’s Precision Drop: Wave 5 Ignites the Bullish Reversal
---
### 🚀 **Golden Opportunity Ahead: Wave 5 Bullish Breakout Incoming!**
After perfectly completing the **bearish Gartley pattern**, gold dropped precisely to the **target zone at 3,323**, just as predicted. This move confirmed the formation of **Wave 5**, signaling the end of the corrective phase.
Now, all signs point to a **strong bullish reversal**—and the next step is a powerful rally toward the predefined targets. This is a **prime buying opportunity** for traders looking to ride the wave!
### 🎯 **Buy Zone:**
- **Entry:** Around **3,323 USD**
### 📈 **Profit Targets:**
| Target | Fibonacci Level | Price (USD) |
|--------|------------------|-------------|
| TP1 | 1.0 | 13,447.875 |
| TP2 | 1.27 | 13,536.025 |
| TP3 | 1.618 | 13,649.640 |
The link of. The previous analysis is below in the comment
---
XAUUSD TRADE SETUPWait for retest the entry level and bullish momentum then take a trade for Buy otherwise skip this setup

GOLD BUY M15 Gold (XAUUSD) 15-Minute Chart Analysis – July 28, 2025
Price is currently forming a potential bullish setup after a recent drop. A bullish order block area has been highlighted (purple zone), indicating a possible demand zone where buyers might step in.
Entry Zone: Around 3333 – current price region.
Stop Loss (SL): 3322 (placed below the demand zone).
Target: 3350 – marked as the main bullish target.
The expected move is a bounce from the demand zone, with multiple small retracements, leading to a potential breakout toward the resistance zone around 3350.

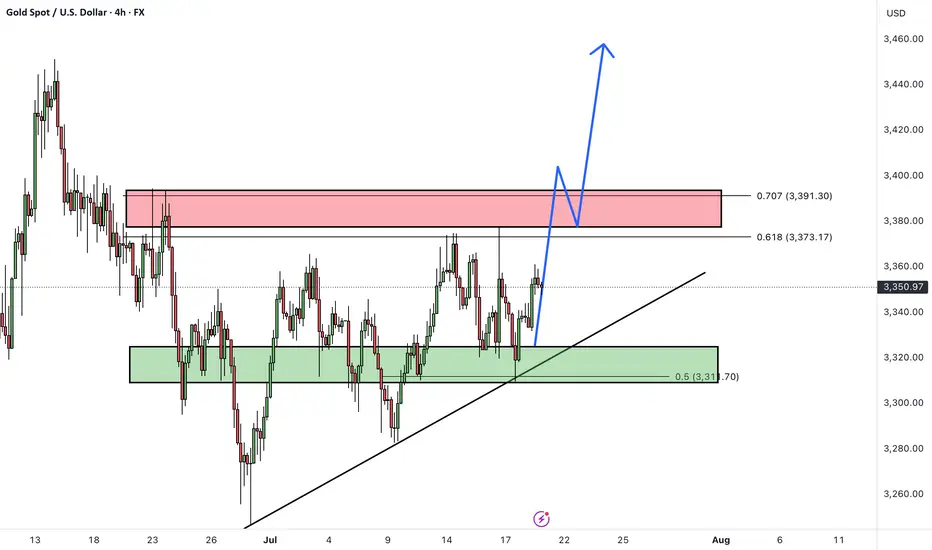
XAUUSDHello Traders! 👋
What are your thoughts on GOLD?
Over the past week, gold has been consolidating within a defined range, fluctuating between two key zones.
A break above the marked resistance zone (around $3380-3390) would confirm the start of the next bullish wave, opening the path toward higher targets.
As long as price remains above the identified support zone, our outlook stays bullish.
Key Levels to Watch:
Resistance: Breakout above $3380 needed to confirm continuation
Support: Holding this zone is essential to maintain the bullish structure
Is gold ready for a breakout after consolidation? Share your thoughts below! 🤔👇
Don’t forget to like and share your thoughts in the comments! ❤️
GOLD: Bullish Reversal Pattern Activated! 21/07/2025THE GOLDEN SETUP: Triple Bottom Masterpiece :
🟢 BULLISH BREAKOUT SETUP
🎯 BUY ZONE: $3,324 (Neckline Break)
🚀 TP1: $3,377
🚀 TP2: $3,393
🚀 LAST TP : $3,408
Stop Loss: $3,312 (Below recent low) 🚨
🌟 Before You Trade:
✅Wait for neckline break ($3,325+)🔥
✅Confirm with volume surge
✅Set stop loss below pattern ($3,312)
✅Calculate position size (max 2% risk)
--------------- N O T E ----------------
🚨 RISK MANAGEMENT 💡DYOR
Follow for more high-probability setups! 📊✨

XAU/USD (Gold vs US Dollar) 1-hour technical analysis:📉 Support Zones:
3,312.35 – 3,300.00: Strong demand zone (marked in green) – this is your “buy” zone.
3,326.00 – 3,341.27: Intermediate support level, but may not hold under pressure.
📈 Resistance Zones:
3,359.40 – 3,373.04: Near-term resistance.
3,402.78: Key resistance from previous structure high.
🔁 Price Prediction Path:
The hand-drawn path suggests:
Short-term choppy consolidation or fakeouts.
A potential drop into the green demand zone.
Buy opportunity near 3,312 if a reversal signal appears.
Expected bullish reversal toward 3,359+.
📊 Volume Analysis:
Volume spikes near previous demand confirm strong buying interest.
Recent volume tapering indicates a slowdown in selling pressure.
✅ Potential Trade Setup:
Buy Limit: Around 3,312.00 – 3,305.00
Stop Loss: Below 3,300.00
Take Profit: 3,359.00 – 3,373.00
Risk/Reward Ratio: Favorable if entry is timed with confirmation (e.g., bullish engulfing, double bottom, or volume spike).

XAUUSD BUYS PROJECTION Hey everyone wow is been long since I posted here I can say for sure trading has never been so tougher for me cuz am tryna refine my edge and I miss posting and sharing my ideas here so this is my analysis on Gold after seeing Gold rejected a strong resistance zone and price keeps pushing down tho I missed the sells but market is always full of opportunity and here are my zones to take buys from,mind you these zone are very strong support zones that mostly buyers get in the market so I will be waiting for price to get to the first zone which is the green and the second is for scaling in after placing the first on breakeven and yes I will update you guys…..
XAUUSD Technical Analysis – Educational Insight Key Observations:
🔴 Strong Support Zone (3,278 – 3,299 USD)
This zone has been highlighted as a key institutional level where buyers have consistently stepped in.
It aligns with previous Breaks of Structure (BOS), confirming its historical significance.
📉 Recent Price Action:
Price is retracing from the highs of around 3,439 USD and is approaching the strong support zone again.
A possible liquidity grab near the support is anticipated before a bullish reversal.
🔄 Break of Structure (BOS):
Multiple BOS marked indicate shifts in market direction and the presence of aggressive buying/selling phases.
These BOS events help identify trend continuation or reversal points.
🟢 Bullish Fair Value Gap (FVG):
A bullish FVG is present, indicating imbalance in price movement where institutions may look to fill orders.
Price previously reacted positively to this zone, indicating unfilled demand.
📈 Target Area:
A clearly marked target at 3,440.487 USD, which aligns with Buy-Side Liquidity, suggests a potential liquidity run.
This implies smart money may drive price upwards after collecting liquidity below support.
Volume Profile (VRVP):
The horizontal volume bars show the highest traded volume areas, providing confirmation for key support zones and BOS reactions.
🧠 Educational Insights:
BOS (Break of Structure) is used by institutional traders to spot shifts in trend. It typically signals continuation or reversal when aligned with liquidity concepts.
Liquidity Zones (like buy-side or sell-side liquidity) often serve as magnets for price; smart money aims to trigger orders and trap retail traders.
Fair Value Gaps represent imbalances where price moved too fast; institutions may return to these zones to execute pending orders.
Volume Profile Analysis helps in understanding where the most buying/selling occurred—confirming support and resistance zones.
📌 Strategy Suggestion (For Learning Only):
Entry Idea: Wait for price to tap the strong support (ideally sweep liquidity slightly below).
Confirmation: Look for bullish engulfing or BOS on lower timeframe to confirm reversal.
Target: 3,440 area where buy-side liquidity resides.
Stop Loss: Below the strong support (near 3,270 level) to protect against deeper liquidity grabs.
📢 Disclaimer (Educational Use Only):
This analysis is for educational purposes and not financial advice. Trading involves significant risk; always do your own research or consult a financial advisor.

Elliott waveAccording to the bearish structure, the ABC wave is completed, there are 5 more bearish waves.
Sell 3334, stoplos 3344, tp 3310

Weekly Trend Radar1. Macro Market Overview
Last week, the Federal Reserve kept interest rates unchanged, as widely expected. The decision was fully priced in, and the press conference offered no surprises: future rate cuts will depend on incoming economic data.
Markets initially reacted with a decline, but I do not see a structural break in the uptrend for commodities. It looks more like a healthy cooldown before the next leg higher .
However, the equity market is showing signs of deeper weakness . Historically, August tends to be a challenging month for stocks, and what we may be witnessing now is not a short-term correction but the early stages of a major downtrend.
Cryptocurrencies followed equities lower due to their high-beta, risk-on nature, but similar to metals, I believe the correction is temporary and the broader uptrend remains intact.
In energy markets, oil remains volatile — no clear setup for a long position yet. Natural gas has reached support and may offer a cautious long opportunity, though the medium-term trend is still bearish.
Overall, global markets are holding key levels, except for equities, which now look the weakest.
2. Metals
Buy the Dip!
🥇Gold
Gold ended the week slightly higher — a strong performance considering the broader market weakness. Its resilience highlights its role as a safe-haven asset. The bullish trend remains intact, and institutional support appears to be holding.
Trend: Bullish
Key Levels: Support at 3245, resistance at 3450
Position: Looking for a long entry next week
🥈Silver
A more volatile asset compared to gold, silver has pulled back but remains within its bullish trend. Friday’s daily candle showed promise, bouncing from the 50-day moving average. Despite not closing above Thursday’s high, the setup is constructive.
Trend: Bullish
Key Levels: Support at 36.30, resistance at 38.00
Position: Long, stop below Friday’s low at 36.30. New entries still valid.
⚪️Platinum
Similar structure to silver. Friday’s reversal candle signals potential continuation of the bullish move.
Trend: Bullish
Key Levels: Support at 1280, resistance at 1480
Position: Long, with stop below Friday’s low. Valid setup for new positions.
🔘Palladium
Strong technical picture even without a test of the 50-day MA. Remember — these MAs are not entry signals, but trend indicators. Entry is based on confluence, not location alone. And it would be nice to finally see parity with platinum.
Trend: Bullish
Key Levels: Support at 1185, resistance at 1260, 1310, 1340, 1370
Position: Planning to enter long at Monday’s open if the market is supportive. No entry if risk-off sentiment dominates.
🟠Copper
Copper is one of the most compelling setups this week. After a sharp 25% decline, it remains in an overall uptrend. Friday’s bullish candle on the daily chart is promising. A potential new rally may start from here.
Trend: Bullish
Key Levels: Support at 4.35, resistance at 5.15
Position: Planning to enter at Monday’s open, stop below Friday’s low.
3. Energy Markets
🛢️Crude Oil
I'm leaning toward a long setup, but Friday’s red candle on the daily chart signals the need for caution. Waiting for a clear reversal candle before entry.
Trend: Bullish
Key Levels: Support at 68.30, resistance at 72.68, 75.00, 77.70
Position: Waiting for lower volatility and confirmation from daily chart structure.
🔥Natural Gas
The asset has reached a strong support zone. Daily candles are starting to form a potential bottoming pattern, but we need to break through resistance at 3.20 to gain confidence.
Trend: Bearish (medium-term)
Key Levels: Support at 3.00, resistance at 3.20, 3.35, 3.65
Position: Cautious long, small size. Stop-loss is wide, so risk management is key.
4. S&P 500
📉I believe we are entering a major downtrend in the stock market. This is not just a correction — it's likely the beginning of a more sustained decline. I’m shifting my bias to short.
Trend: Bearish
Key Levels: Support at 6150; resistance at 6430
Position: Waiting for short opportunity.
5. Bitcoin
₿Bitcoin followed the equity market lower. The trend is still technically bullish, but the recent risk-off tone in equities warrants caution. Crypto is not a defensive asset and tends to experience sharper drawdowns.
That said, I do not expect another prolonged "crypto winter." Institutional involvement has improved market depth and liquidity, reducing the severity of future crashes — though volatility will remain elevated.
Trend: Bullish
Key Levels: Support at 112.000; resistance at 117.000, 121.000, 123.300
Position: Long, stop below Friday’s low. Act with caution.

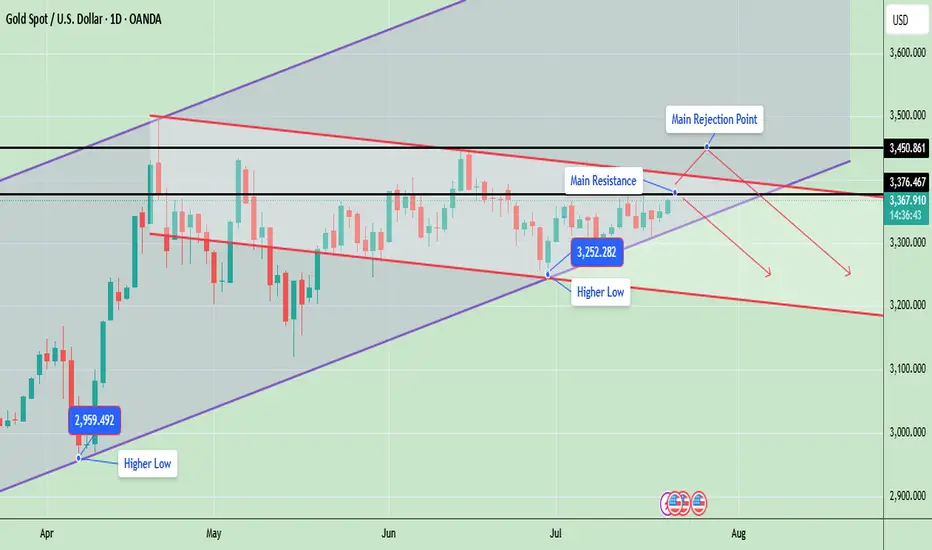
Gold Price Update – Testing Key ResistanceGold is currently trading around 3367, showing strong bullish momentum as it continues to form higher lows, which indicates an ongoing uptrend. The market structure is developing inside a rising wedge pattern, with the price consistently respecting both the ascending support and resistance lines.
Gold is now testing a key resistance zone between 3376 and 3450, an area that previously acted as a major supply zone and caused sharp rejections. A successful breakout and close above 3450 will likely confirm a bullish continuation and may open the door for a rally toward 3500 and possibly 3580. However, if gold fails to break this level, it could retrace back to the 3300 or 3250 support zones, especially if a rejection candle forms in the daily timeframe.
📊 Key Technical Highlights:
- Price has approached the upper resistance boundary of the wedge.
- Daily candle is bullish, indicating strong buying momentum.
- However, unless price closes above 3,376–3,450, there’s still a risk of rejection from the top channel and a pullback toward 3,300–3,250.
🔑 Key levels to watch:
- Gold is currently trading around $3,367, just below a crucial horizontal resistance at $3,376
- A strong breakout above $3,376, and especially above $3,450, could open the door for further bullish movement toward the $3,500–$3,600 range, following the upper trendline of the ascending channel.
- On the downside, if price fails to hold the higher low at $3,252, a drop toward $3,200 or even $3,100 is possible aligning with the downward red trendline.
- The structure remains bullish overall, as price is still making higher lows and staying within the rising channel
📊 Weekly Gold Chart Analysis
Gold is currently trading around $3,368, forming a symmetrical triangle pattern on the weekly timeframe. This pattern typically indicates a period of consolidation before a potential breakout in either direction. The price is getting squeezed between lower highs and higher lows, which is a sign of decreasing volatility and approaching breakout.
🔑 Key Technical Insights:
- ✅ Current Structure: Price has been consolidating within a triangle since April 2025 after a strong upward move. It is now near the apex of the triangle, suggesting a breakout is imminent—most likely in the next 1–2 weeks.
🔼 Bullish Breakout:
- If gold breaks above the triangle resistance (~$3,385–$3,393), it could trigger a sharp rally.
- Upside targets post-breakout: $3,450, $3,500, $3,600+ (if momentum continues)
🔽 Bearish Breakdown:
- A break below the triangle support (~$3,335–$3,325) may lead to a deeper correction.
- Downside targets post-breakdown: $3,285, $3,200
- Possibly $3,100–$3,050 if bearish sentiment intensifies
📉 Volume Drop:
As typical with triangles, volume has likely decreased, signaling indecision. Once volume returns, it will likely confirm the breakout direction.
Note
Please risk management in trading is a Key so use your money accordingly. If you like the idea then please like and boost. Thank you and Good Luck!
GOLD Long After Lower Dip - Catching PullbackOANDA:XAUUSD / TVC:GOLD Long Trade, with my back testing of this strategy, it hits multiple tp, here price will pullback up.
Price will bounce in this zone.
I kept SL slight big to be safe because TP levels are good so I don't want to get pushed out because of tight SL.
Note: Manage your risk yourself, its risky trade, see how much your can risk yourself on this trade.
Use proper risk management
Looks like good trade.
Lets monitor.
Use proper risk management.
Disclaimer: only idea, not advice
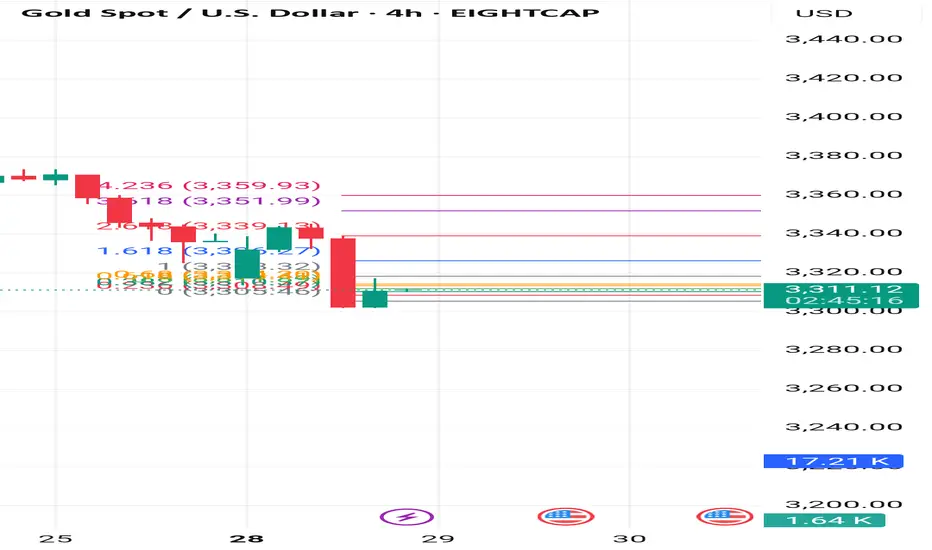
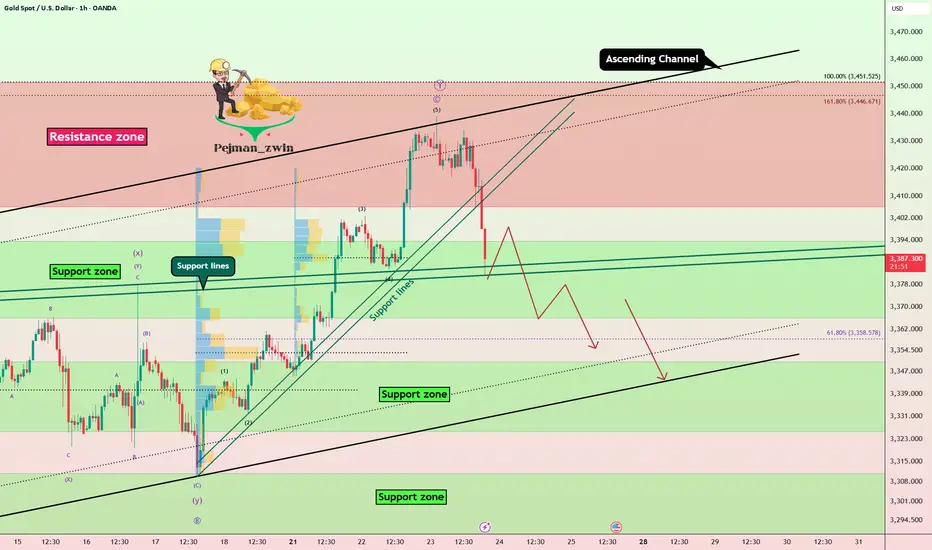
Elliott Wave Analysis – XAUUSD – July 28, 2025📊
________________________________________
🔍 Momentum Analysis:
• D1 Timeframe: Momentum has entered the oversold zone. This strongly suggests a potential bullish reversal today, which could lead to a rally or sideways movement lasting around 4–5 days.
• H4 Timeframe: Momentum is reversing upward. This indicates a likely bullish or sideways move in the short term, at least until momentum reaches the overbought zone (estimated within the next 2 H4 candles).
• H1 Timeframe: Momentum is currently overbought, so we may first see a pullback or sideways movement until a clearer reversal signal appears.
________________________________________
🌀 Wave Structure Analysis:
• On the H4 chart, as noted in previous plans, the assumption that price is forming a contracting triangle (abcde) is still valid. Price is currently in the final leg (wave e) of this triangle.
• On the H1 chart, we can observe a channel structure, within which an abc corrective pattern is unfolding.
• The lower boundary of the triangle (marked by the green trendline) combined with support zones will be critical areas to monitor for the end of wave e.
🔺 Note: Wave e does not necessarily end precisely at the triangle boundary – it can slightly overshoot. Hence, we’ll rely on smaller wave structures to identify potential reversal zones.
________________________________________
🎯 Key Price Zones to Watch:
• Target 1: 3329
• Target 2: 3309
• Target 3: 3290
________________________________________
🔎 Lower Timeframe Structure (M10):
From the current price action (as shown in the chart), we can see a leading diagonal triangle structure forming. This is a pattern commonly seen in wave 1. If this pattern is confirmed, a sharp and steep decline toward the 3329 zone is likely.
________________________________________
⚖️ Combining Momentum & Wave Structure:
• D1: Signals a potential reversal → favors Buy setups.
• H4: Momentum is rising, but price hasn’t confirmed a new bullish trend → need to stay alert and tighten Stop Loss.
• H1: Overbought + possible leading diagonal → Expecting a pullback for wave 2 toward 3329 → this would be the optimal Buy zone.
________________________________________
🧭 Trade Plan:
• For experienced traders:
→ Wait for price to reach key levels and watch for reversal signals before entering.
• For beginners:
→ Use the following Limit Buy setup:
✅ Setup 1:
• Buy zone: 3330 – 3328
• Stop Loss: 3320
• TP1: 3351
• TP2: 3370
• TP3: 3385
✅ Setup 2:
• Buy zone: 3310 – 3308
• Stop Loss: 3300
• TP1: 3328
• TP2: 3351
• TP3: 3370
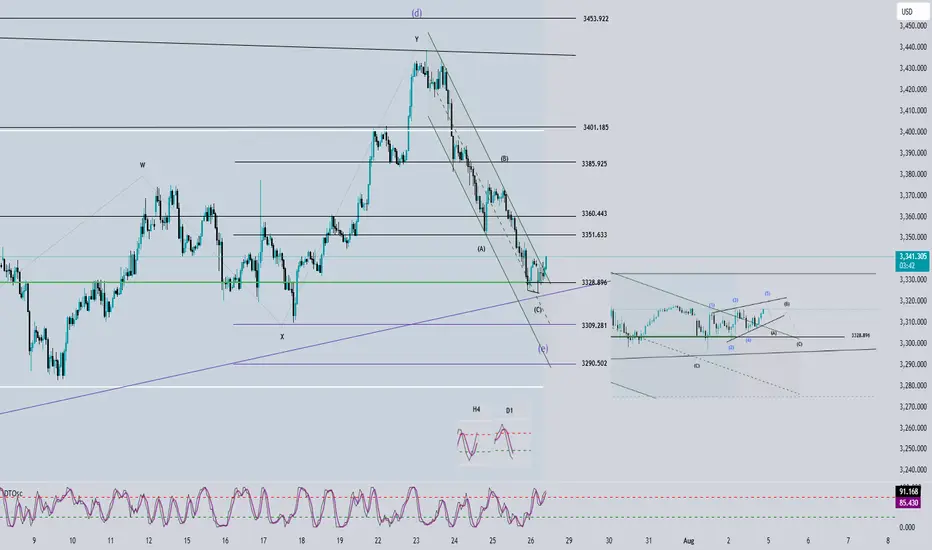
Gold Fails at Resistance, Elliott Wave Signals Deeper CorrectionGold ( OANDA:XAUUSD ) started to rise after the Richmond Manufacturing Index(Actual:-20/Forecast:-2/Previous-7) index was announced, but failed to break the upper line of the ascending channel and the Resistance zone($3,451-$3,406) .
Gold has now broken through the Support lines and is attempting to break through the next Support lines and Support zone($3,394-$3,366) .
In terms of Elliott Wave theory , it appears that the main wave Y has completed above the ascending channel.
I expect that given the momentum of gold's decline , gold will be able to break the Support zone($3,394-$3,366) and Support lines and fall to at least $3,356 . The next target could be the lower line of the ascending channel .
Note: Stop Loss (SL) = $3,423
Gold Analyze (XAUUSD), 1-hour time frame.
Be sure to follow the updated ideas.
Do not forget to put a Stop loss for your positions (For every position you want to open).
Please follow your strategy; this is just my idea, and I will gladly see your ideas in this post.
Please do not forget the ✅ ' like ' ✅ button 🙏😊 & Share it with your friends; thanks, and Trade safe.
GOLD → Countertrend correction. Where will growth begin?FX:XAUUSD faced pressure in the 3430 zone, traders moved into profit-taking mode, triggering a correction. The price entered the sell-off zone...
On Thursday, gold is trading below $3400 as traders assess progress in US-EU trade talks and await preliminary PMI data from the US and the EU. These indicators could influence expectations for Fed and ECB rates. Optimism is being bolstered by reports of trade agreements between the US and Japan and other countries. The ECB is expected to keep rates unchanged, while the probability of a Fed rate cut in September is estimated at 60%. Investors are also watching Trump's conflict with Powell amid his visit to the Fed. Technically, the daily market structure is not broken, and a correction is forming within acceptable limits.
Based on the current direction, the market may test the intermediate bottom: trend support, the 3345-3320 area.
Resistance levels: 3375, 3383, 3400.
Support levels: 3345, 3320
A retest of resistance at 3375-3383 is possible. If the bears keep the price below this zone, the metal may continue its correction phase towards the zone of interest indicated on the chart. Local sell-offs have not yet broken the bullish daily structure.
However, the absence of a downward impulse and consolidation in 3375 - 3383 with a subsequent breakout of local resistance could increase demand again, which would generally lead to premature growth to 3400 - 3435.
Best regards, R. Linda!
