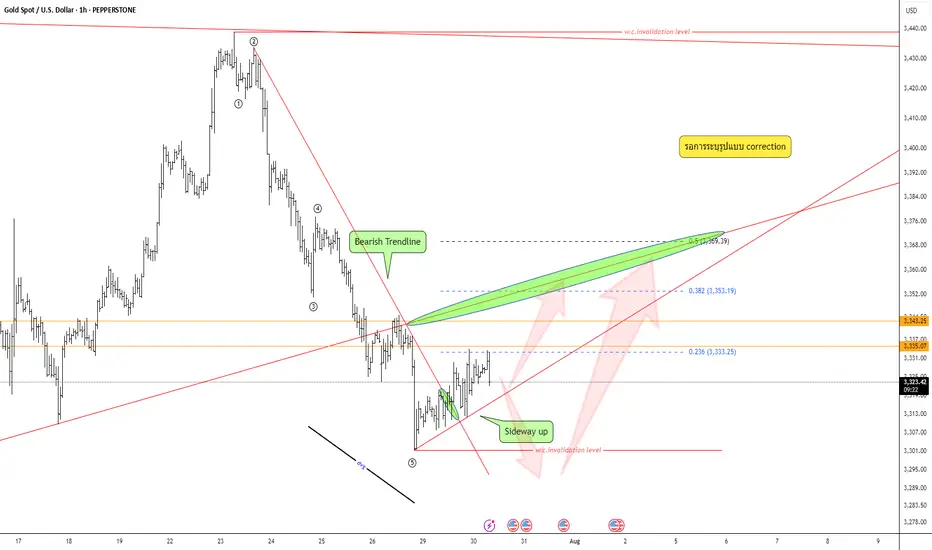
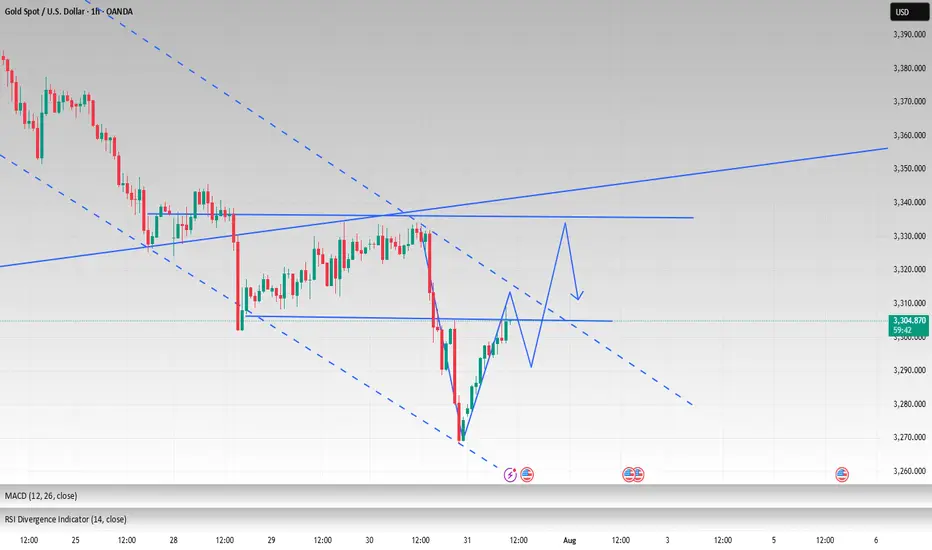
Keep an eye on the correction pattern —Quick Take:
- Strong bearish move, but wave structure still unclear — not a confirmed impulse.
- Bear trendline has broken; market now leaning toward sideways-up.
- Divergence is visible.
Plan:
Wait for correction pattern → confirm with your system → execute only with full data and strict risk management.
GOLDCFD trade ideas
Gold Struggles Near Resistance – Eyes on 3313 for Further DropXAU/USD Slips as Dollar Gains on Trade Deal – Bearish Below Pivot Zone
Gold is under pressure as the U.S. dollar strengthens on optimism around a trade agreement. Risk appetite has returned, weighing on safe-haven demand.
Price failed to hold the pivot zone (3347–3360) and is now slipping below 3327. A 4H close below 3313 will likely trigger further downside.
Until bulls reclaim the pivot, bias stays bearish. Next support sits near 3287 if 3313 breaks clean.
Key Levels:
Resistance: 3388 – 3390 – 3412
Pivot Zone: 3340 – 3347
Support: 3313 – 3263

How to plan for the evening, pay attention to the 3300 markAfter the shorts took profits, gold consolidated in the 3310-3300 area. Judging from the daily chart, the decline in gold seems to have just begun, with the middle track of the Bollinger Band at around 3345 and the lower track at 3285. The possibility of falling below the 3300 mark cannot be ruled out in the evening. If gold falls below the 3300 mark, it may first hit 3295. If the decline continues, it may even hit the low of 3285-3275 below. However, if the 3300 mark can be effectively defended, then the possibility of maintaining the consolidation of 3300-3345 in the evening may be maintained. Therefore, it is not recommended to easily participate in transactions at the current position in the evening. It is mainly advisable to wait and see and pay attention to the breakthrough of the 3300 mark.
My premium privileges are about to expire, and subsequent trading strategies and analysis will be published in the group.

Waiting for Gold to Dump| Area Of OpportunityWe can clearly see the overall trend of Gold, which is bearish. As the price action we see bearish FVA (Fair Value Areas/Swing Lows) being run. The anticipation is to wait for the latest Swing low to be ran, before looking for entries.
Why?
Because, the path towards our nearest POI (Point Of Interest) will have a low resistance. Meaning price might expand lower smoothly.

Still a chance for gold bulls?
💡Message Strategy
The gold market was volatile this week, and gold prices ultimately closed lower for the week.
Gold prices have failed to stabilize above $3,400 an ounce after a bullish breakout. The technical outlook highlights the recent indecision of gold bulls. Looking ahead to next week, the Fed's policy statement and US-China trade talks could trigger the next big move for gold.
These important factors may trigger the market next week
1. The Fed will announce its monetary policy decision after its policy meeting on July 29-30.
Before the Fed meeting, the U.S. Bureau of Economic Analysis will release its first estimate of annualized growth in gross domestic product (GDP) in the second quarter.
2. Next Friday, the U.S. Bureau of Labor Statistics will release the July employment report.
If the non-farm payrolls (NFP) increase by more than 100,000, it may indicate that the labor market is in good enough condition for the Fed to prioritize controlling inflation and support the dollar when making policies.
If the new non-farm payrolls data reaches or falls below 70,000, the dollar may find it difficult to find demand before the end of next week and help gold gain bullish momentum.
3. Market participants will be closely watching the headlines of the US-China negotiations.
If the two sides make further progress in trade and economic relations, risk flows may dominate the actions of financial markets, making it difficult for gold to find demand.
📊Technical aspects
The short-term technical outlook highlights the hesitation among gold buyers. The daily chart shows that the relative strength index (RSI) remains just below 50, and gold is struggling to move away from both the 20-day simple moving average (SMA) and the 50-day SMA after breaking above both levels earlier this week.
If the price of gold falls to the key support level of $3,310 and fails to break down (trend line support/Fibonacci 61.8% retracement level), it will force a large number of shorts to exit the market and may further test the $3,340 range (psychological level/Fibonacci 76.4% retracement level).
Combined with the current trend, the downward momentum of gold has weakened, and it is seeking support to restart the long position
💰Strategy Package
Long Position:3310-3320,SL:3290,Target: 3340
buy idea xauusdxauusd buy scenario
demand created we can long xauusd untill we reach the next supply

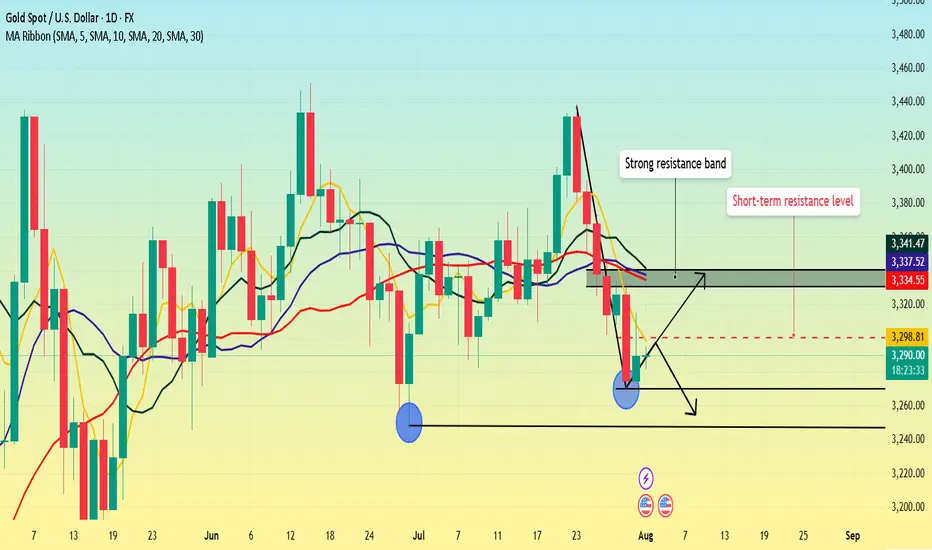
Non-farm payrolls are coming. What's the gold trend?Gold fell sharply on Wednesday, but Thursday's market didn't continue the downward trend as some investors expected. Instead, it showed a trend of rising and then falling.
From the daily perspective, we first need to focus on the resistance level near 3300 where the 5-day moving average is located. This position is not only a short-term technical resistance, but also reflects the market's psychological expectations to a certain extent. If prices can successfully break through this level and stabilize above it, it will indicate that bullish momentum is strengthening, potentially boosting market sentiment. At this point, the next resistance area to watch is the 3330-3340 range. This area converges the 10-day, 20-day and 30-day moving averages, forming a strong resistance band.
As for the support below, the primary focus is Wednesday's low of 3268. However, if this level is lost and the price continues to fall, the next support area will be around 3245, which is the previous low.
Trading strategy:
Short around 3300, stop loss at 3310, profit range 3280-3260.
Repeated pattern?We have to wait and see whether gold is going to repeat the same pattern or if this time it manages to rise from that level.
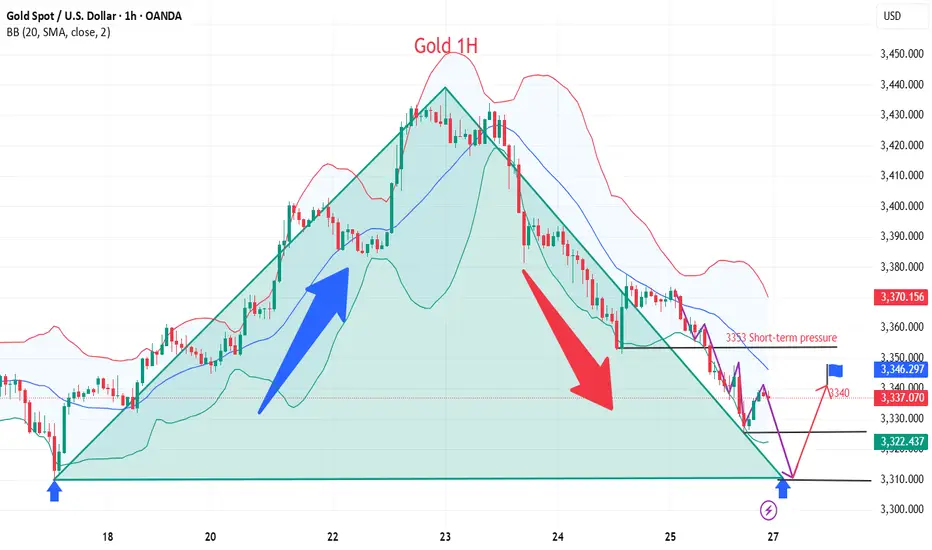
Short selling remains the main themeGold hit a low of around 3267 yesterday and fluctuated until closing at 3274. Gold fluctuated upward at the opening today. Currently, gold is fluctuating around yesterday's rebound point of 3305. This is the resistance we need to pay attention to in the short term.
From the 4H analysis, today's short-term resistance is around 3305-3315. If gold wants to rise, it needs to stabilize above 3315. Focus on the 3335 first-line pressure, and rebound to the 3305-3315 resistance area during the day. You can consider shorting and follow the trend to see the decline unchanged, looking towards 3290-3280. Rely on this range to maintain the main tone of high-altitude participation. For the middle position, watch more and do less, be cautious in chasing orders, and wait patiently for key points to enter the market.
BUY GOLD XAUUSD @ a critical demand zone . Bulls accumulating to start the moon journey. target 3400-3450 , stoploss 3290

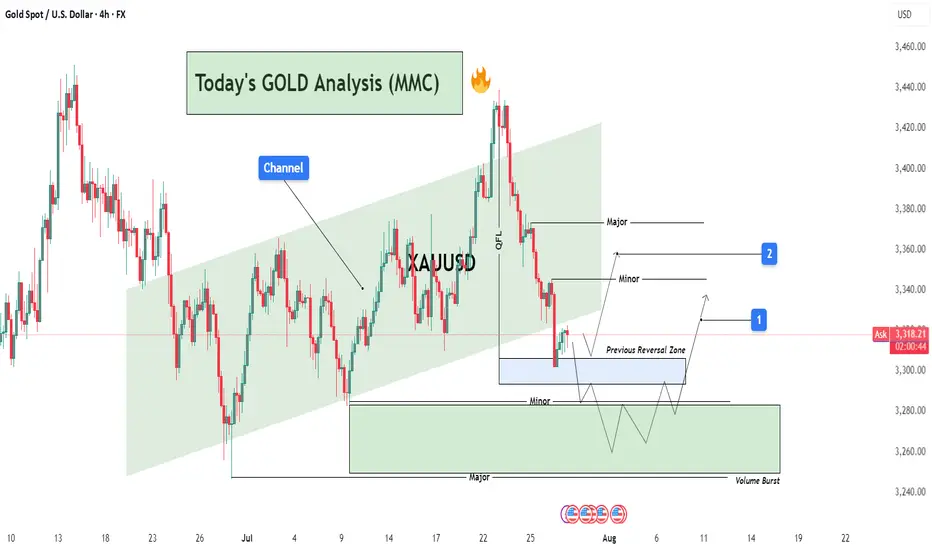
GOLD Analysis : XAUUSD Major Bullish Demand Zone🧠 Market Structure Context (MMC Framework)
Gold has recently shown a clean structural decline from its local highs within a well-defined ascending channel. This analysis highlights a reaction zone-based playbook, focusing on high-probability reversal scenarios guided by institutional footprints, volume reaction points, and MMC logic.
We’re currently trading near a previous reversal zone, where history tells us the market tends to shift behavior. Let’s dissect the key components.
📊 Key Technical Components
🔸 1. Ascending Channel Breakdown
The entire uptrend was respecting a well-established bullish channel until the recent drop violated the midline structure. This breakdown confirms a temporary bearish phase, with price breaking cleanly below a QFL base (Quick Flip Level)—a level where price reversed sharply before, which now acts as a major supply zone.
Psychological Insight: Channels give clues about momentum. Breaking below the lower band shows the market is preparing for a retest or a deeper liquidity hunt.
QFL Breakdown: Once broken, previous buyer confidence is shaken—inviting sellers to test demand zones.
🔸 2. Previous Reversal Zone (PRZ) Reaction
Currently, price is hovering inside the blue shaded Previous Reversal Zone, where bullish pressure previously kicked in. It’s a minor demand zone, but critical due to historical reaction. The projected structure shows a bounce from this area before deciding next direction.
MMC Insight: The first test of PRZ often leads to an initial reaction. But deeper liquidity lies just below in the major green demand zone.
🔸 3. Major Demand Zone + Volume Burst Area (The Real Magnet)
Below the PRZ lies the major reversal block—highlighted in green. This zone is significant because:
It aligns with a high-volume burst in the past, confirming institutional orders.
It's a cleaner structure level for smart money re-entry.
It also provides room for the “liquidity sweep” (stop hunt), collecting sell stops before a proper reversal.
💡 Expected Play: Price may fake out below PRZ, enter the major demand, and then initiate a multiple-leg bullish rally. Patience is key here.
🛠️ Trade Structure Outlook
✅ Scenario 1 – Aggressive Buyers (Marked "1"):
Buy from the current PRZ zone around $3,305–$3,315
Target: $3,340 (Minor Resistance)
Risk: Slippage into deeper demand zone
Stop-loss: Below $3,295
✅ Scenario 2 – Safer Entry from Major Demand (Marked "2"):
Let price dip into $3,270–$3,280 zone (green box)
Look for reversal candles or liquidity sweeps on lower timeframes
TP1: $3,330
TP2: $3,365 (Major Resistance)
📈 Resistance Levels to Watch:
Minor Resistance: $3,340 – Expect short-term pullbacks or hesitation.
Major Resistance: $3,365 – Key target for swing traders and potential reversal zone.
🔍 MMC Concepts in Action
✅ Channel Logic: Breakdown implies momentum shift—watch for retests.
✅ QFL: Previous bounce zone broken = supply now overhead.
✅ Volume Burst Zone: Strong historical reaction = institutional interest.
✅ Zone-to-Zone Trading: Instead of random entries, focus on logical zone interactions.
🧭 Conclusion – Path of Probability
Gold is currently in a transitional phase—shifting from bearish correction to potential bullish revival. Patience will reward those who wait for PRZ rejections or deeper liquidity taps. The MMC framework helps frame this market not as chaos, but a map of strategic reaction points.
Gold is fallingGold is in the neutral zone, and based on the candlesticks on higher time frames, trend line breakouts, etc., I see that it is correcting to the specified zone by the end of the week.

LONG XAUUSDLONG XAUUSD, XAUUSD is currently on support, long if fails to break and short if breaks and retests
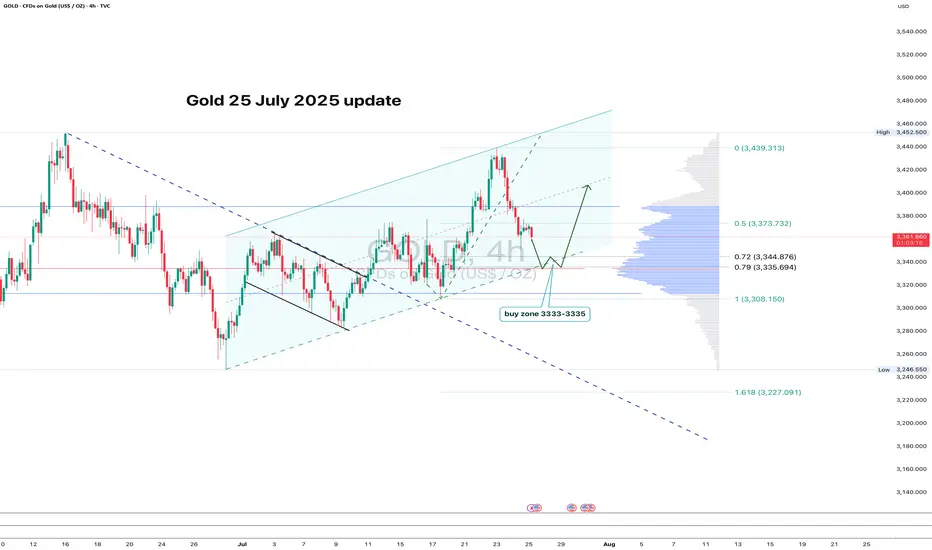
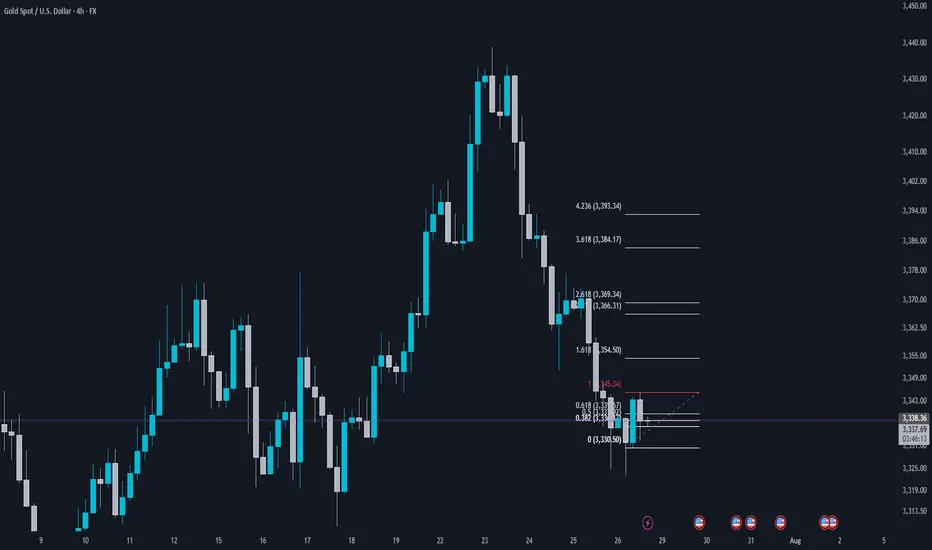
GOLD: clean pullback - now let’s see if support holdsGold continues to trade within an ascending channel on the 4H chart. After a local high, the price pulled back and is now approaching the key zone at 3333–3335. This area lines up with the 0.79 Fib retracement, the lower channel boundary, and a major volume cluster — a classic confluence zone.
If buyers show up here and we get a bullish reversal candle, this becomes a valid long setup with a tight stop just below the level. First target is 3373 (0.5 Fib), followed by a potential retest of the high near 3439.
The structure remains intact, the pullback is orderly, and volume supports the move. As long as the channel holds - the bias stays bullish.
XAUUSDHello Traders! 👋
What are your thoughts on GOLD?
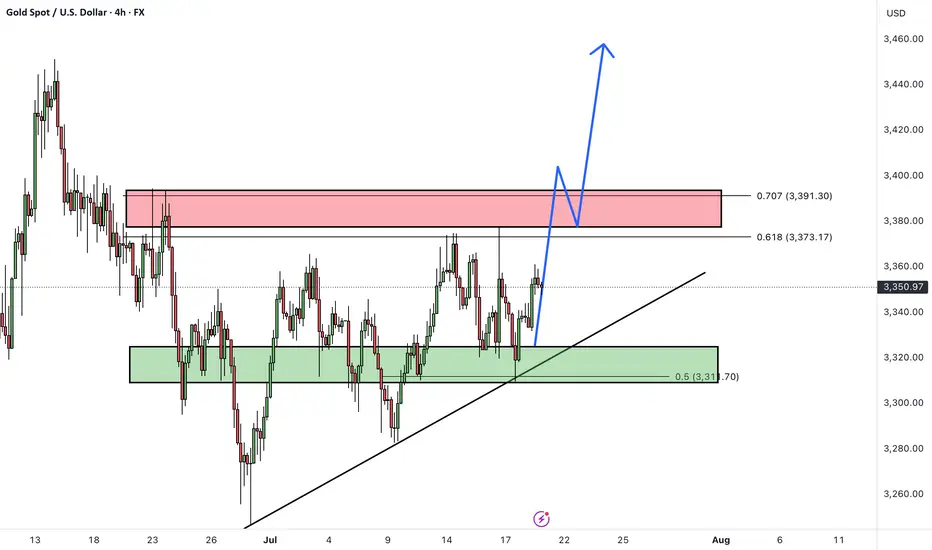
Over the past week, gold has been consolidating within a defined range, fluctuating between two key zones.
A break above the marked resistance zone (around $3380-3390) would confirm the start of the next bullish wave, opening the path toward higher targets.
As long as price remains above the identified support zone, our outlook stays bullish.
Key Levels to Watch:
Resistance: Breakout above $3380 needed to confirm continuation
Support: Holding this zone is essential to maintain the bullish structure
Is gold ready for a breakout after consolidation? Share your thoughts below! 🤔👇
Don’t forget to like and share your thoughts in the comments! ❤️
XAUUSD Smart Money Technical Analysis – Bullish Potential XAUUSD Smart Money Technical Analysis – Bullish Potential from Strong Support
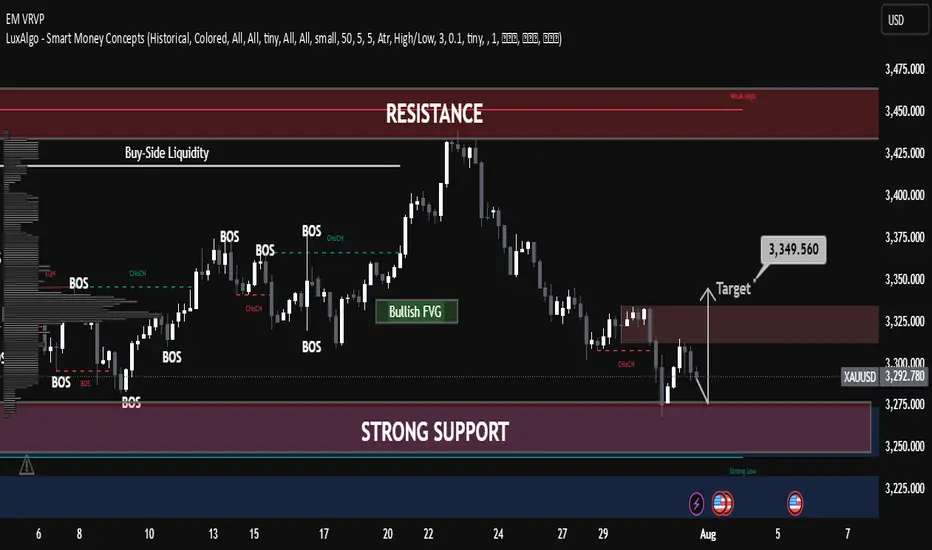
Gold (XAUUSD) is currently trading around $3,291.780, showing a potential bullish reversal setup from the strong support zone after a clear liquidity sweep and market structure shifts.
🔍 Key Technical Highlights:
✅ Strong Support Zone (Demand)
Price is reacting from a major demand zone (Strong Low) between $3,275 – $3,225, a level that previously triggered bullish rallies.
Multiple Breaks of Structure (BOS) and CHoCH indicate previous bullish control and a possible re-accumulation phase.
✅ CHoCH Near Support
A recent Change of Character (CHoCH) around the support area shows the first signs of smart money accumulation.
Liquidity below recent lows has been swept, triggering possible bullish intent.
✅ Bullish FVG (Fair Value Gap)
A clear Bullish FVG remains unmitigated around the mid-range, offering target confluence at $3,349.560.
Price may aim to rebalance inefficiency and fill the FVG as part of the bullish move.
✅ Resistance Zone Above
The resistance area near $3,325 – $3,350 acts as a short-term target for long positions.
Further resistance lies at the Buy-Side Liquidity & Weak High zone around $3,450 if momentum sustains.
🧠 Smart Money Concept Interpretation:
Liquidity Grab: Price dipped into strong demand to collect sell-side liquidity before potential reversal.
CHoCH + BOS Alignment: Indicates the market may now transition into a bullish phase.
FVG as Magnet: Price is drawn toward unfilled value zones—ideal for bullish target projection.
🎯 Trade Idea (Educational Purposes Only):
Bias: Bullish
Entry: Around current zone ($3,290)
Target: $3,349.560 (FVG zone)
Invalidation/SL: Below strong low (~$3,225)
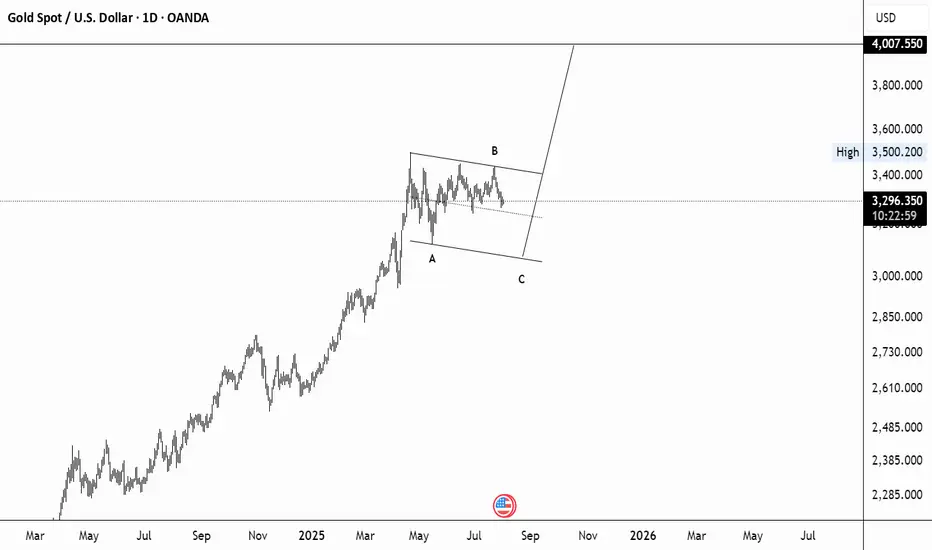
gold 4ooo projectionHello, me thinks gold is ready for a midterm correction, which in turn can propel it to 4ooo. This is just an idea, not financial advice. Cheers
GOLD NON FARM ANALYSISAs you can see market is moving round and round inside bullish FVG from thursday night 31 july and making sell side liquidity which is till 3382 so possible move can be an expansion which will be bullish.4H bullish FVG indicates that market does not wants to go down.

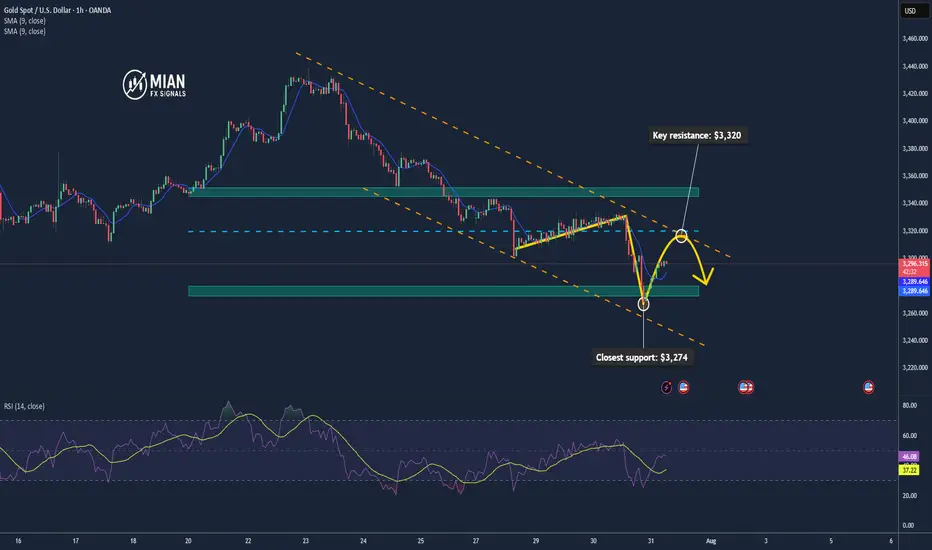
Gold May Rise Technically after Testing the $3,300 Zone📊 Market Overview:
Spot gold is trading around $3,295–$3,301/oz, influenced by slightly lower U.S. Treasury yields and a softer dollar tone. Analyst consensus from Reuters projects gold likely to stay above $3,220/oz through 2025 and possibly hit $3,400 in 2026 amid continued safe-haven demand
📉 Technical Analysis:
• Key resistance: $3,320 / $3,345
• Closest support: $3,274 – $3,280
• EMA09: Price is currently below the 9 period EMA on H1, indicating a short-term bearish bias.
• Candlestick / volume / momentum: There was a minor bounce from the support zone around $3,274, but volume remains low. RSI isn't oversold, suggesting room for technical pullback.
📌 Outlook:
Gold may experience a technical rebound if it holds above $3,280. A breakout above $3,320 would likely require clear catalyst—such as weak U.S. data or a dovish Fed tone.
💡 Suggested Trading Strategy:
SELL XAU/USD: $3,320 – $3,323
🎯 TP: 40/80/200 pips
❌ SL: $3,326
BUY XAU/USD: $3,279 – $3,282
🎯 TP: 40/80/200 pips
❌ SL: $3376
XAUUSD long day trade idea hello
day trading idea long up to 3372-3383 price zone
fibonaci levels , maybe 3390
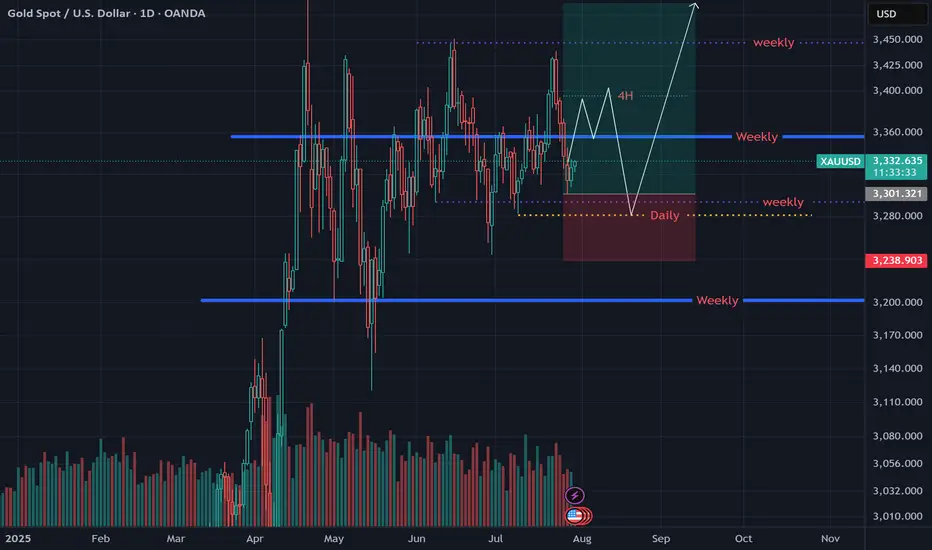
XAUUSD Outlook – July 29, 2025
Gold enters a high-risk environment starting today.
All eyes are on Jerome Powell's speech, which will signal whether the Fed remains firm on its hawkish stance or adopts a more dovish tone.
📈 That said, a broader look at the chart suggests the market has already aligned itself with the dominant trend.
🗓️ In addition to today’s speech, tariff-related news expected on Friday doesn’t seem likely to disrupt the ongoing bullish momentum in gold — or in crypto markets, for that matter.
🧠 That’s the general market read I'm sensing right now, but we’ll have to see how it unfolds.
🎯 Personally, I still view the $3290 level as a solid buy zone, with the potential to become one of gold’s historical bottoms.
Gold Next Move Possible Hello Traders, Today I’m back with another idea.
As you know gold has changed the trend from bullish to the bearish.
The gold has fallen from the area 3438 to 3351. Now the current price is 3358.
I’m looking for the sell zone, In my view gold will drop till 3310.
I’m monitoring the sell zone 3364-3371, when the market touches the zone, I will add sell and my target will be 3310. Keep in bear my first target is 3351, second target is 3337 and the last target is 3310.
In the case if price breaks the 3377 area then we will have to wait until confirmation for another setup.
Stay Tune for every update.
Kindly share your ideas and leave positive comments. Thanks Everybody.

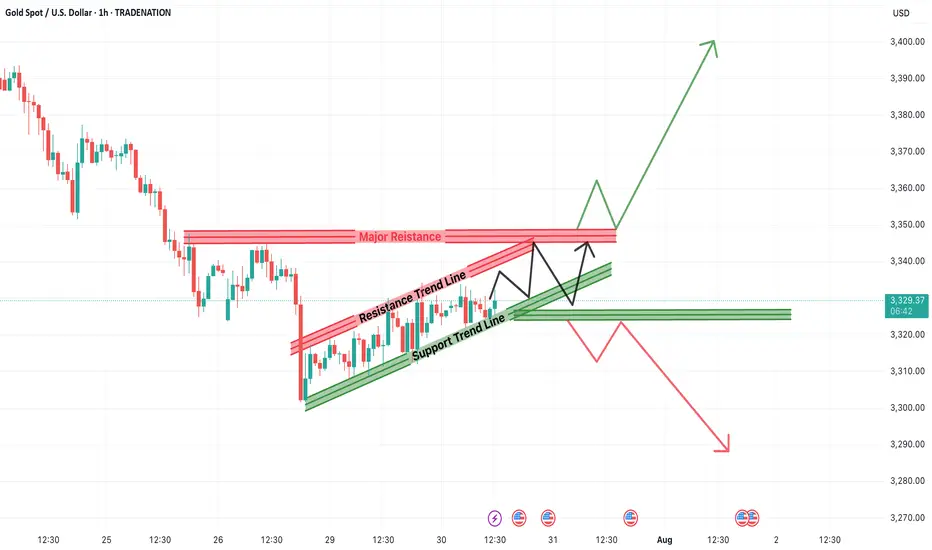
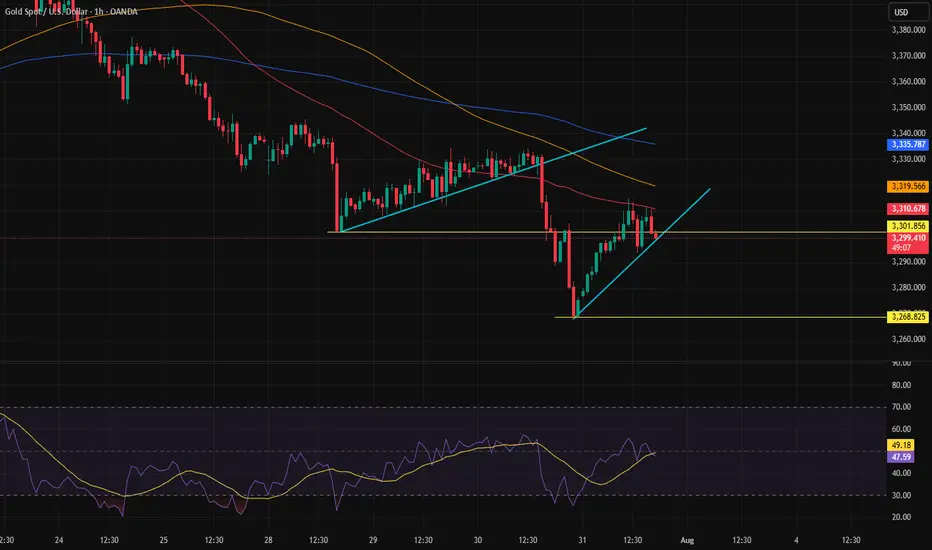
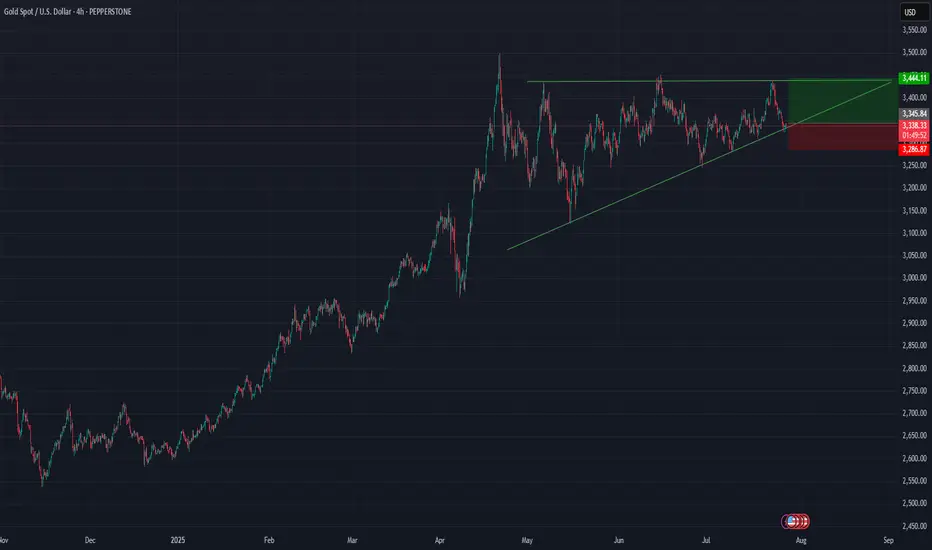
Will Gold Break Higher or Resume the Downtrend?Gold has been trading within a defined rising channel pattern, forming a short-term consolidation phase after a significant bearish leg. The current setup presents a critical inflection zone where Gold (XAUUSD) could either break out above the resistance trendline and major resistance zones or retrace and resume the prior downtrend.
Traders and investors should pay close attention to the price behavior around these key levels for possible high-probability trading opportunities.
📊 Technical Breakdown
1. Rising Channel Pattern
Gold has been bouncing between a support trend line and a resistance trend line, forming a rising channel. This indicates a controlled upward movement or short-term relief within a broader downtrend.
Support Trendline: Has been respected multiple times and offers a key reference point for bullish continuation.
Resistance Trendline: Acting as a cap on the short-term rallies.
This pattern represents a state of consolidation and indecision, often preceding a strong breakout in either direction.
2. Major Resistance Zone Ahead
The region around $3,345–$3,355 is stacked with:
Previous supply zones.
Confluence of the channel resistance and historical price rejection.
Psychological level near $3,350.
This zone is the make-or-break point for bulls. A successful breakout above this resistance could open the doors for a strong bullish continuation targeting levels such as:
$3,370
$3,390
$3,400+
But without a convincing close above this zone, bullish attempts may get rejected, resulting in a pullback or even breakdown.
3. Immediate Support Zone
On the downside, $3,320–$3,325 is a key short-term support level:
Aligned with the lower boundary of the channel.
Previous breakout retest zone.
Demand area observed in past bounces.
If this zone fails to hold, Gold could witness a strong decline, with potential targets at:
$3,310
$3,290
$3,275
🧠 Two Scenarios for Traders
✅ Bullish Breakout Scenario:
Trigger: Price breaks above $3,355 and sustains.
Retest Opportunity: If price comes back to test the breakout zone with a bullish engulfing candle or pin bar, it can serve as confirmation.
Target Zones: $3,370 / $3,390 / $3,400+
Stop Loss: Below the breakout point or recent higher low inside the channel (~$3,320)
❌ Bearish Breakdown Scenario:
Trigger: Breakdown of the support trendline and close below $3,320.
Confirmation: A bearish retest or continuation candle adds strength to the setup.
Target Zones: $3,310 / $3,290 / $3,275
Stop Loss: Above $3,335 (recent high)
📝 Final Thoughts
The XAUUSD 1H chart is setting up for a volatile move as price action coils between strong support and resistance. The rising channel within the larger downtrend makes this an ideal setup for both breakout traders and trend followers.
For bullish traders, the best entry lies above the resistance trendline, ideally after a retest. For bearish traders, a breakdown below the support line confirms downside momentum continuation.
In either direction, a clear break from this consolidation channel is likely to deliver a fast, directional move. Patience is key—wait for a clean breakout or breakdown before entering large positions.
=================================================================
Disclosure: I am part of Trade Nation's Influencer program and receive a monthly fee for using their TradingView charts in my analysis.
=================================================================