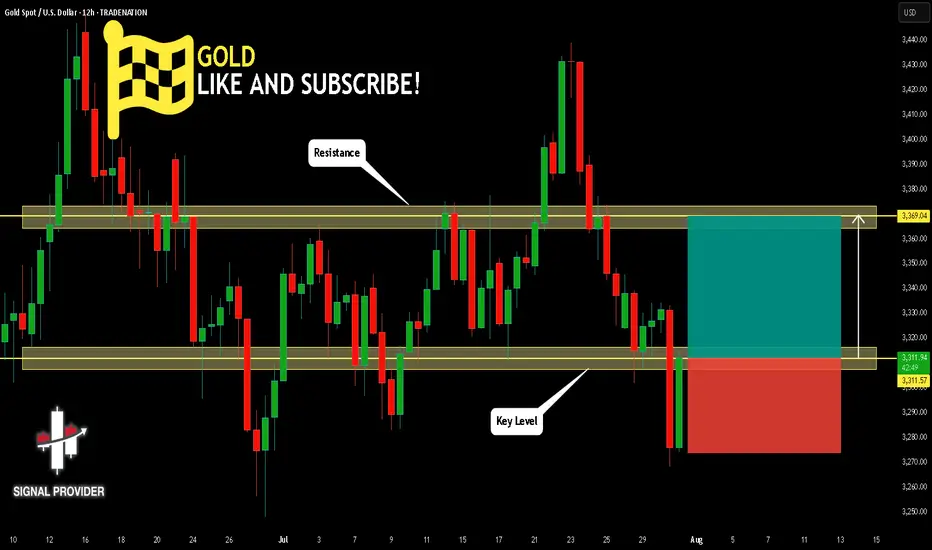
GOLD Will Go Higher From Support! Buy!
Here is our detailed technical review for GOLD.
Time Frame: 12h
Current Trend: Bullish
Sentiment: Oversold (based on 7-period RSI)
Forecast: Bullish
The market is testing a major horizontal structure 3,311.57.
Taking into consideration the structure & trend analysis, I believe that the market will reach 3,369.04 level soon.
P.S
The term oversold refers to a condition where an asset has traded lower in price and has the potential for a price bounce.
Overbought refers to market scenarios where the instrument is traded considerably higher than its fair value. Overvaluation is caused by market sentiments when there is positive news.
Disclosure: I am part of Trade Nation's Influencer program and receive a monthly fee for using their TradingView charts in my analysis.
Like and subscribe and comment my ideas if you enjoy them!
GOLDCFD trade ideas
Gold Market Update: Major Support at and Supply atGold is recovering after a strong drop from the previous range high. Price is approaching a 4H Order Block near the 3300–3310 zone, which may act as a supply area. A minor liquidity zone has just been tapped, suggesting a potential short-term rejection.
The major support lies at 3269, which sparked the recent bullish move. If price rejects from the OB zone, a pullback toward this support is likely. However, a clean break and hold above the OB may signal further upside.
📌 Key Levels:
Supply Zone: 3300–3310
Support: 3269
🧠 Wait for clear confirmation before executing trades.

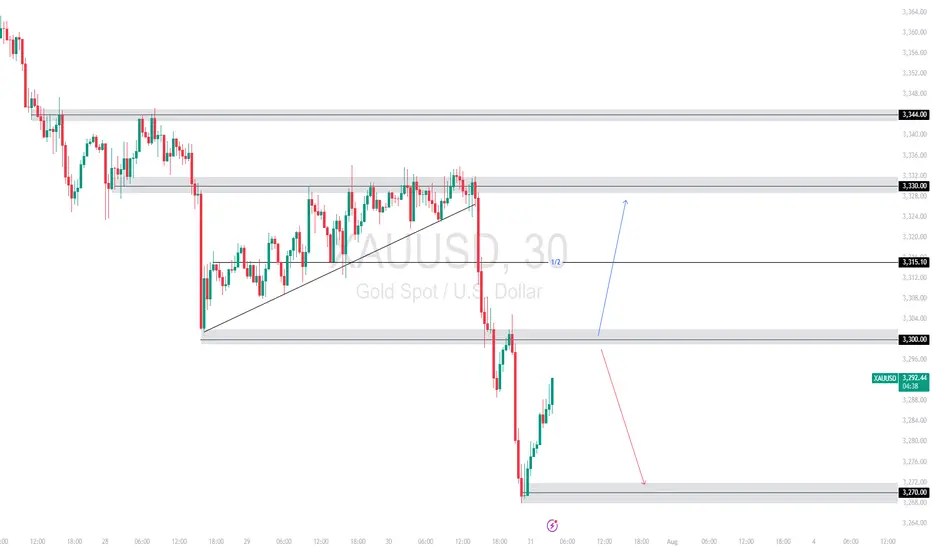
SHORT-TERM TECHNICAL ANALYSIS FOR GOLDXAUUSD broke down sharply from the 3,330 🔽 resistance zone, violating trendline support and slicing through 3,300 🔽. Price has now found temporary support at 3,270 🔽 and is attempting a retracement.
Support Levels: 3,270 🔽
Resistance Levels: 3,300 🔼, 3,315 🔼, 3,330 🔼
Bias:
🔼 Bullish: If price breaks and retests above 3,300, a push toward 3,315 or even 3,330 is possible.
🔽 Bearish: Failure to reclaim 3,300 could lead to continued downside toward 3,270 or even lower.
📛 Disclaimer: This is not financial advice. Trade at your own risk.
Gold Buy I think gold is still a buy . It formed tripple bottom and retest has been done... time to fly ATH
XAUUSD POTENTIAL INTRADAY SELL OPPORTUNITY In today’s trading session, we’re considering shorting Gold from the current price of 3306.65 after the previous pullback completed at the high of 3438.00 our expected target profit is at 3249.56

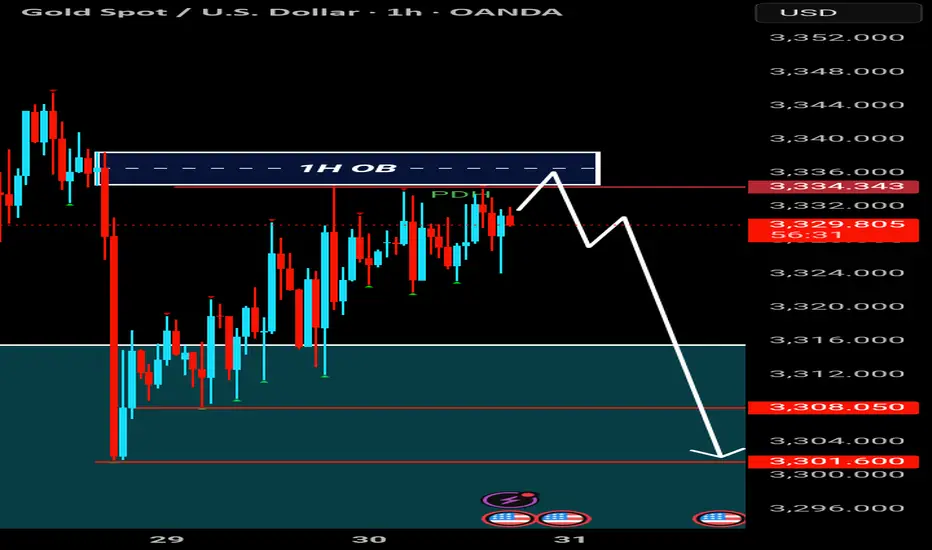
Gold Down After Taping 1H OB. This is my view. Not Advice. I,m Bearish Side. Because Also Have PDH Where resting Alot Liquidity, After Sweep gold tap on and down.
XAUUSD: July 30th Market Analysis and StrategyGold Technical Analysis:
Daily Chart Resistance: 3351, Support: 3300
4-Hour Chart Resistance: 3340, Support: 3310
1-Hour Chart Resistance: 3334, Support: 3315.
Trading risk will increase today. We will focus on the Federal Reserve's interest rate decision and the ADP employment data, which are expected to increase market liquidity. If trading, please avoid news releases.
On the daily chart: Bollinger Bands are moving horizontally, with gold prices trading above the lower band. The MACD indicator has formed a downward death cross, indicating a release of bearish momentum. The RSI indicator has fallen back into the overbought range of 50-40, indicating a clear bottoming out and rebound in gold prices.
On the 4-Hour Chart: Bollinger Bands are narrowing, with gold prices trading near the middle band. The MACD indicator is beginning to turn upward, and the RSI is showing an oversold rebound. Gold prices are poised for an upward rebound! The NY market is focusing on the $3351 resistance level above and the $3308 support level below.
SELL: 3351near
BUY: 3315near

Gold--sellWell, gold is having an interesting moment. It is currently correcting in a downtrend and is holding steady. I don't feel any strength in its trend. How far will it correct to the specified area?
Gold Analysis and Trading Strategy | July 30✅ Fundamental Analysis
🔹 Short-Term Decline in Safe-Haven Demand:
Recent developments, including the U.S.-EU tariff agreement and the resumption of U.S.-China trade talks, have temporarily eased market tensions, weakening gold's appeal as a safe-haven asset.
🔹 Dollar Rebound Pressures Gold:
The U.S. Dollar Index rebounded sharply after a second bottoming attempt, breaking above the key 98.10 resistance level. This strengthened pressure on gold and limited its upward potential.
🔹 FOMC Rate Decision in Focus:
The Federal Reserve will announce its interest rate decision today. The market’s focus is on whether a signal for a potential rate cut in September will be delivered.
If the statement is hawkish, downplaying the chances of a rate cut, the dollar may strengthen further, possibly pushing gold to test support near $3300.
If the Fed adopts a dovish tone or hints at a September rate cut, it may trigger a breakout above the $3350 resistance level.
🔹 Key U.S. Economic Data Ahead:
Today also brings the release of ADP employment data and the Q2 GDP revision.
If GDP growth exceeds expectations (>2.0%), it may strengthen the case for prolonged higher interest rates, which would be bearish for gold.
If data disappoints, it could reinforce dovish expectations and support a rebound in gold prices.
✅ Technical Analysis
🔸 Gold continues to fluctuate within the $3333–$3320 range, reflecting a market in wait-and-see mode ahead of the Fed decision.
🔸 Short-term price action still favors the bearish side, but strong support below and persistent geopolitical risks are offering some downside protection for gold.
🔴 Resistance Levels: 3355 / 3375 / 3380
🟢 Support Levels: 3310 / 3300 / 3280
✅ Trading Strategy Reference:
🔰 If the price rebounds to the 3355–3365 zone, consider light short positions
⛔Stop-loss: Above 3380
🎯 Target: Around 3320
🔰 If the price pulls back and stabilizes around 3310–3300, consider short-term long positions
⛔ Stop-loss: Below 3285
🎯 Target: 3340
🔰 If the price breaks below 3300, bearish momentum may extend toward 3280
🔰 If the price breaks above 3355, the bearish structure will likely fail, and gold may resume its upward trend
✅ With the market entering a high-impact news period at month-end, volatility is expected to increase significantly. Traders should set stop-losses strictly and manage position sizes carefully to mitigate the risks of sudden market moves.

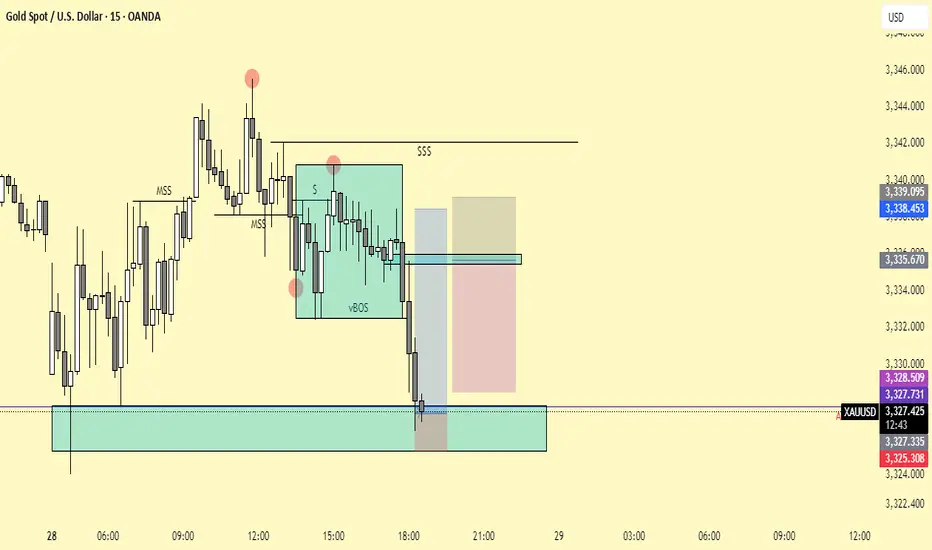
XAUUSD 5M SUPPLY SETUPDuring the Asia-to-London session, price was in a clear uptrend, printing higher highs. However, in the pre-New York session, momentum shifted , price failed to break the recent high and instead formed a new low, eventually breaking structure with a lower low and confirming a trend reversal. This move left a clean supply zone behind. Price later retraced to that supply zone and showed strong rejection with a clear wick reaction, signaling potential selling pressure. I waited for the candle break and entered short, placing stops above the highest wick within the zone. Targeted a 1:2 R:R. Price consolidated briefly but eventually hit target, securing profits and wrapping up the session with discipline and precision.

XAUUSD Analysis: Watching 3323.52 as Potential Support-Turn-ResiPrice action on XAUUSD suggests that the 3323.52 level may act as a key area of interest. Following the recent break below a structural low, I am anticipating a possible retracement toward this zone, where it could serve as a support-turned-resistance level.
Should price react to this area and fail to reclaim it, we may see a continuation of bearish momentum driving price lower.
📌 Key Level: 3323.52
📉 Bias: Bearish below this zone
🔍 Confirmation: Watching for rejection or bearish structure on lower timeframes around the level

Gold repeatedly tested lows. Will it break through?On Monday, the Asian market opened low and rose in the early trading. In the European trading, it rose to around 3345. The European trading was under pressure and fluctuated. The US trading began to accelerate its decline, and the lowest point reached around 3302. Then it continued to fluctuate in the range of 3300-3320.
On July 27, the United States and the European Union reached a framework trade agreement; the agreement reduced market concerns about the global economic recession, promoted the attractiveness of risky assets, and boosted the stock market and the US dollar. Although Trump has repeatedly pressured for a substantial interest rate cut, the market has strong expectations for a September interest rate cut. The current expectation of maintaining a stable interest rate dominates the market, coupled with the strength of the US dollar, which puts gold prices under downward pressure in the short term.
Gold opened low in the early trading on Monday and then rebounded to recover the losses, but then fell below the low again, and the daily line closed in the negative, and now it has formed a four-day negative decline. MA5 and 10-day moving averages form a dead cross, and there is a downward turn.
The focus on the upper side is around Monday's high of 3345, which is also near the current position of MA5, 20, and 30-day moving averages. Below this position, gold is weak; if it breaks upward, it is necessary to prevent the possibility of a rebound correction.
The lower support first focuses on the 3300 integer mark; secondly, focus on the area around 3285-3275.
Operation strategy:
Short near 3340, stop loss 3350, profit range 3320-3300;
Long near 3300, stop loss 3290, profit range 3320-3340.
Before the release of US data on Tuesday, you can maintain this operation strategy; after the data is released, adjust the strategy based on the impact of the data.
XAUUSD approaches a strong buy zoneGold is approaching a strong buy area. Aggressive traders set pending orders whereas cautious ones wait for some confirmation signals in the range of such zones. I expect buyers to push price back up for atleast half day today Follow risk management to enjoy your trading journey.
Target1 3374

July 29, 2025 - XAUUSD GOLD Analysis and Potential OpportunitySummary:
The downtrend continues, but a technical rebound is possible today.
Keep a close eye on the 3310 level — if price holds, bulls may fight back and we look for long setups on pullbacks.
If 3310 is broken, the bearish momentum is likely to extend, and we shift to selling on failed rallies. The next significant support lies at 3283.
🔍 Key Levels to Watch:
• 3384 – Resistance
• 3375 – Key resistance
• 3365 – Resistance
• 3345 – Resistance
• 3320–3325 – Key resistance zone
• 3310 – Critical support
• 3300 – Psychological level
• 3283 – Major support
• 3275 – Support
• 3265 – Support
📈 Intraday Strategy:
• SELL if price breaks below 3310 → target 3305, then 3300, 3290, 3283
• BUY if price holds above 3320 → target 3325, then 3336, 3345, 3350
👉 If you find this helpful or traded using this plan, a like would mean a lot and keep me motivated. Thanks for the support!
Disclaimer: This is my personal view, not financial advice. Always use proper risk control.

Gold analysis Gold (XAU/USD) Technical Analysis
Date: July 28, 2025
Market Context
Gold (XAU/USD) is currently trading at $3,313.01, showing a modest gain of +0.32% on the day. From a Smart Money Concepts (SMC) perspective, price action is now positioned at a high-probability demand zone, presenting an attractive opportunity for long positions.
Key Technical Observations
Liquidity Grab at $3,308
Price has recently swept the liquidity resting below $3,308, indicating the possible completion of a stop-hunt move orchestrated by institutional players. This move created an ideal setup for a bullish reversal from a zone where weak longs have been shaken out.
Discounted Price Zone (89% Fibonacci)
The market has retraced deeply into a discounted region, reaching the 89% Fibonacci retracement level of the most recent bullish leg. This zone coincides with a previously identified demand block, enhancing the confluence for potential bullish continuation.
Market Structure & Order Blocks
The current structure shows a bullish intent with price revisiting a bullish order block that previously led to a strong rally. The reaction from this block is key—holding above $3,300 would confirm buyers stepping in with conviction.
Internal Liquidity Void (Imbalance)
A visible inefficiency (price imbalance) exists between $3,345 and $3,398, acting as a magnet for price in the short-to-mid term. This inefficiency aligns perfectly with SMC principles that favor price filling these voids.
Bullish Targets
If price holds and confirms bullish intent from the current zone, we expect a move toward the following key levels:
Target 1: $3,345
This is the midpoint of a previous consolidation range and also lies just above the 50% Fibonacci level.
It also aligns with a minor supply area and could serve as a first TP level.
Target 2: $3,398
This is the upper bound of a key supply zone that previously initiated a strong sell-off.
It coincides with the 0.00% Fib retracement, marking the origin of the most recent bearish leg.

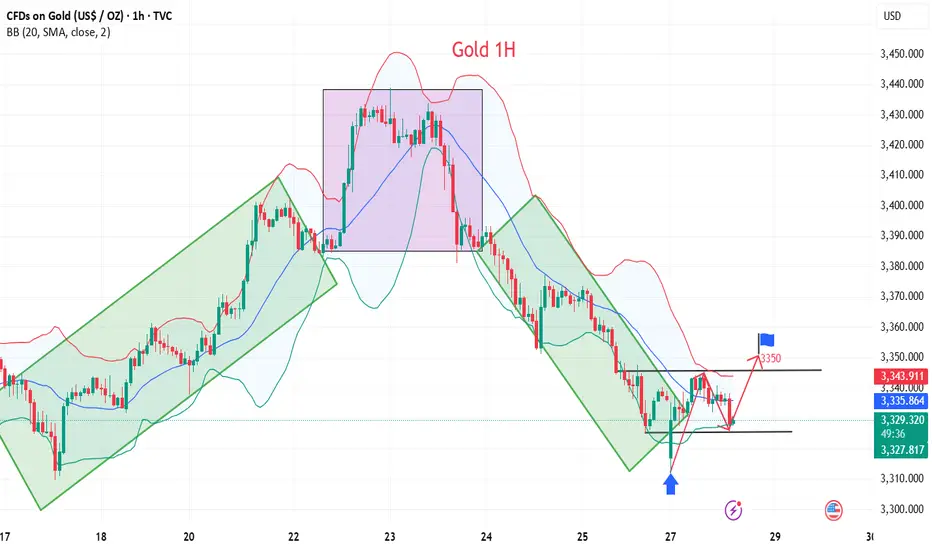
Gold short-term rise waiting for breakthrough
💡Message Strategy
During the Asian trading session, gold prices rebounded slightly from $3,320, filling the short gap at the start of the new week. As investors chose to stay on the sidelines before the Fed's two-day monetary policy meeting, the bullish force of the US dollar temporarily weakened, providing support for gold, an interest-free asset.
However, with the 15% tariff agreement between the United States and Europe and the positive progress of trade easing between the United States, Japan and the United States, market risk appetite has rebounded, weakening the appeal of gold as a safe-haven asset.
According to market surveys, "The current optimistic atmosphere of trade has weakened the safe-haven demand for gold, while the weakening of the US dollar has provided support for gold prices. The two forces offset each other, causing gold to fluctuate."
Investors are focusing on the FOMC meeting to be held on Tuesday. Although Trump continues to pressure the Fed to cut interest rates, the market generally expects that the interest rate will remain unchanged at this meeting because the US labor market remains strong.
In addition to the interest rate decision, this week will also usher in the US second quarter GDP estimate, PCE price index and non-farm payrolls report, all of which may have a significant impact on gold.
📊Technical aspects
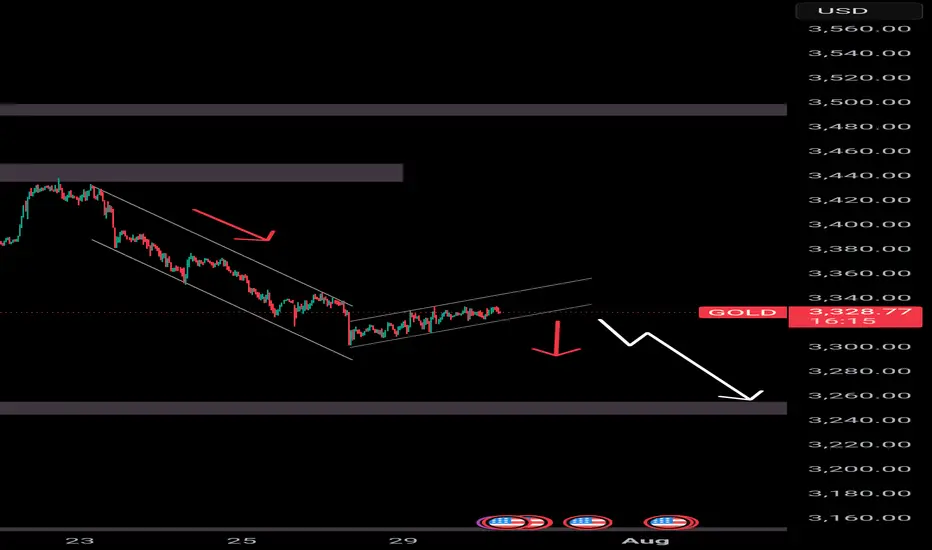
From the technical trend, gold triggered a rapid correction after breaking below the lower edge of the short-term rising channel and the 50% Fibonacci retracement level last week. The current gold price stabilized in the $3,320 area and received some buying at the 61.8% Fibonacci support.
However, it is worth noting that the 200-period moving average on the 4-hour chart is at $3,350, which constitutes an important technical resistance for a short-term rebound. On the contrary, if gold breaks through the $3,350 level, gold will continue to develop a bullish pattern.
From the technical trend, gold triggered a rapid correction after falling below the lower edge of the short-term rising channel and the 50% Fibonacci retracement level last week. The current gold price stabilized in the $3,320 area and received some buying at the 61.8% Fibonacci support.
However, it is worth noting that the 200-period moving average on the 4-hour chart is at $3,350, which constitutes an important technical resistance for a short-term rebound.
On the contrary, if gold breaks through the $3,350 line, it will be expected to attack the $3,371-3,373 area in the short term, and further look to the key pressure levels of $3,400 and $3,440.
💰Strategy Package
Long Position:3320-3325,SL:3300,Target: 3350
LONG ON GOLD (XAU/USD)Gold is at a nice demand level with the dollar currently falling.
I will be buying gold looking to make over $102 move to the previous high.
Thats over 1000 pips on gold.
GOLD imminent possible buys up to 3,370 This week’s price action on GOLD is shaping up to be very interesting. After weeks of sustained bearish pressure, price has now entered a discounted 2hr demand zone sitting at a swing low, which makes it a high-probability area for a bullish reaction, especially as markets open.
If we do get the expected bullish reaction from this level, I’ll be watching the 3,370 region, where there’s a clean 5hr supply zone. If price reaches that level, I’ll be looking out for distribution and a potential short setup from there.
Confluences for GOLD Longs:
Price has been very bearish recently, so a retracement is expected
Currently sitting in a discounted 2hr demand zone
The overall long-term trend is still bullish
Early signs of accumulation and bullish reaction from this zone
P.S. If price fails to hold this current demand zone and breaks lower, then bearish momentum may continue. In that case, I’ll look for new long opportunities around 3,290 where a deeper demand zone exists.

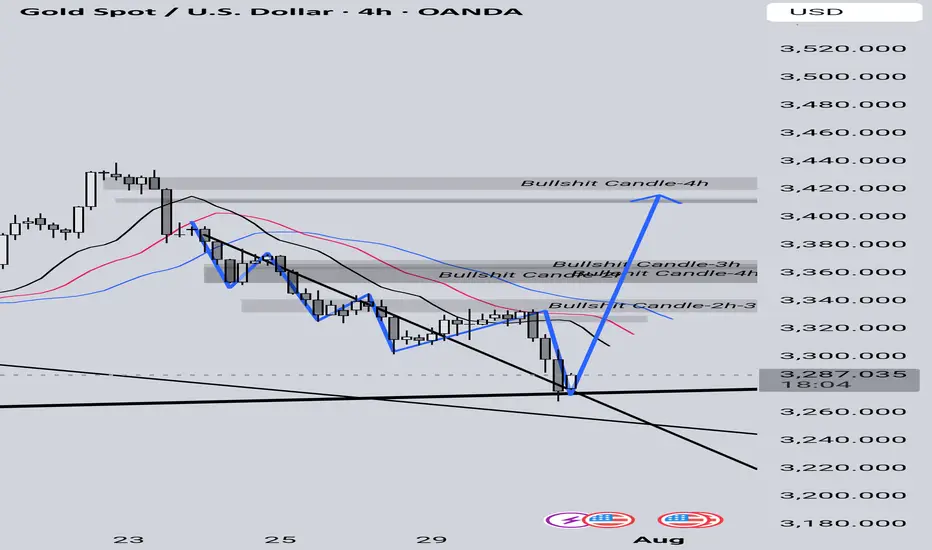
Interest rate cuts intensify. Will gold break out?No noteworthy news events occurred this weekend. So, we'll have to wait and see how the market interprets gold's trajectory at the start of next week.
From the 4-hour chart, the first thing we can confirm is that the 3363 level is unlikely to be the high point of this pullback. Because Friday's non-farm payroll report re-priced expectations for a rate cut, Friday's figures were merely a reaction from the US market. Furthermore, after hitting 3355, the price retreated slightly to 3340 before embarking on a second wave of gains.
The Asian and European markets were closed at the time, so when Monday opens, the Asian and European markets will likely also interpret expectations for a rate cut and the impact of the non-farm payroll data on the market.
Therefore, gold is likely to continue its upward trend next Monday. Currently, the first resistance level is around 3375-3380. It's uncertain whether this resistance can be overcome, but if it breaks through and stabilizes above 3380, it's likely to continue to move towards 3400.
On the other hand, if 3375-3380 holds strong resistance, a retest of Friday's retracement lows of 3330-3340 is possible.
Thus, avoid blindly shorting at the opening of next week. If the market retraces back to around 3330, then a long position is possible. If the market opens directly testing the upward pressure level, then do not chase the long position, as there is a possibility of a pullback at the pressure level.

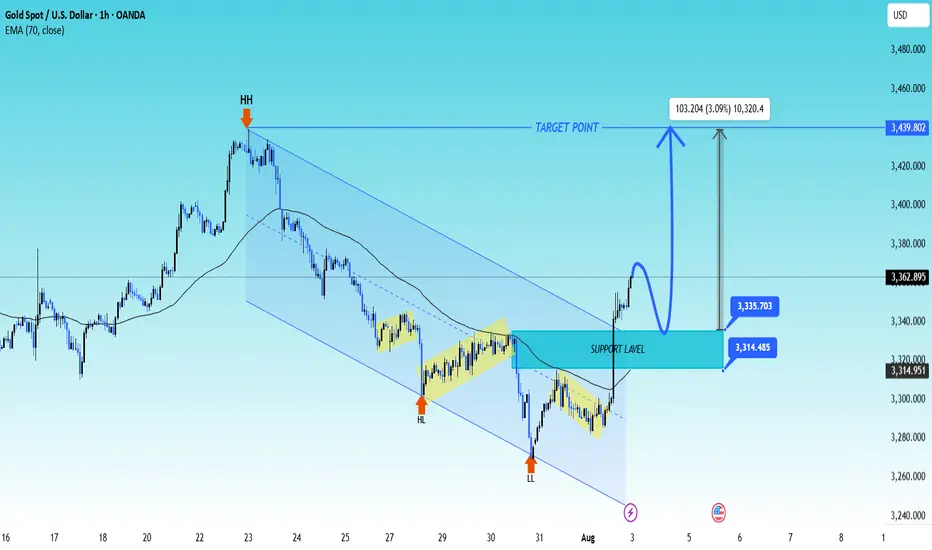
XAU/USD – Bullish Breakout Toward 3,440 Target🔹 Trend & Structure:
Market formed a Higher High (HH) followed by a Lower Low (LL), indicating bearish correction within a falling channel.
Price then created a Higher Low (HL) suggesting a potential trend reversal.
🔹 Channel Breakout:
Price broke above the descending channel, confirming bullish momentum.
A strong bullish candle closed above the 70 EMA, showing further strength.
🔹 Support Zone:
A support level between 3,314.485 – 3,335.703 is now established, which was previous resistance turned support.
🔹 Target Projection:
Using measured move strategy, the projected bullish target is around 3,439.802, a 3.09% move from the breakout zone.
🔹 Volume & Momentum:
Sharp bullish impulse indicates increased buying interest, supported by possible retest before continuation.
📈 Conclusion:
Bullish breakout confirmed. Ideal strategy:
🔹 Entry: On retest of the support zone (3,335 area)
🔹 Stop-loss: Below 3,314
🔹 Take-profit: Near 3,439
✅ Strategies used:
Trendline & Channel Analysis
Support/Resistance.
EMA (70) confirmation.
Price Action (HH, LL, HL)
Measured Move Target.
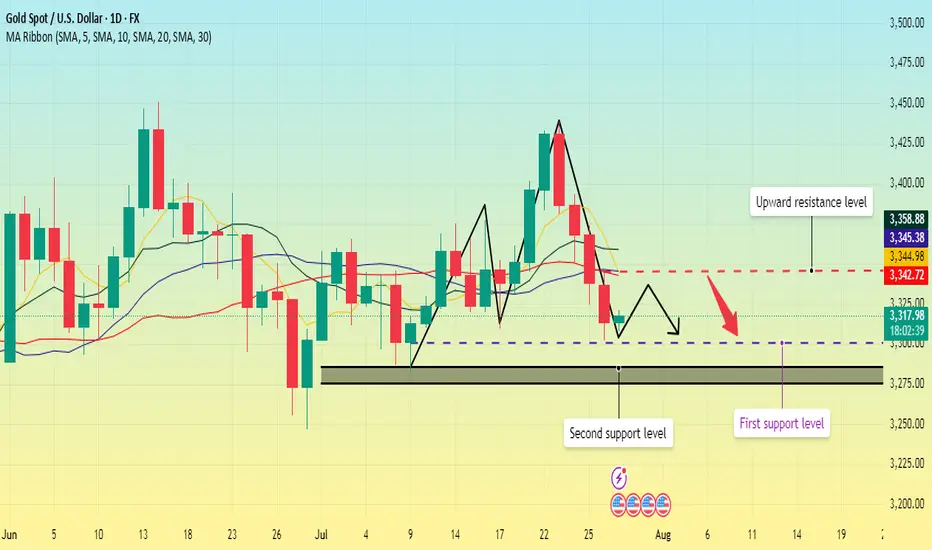
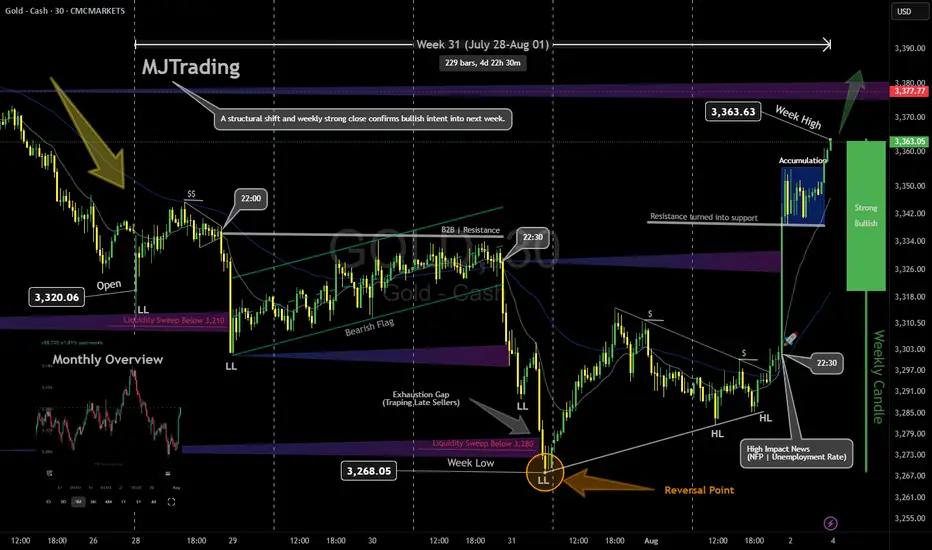
GOLD Weekly Recap & Outlook (Week 31 | July 28 – Aug 01)Note: Some elements may shift depending on your screen size. View the full snapshot in perfect layout:
📈 CAPITALCOM:GOLD
Timeframe: 30m | MJTrading View
⸻
🔹 Weekly Performance
• Open: 3,320.06
• High: 3,363.63
• Low: 3,268.05
• Close: 3,363.05
Gold delivered a classic Smart Money move this week: liquidity sweep, structural shift, and bullish expansion.
⸻
🔹 Price Action Breakdown
1️⃣ Early Week: Bearish Continuation
• Price opened around 3,320 with a gap and extended last week’s bearish leg.
• Formed lower lows (LL) and a bearish flag, signaling continuation.
2️⃣Midweek: Liquidity Grab, Reversal Point and
• Last Bearish leg marks the exhaustion gap and stop run.
• Market printed a liquidity sweep below 3,310 then 3,280 (weekly low), trapping late sellers.
• Smart Money likely absorbed sell-side liquidity before initiating the reversal leg.
• This aligns perfectly with SMC principles: sweep → accumulation → expansion.
3️⃣ Late Week Rally
• Following NFP & Unemployment Rate news, price broke 3,333 and rallied strongly to 3,363.63 confirming a Bullish Market Structure Shift (MSS).
• Resistance turned into support, validating the accumulation phase.
• Price rallied strongly to 3,363.63,.
• The weekly candle flipped bullish, closing near the high, with Smart Money leaving a clear footprint of accumulation and expansion.
⸻
🎯 Key Levels & Outlook
• Support: 3,355 → 3,333 - 3,340
• Resistance: 3,377 → 3,380+
• Bias: Bullish above 3,333.
• Watch for liquidity sweeps of intraday lows to catch new long entries, targeting 3420-3440.
⸻
💡 MJTrading View:
A structural shift and weekly strong close confirms bullish intent into next week.
As long as 3,333 holds, dips are buying opportunities.
⸻
Please share your opinions...
#MJTrading #GoldAnalysis #SmartMoney #LiquiditySweep #PriceAction #MarketStructure #Forex #TradingView #ChartDesigner #BullishMarket
Fortnight Overview:
Psychology Always Matters:
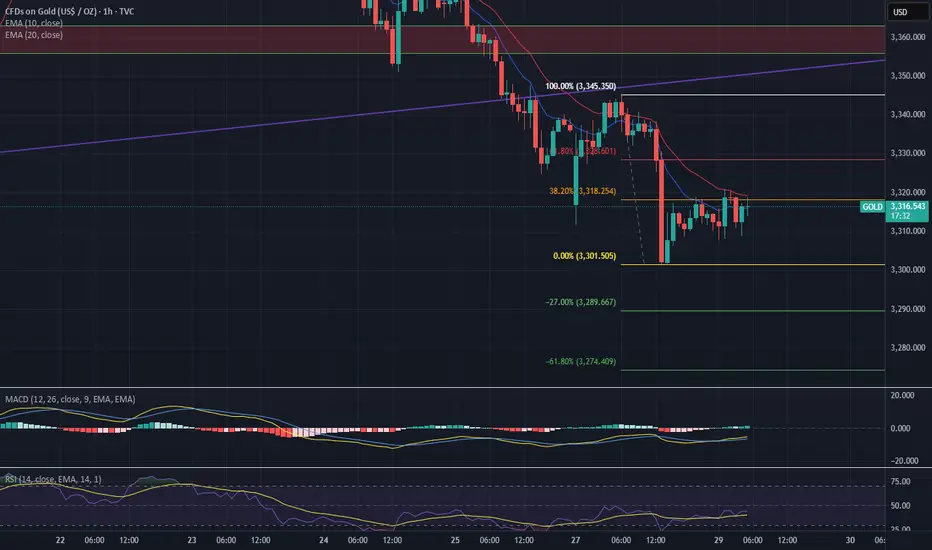
SHORT | Gold | 4H Chart Direction: Bearish
Moving Average: Blue < Red
Pattern Impulse: Impulse correction
Fib Retracement: 38.2
MACD > 0
1st Target = 3302
2nd Target = 3290
Lots: 0.02
RISK: Economic instability still begs the question around whether commodities continue higher over the coming months.
Trade 1/20