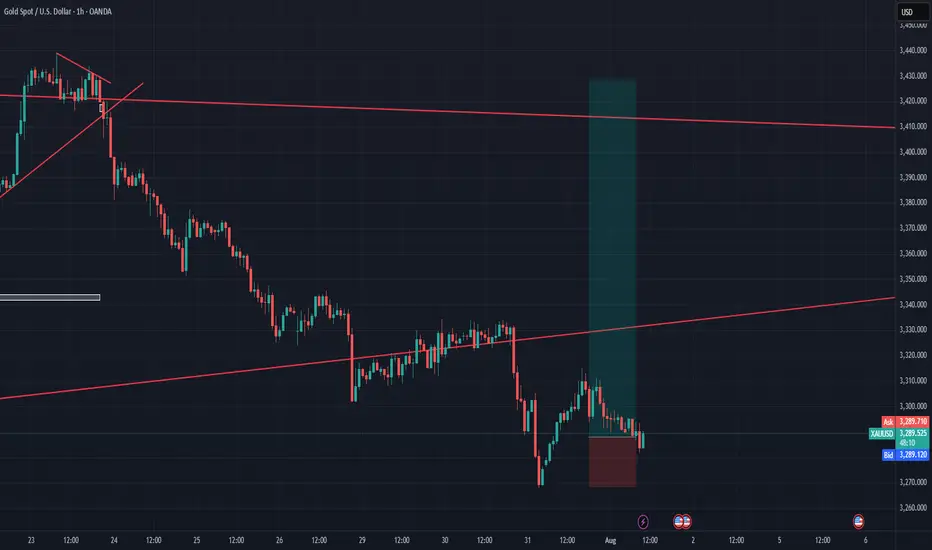
Monday's market forecast and related layout#XAUUSD
Judging from the monthly chart, although July closed with a large positive line, there is still great resistance above 3439-3501. Possible gold price trends for next week are as follows:
1. If gold prices open higher, focus on the previous highs of 3375-3385. If resistance and pressure are encountered, consider shorting, aiming for a volatile decline, retracing Friday's gains.
2. The market is volatile and sideways, so wait and see.
3. Gold fell back. Referring to Friday’s trading strategy, you can consider going long around 3335 to bet on a short-term rebound. Leave yourself some room for participation (the possibility of touching 3338 again and rebounding is not ruled out)
GOLDCFD trade ideas

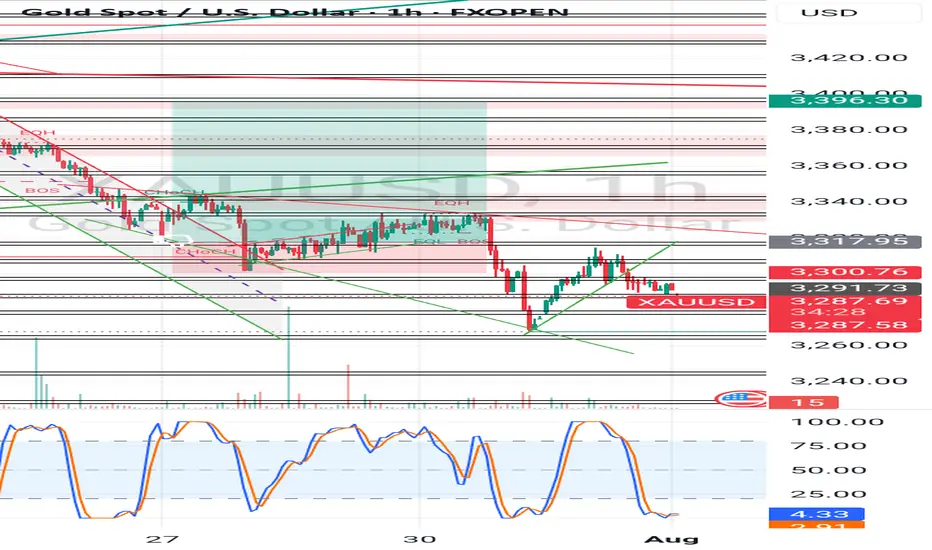
Gold is in the Bearish Direction after Formation ManipulationHello Traders
In This Chart GOLD HOURLY Forex Forecast By FOREX PLANET
today Gold analysis 👆
🟢This Chart includes_ (GOLD market update)
🟢What is The Next Opportunity on GOLD Market
🟢how to Enter to the Valid Entry With Assurance Profit
This CHART is For Trader's that Want to Improve Their Technical Analysis Skills and Their Trading By Understanding How To Analyze The Market Using Multiple Timeframes and Understanding The Bigger Picture on the Charts

Gold in the strong bullish momentum.WE will be expecting gold to con tinue its climb as NFP.
A sudden rejection is seen on 1st of Aug a good strong sign of bull coming in.
point is where to trade.
i personally expect for a pullback and point of interest for me for now nearest will be 3345 next 3330 lastly 3310-14.
where can we expect gold to climb up to.
first pitstop will be 3391-3403 and next 3465-87.
all the best traders.

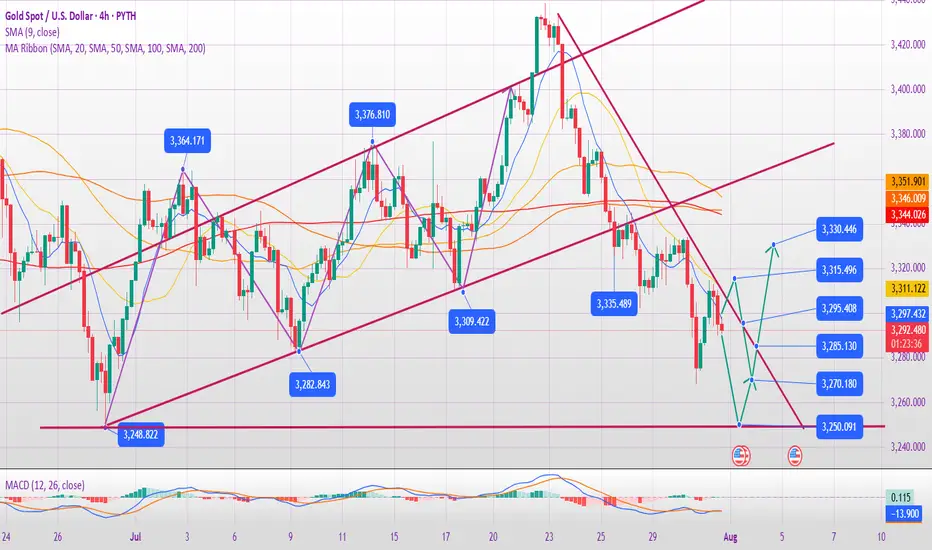
XAUUSD Gold Swing Trading Plan – 1st Week of August 2025 (H4 TF)Strategy Type: Swing Trade (Multi-Day Positioning)
Timeframe: H4 (4-hour)
Market Bias: Bullish Continuation
Risk Profile: Medium-to-Low Frequency, High Conviction
Trade Style: Buy-the-Dip, Scale-out Strategy
🧠 Macro & Technical Outlook
Gold is currently maintaining a bullish higher-high, higher-low structure on the H4 chart, reflecting continued strength from macro drivers including inflation hedging, softening USD, and a shift toward safe-haven assets amid geopolitical and economic uncertainty.
The market has recently completed a local impulse wave and is entering a healthy retracement phase. This sets up a textbook swing opportunity, where pullbacks to key Fibonacci levels can be capitalised for the next bullish leg up.
🔍 H4 Trading Plan Summary
✅ Phase 1: Buy on Pullback to 3360
Entry Zone: 3360 (H4 support and key retracement level)
Reasoning:
Confluence of dynamic support and 50–61.8% Fibonacci retracement zone of the previous H4 swing
Former resistance turned support (RBS zone)
Volume tapering and RSI cooling off — signalling a healthy setup for bullish continuation
Entry Trigger:
Bullish engulfing or pin bar candle on H4
Optional confirmation: RSI > 40 after bounce, MACD crossover
Stop Loss: Below 3340 (beneath structural support)
🎯 Target 1: 3383
Why:
Local resistance zone from previous H4 rejection wick
Close to psychological level and good zone for first partial profit
Action:
Secure 25% profits
Move SL to breakeven or +10 pips for risk-free continuation
Wait for next retracement
✅ Phase 2: Wait for Pullback After 3383
Retracement Zone: Estimated dip to 3370–3375 (higher low area)
Entry Trigger:
Confirmation of strong bounce at this level with tight consolidation and breakout on smaller timeframes (M30/H1)
🎯 Target 2: 3430
Why:
Strong historical resistance from early July
Mid-level of long-term range (3330–3480)
Often serves as decision point between accumulation or breakout
Action:
Secure additional 40–50% profits
Trail SL below the most recent higher low (~3390)
✅ Phase 3: Final Position Hold Toward 3475
Retracement Zone: Likely dip to 3410–3420 after 3430 is reached
Final Entry (Optional): Only if momentum is strong and structure holds
Target 3: 3475
Why:
Multi-month resistance and projected upside target from recent breakout
Round number magnet + liquidity zone for larger institutional exits
Action:
Close remaining 25–30% of the position
Reassess for breakout or reversal at 3475
⚠️ Risk Management Plan
Max exposure: 1.5–2% of account
Stop losses fixed — no averaging down
Use position sizing to handle swing duration volatility
Scale-in only with structure confirmation
🔁 Summary Table
Phase Buy Level Target SL Action
Phase 1 3360 3383 3340 Partial TP, BE SL
Phase 2 3370–3375 3430 3355–3365 Add size, secure more
Phase 3 3410–3420 3475 3390 Final TP, full exit
📊 Indicators to Watch (H4)
RSI: Look for 40–60 zone bounce and push toward 70
MACD: Cross above signal line confirms momentum
Volume: Increased buy-side volume at 3360–3375 confirms entry strength
🧭 Fundamental Considerations
Watch DXY: Weakness in Dollar continues to support Gold’s uptrend
FOMC or Jobs Data Ahead?: Any surprise comments from Fed could introduce volatility
Global Headlines: Risk-off flows (e.g., China/US tensions, war news) are bullish for Gold

XAUUSD Gold Trading Plan – Monday, 4th August 2025Strategy Type: Intraday / Short-term swing
Bias: Bullish (Buy-the-dip)
Methodology: Price Action + Fibonacci Retracement + Momentum Confirmation
Key Zones: 3366, 3377, 3388
Market Overview
As we head into Monday, 4th August, Gold (XAUUSD) remains in an overall uptrend, supported by bullish macro sentiment driven by weakening USD strength and ongoing uncertainty in global risk assets. Despite last week’s slight pullback, the structure still supports a continuation pattern, especially above the 3350 support region.
The previous week closed with a higher low formation, and current price action shows a healthy retracement rather than a reversal. We anticipate that Gold will respect key Fibonacci retracement levels and rally in phases, allowing for multiple entries and scaling opportunities.
🔍 Trading Plan Summary
✅ Step 1: Buy on Retracement to 3366 (1st Target Area)
Entry Zone: Around 3366
Reasoning: This level is a confluence zone — minor support from Friday’s breakout, aligning with intraday Fibonacci retracement (~38.2% pullback from recent swing low to high).
Confirmation: I’ll look for bullish candle confirmation on 15m/30m chart (e.g., bullish engulfing, pin bar, or strong rejection wick) before entering.
Stop Loss: Below 3356 (previous swing low / invalidation level)
🎯 Target 1: 3377
This will be the first take-profit zone after price reaches the next resistance / previous order block zone.
I will secure partial profits here and trail SL to entry or +5 to lock in risk-free trade.
✅ Step 2: Wait for Retracement Again (Post-3377 Pullback)
If price pulls back after hitting 3377, I’ll wait for the new higher low to form — ideally somewhere between 3370–3373.
I’ll re-enter long with confirmation, targeting the next key level.
🎯 Target 2: 3388
This level is the next visible resistance on 1H/4H structure and may trigger profit-taking or reversal pressure.
I plan to close the majority of my position here unless price shows strong breakout momentum.
⚠️ Risk Management Notes
Maximum total exposure: 1.5% of account (0.5% per trade entry)
All trades will have a defined SL; no averaging down.
Avoid entering if price gaps up directly above 3377 on Monday open — in that case, I’ll reassess structure and wait for new retracement levels.
🛠 Tools to Watch
DXY (Dollar Index): If DXY weakens further below 104.50, this supports the bullish Gold thesis.
US Bond Yields: Any decline in yields also gives bullish pressure on Gold.
Volume & RSI Divergence: For entry and exit confidence.
News Risk: Keep an eye on any surprise geopolitical tensions or Fed commentary, though major data events are limited on Monday.
🔁 Summary of Execution Plan
First Buy Entry: 3366 → TP1: 3377
Second Buy Entry (on retracement): ~3371 → TP2: 3388
SL Discipline: Below swing structure, never moved unless TP1 hits.
Profit Securing: Partial at 3377, majority at 3388
Trade Review: At EOD, whether plan was followed or not

XAUUSD NEW OUTLOOKAccording to H1 analysis gold market going in buying pressure from last 2 day
now market break the resistance zone and make it RBS (RESISTANCE BECOME SUPPORT) so now market close at support level market will touch the Support zone IF you want to buy gold then you have to best chance to buy from SUPPORT level dont be greedy use money management
TRADE AT YOUR OWN RISK
Gold (XAU/USD): Supply Zone Rejection & Bearish Breakdown Chart Breakdown:
Supply zone rejection: Gold revisited the “supply zone” (light green/grey area) and failed to break above — a classic signal of seller dominance.
Uptrend invalidated: A sharp rise (steep black trendline) ended with a peak marked by the green arrow, followed by a decisive breakdown.
Ichimoku Cloud test: Prices slipped through the Ichimoku components, reinforcing the shift to bearish sentiment.
Potential targets: The red/green risk‑reward box highlights a short position, targeting ~3,347 then ~3,318 levels (blue labels) as initial support zones.
Strong supply base: The extensive grey zone below marks a "stronger supply zone" — this could cap any modest bounce and keep the downtrend intact.
🔍 Interpretation:
Bias: Bearish — sellers have taken control after a failed breakout.
Strategy: Short on rallies toward the mid‑green/red box (~3,373–3,380), targeting ~3,347 first and then ~3,319. Watch for support at the strong supply region (~3,292) for potential reversal or consolidation.
Risk management: Keep stop above the red zone—above recent highs (~3,380+) to limit risk.
🚀 In a nutshell: After failing to break supply and losing its short‑term uptrend, gold appears poised for a pullback. The next key levels to watch are ~3,347 and ~3,319—where buyers might step back in, or the downtrend continues toward the deeper supply base.

Gold (XAU/USD) in Symmetrical Triangle – Short‑Term Squeeze,Price Structure & Technical Setup
Gold is consolidating within a symmetrical triangle, showing lower highs and higher lows—a classic precursor to breakout in either direction
Fxglory Ltd
+5
TradingView
+5
Babypips.com
+5
TradingView
+2
Babypips.com
+2
TradingView
+2
.
Trendlines converge tightly around $3,326–$3,334, hinting at imminent directional acceleration
Investopedia
+4
TradingView
+4
TradingView
+4
.
🎯 Key Levels & Targets
Scenario Trigger Confirm Area Targets Stop Loss
Bullish Breakout above $3,344–$3,350 $3,369 → $3,396 → $3,422–$3,550 ~$3,340
Bearish Breakdown below ~$3,326–$3,320 $3,320 → $3,300 → $3,297 → $3,255 ~$3,335–$3,340
A breakout above $3,344–$3,350 validated with volume may drive prices toward $3,400+, with extended targets up to $3,550 or higher in bullish conditions
Traders Union
Time Price Research
.
A drop below $3,326–$3,320 risks further decline, targeting $3,300, $3,297, and eventually $3,255 if breakdown momentum builds .
📉 Market Context & Drivers
U.S. dollar strength, easing safe-haven demand, and optimistic trade sentiment are constraining gold’s upside unless breakout forces emerge .
Key upcoming catalysts: FOMC guidance, U.S. macro data (GDP, inflation), and geopolitical developments—their tone could tip the bias direction .
⚙️ Trade Rules & Risk Management
Wait for a confirmed breakout or breakdown—do not trade mid-range.
Confirm break with at least one close outside the triangle and rising volume .
Position sizing: Risk 1–2% per trade, adjust stop-loss to price structure ($8–$15 depending on volatility).
Take profits in stages: scale out at minor milestones (first targets), trail stop for extended targets.
Avoid chasing price within the middle of the triangle—risk/reward is unfavorable.
🧠 Why This Plan?
Follows textbook symmetrical triangle trading methodology: entry on breakout, stop beyond pattern opposite side, projection based on triangle height .
Aligns with broader outlook: bearish unless convincing upside breakout appears, consistent with analyst consensus hedging current bull exhaustion and wait‑and‑see on policy signals .
✅ Summary
Gold is coiling inside a tight triangle range near $3,326–$3,334, with breakout potential identified to either side:
Bullish breakout over $3,344–$3,350 targets up to $3,550 or beyond.
Bearish breakdown under $3,326–$3,320 risks slide towards $3,300–$3,255.
Wait for confirmation, apply disciplined risk controls, and let volume validate the move.

In-depth Analysis of the Gold Bull-Bear Game on August 4th:
I. Gold's Current Core Contradiction
Bull Support Factors
Weak non-farm payroll data reinforces expectations of a Fed rate cut, with the market betting on an over 80% probability of a September rate cut.
Risk Aversion: Although the tariff extension has not yet been finalized, the market remains concerned about escalating trade frictions, and gold is in high demand as a safe-haven asset.
Technical Breakout: Friday saw a strong breakout above the 3340-3350 resistance zone, with the daily chart showing a positive enveloping negative trend. Short-term bullish momentum prevails.
Potential Short-Term Opportunities
Monthly Top Signal: Consecutive high-level doji candlesticks with long upper shadows suggest medium-term selling pressure.
Fundamental Bearish Hidden Dangers:
The Fed's independence remains, and Powell may not cut interest rates prematurely due to pressure from Trump.
II. Key Technical Signals
1. Weekly Level: Range Unbroken
The 3268-3438 range persists, currently nearing its upper limit, so be wary of a pullback.
Bollinger Bands are converging, with the MA5/MA10 convergence signaling an approaching market reversal window.
2. Daily and short-term cycles: Overbought correction needs
After Friday's surge: 4-hour/1-hour RSI is overbought, the Bollinger Band opening is unsustainable, and a technical retracement is needed.
Key positions:
Resistance: 3376 (previous high) + 3385 (Fibonacci expansion level);
Support: 3340 (top and bottom conversion) + 3315 (bull defense line).
3. Triangle convergence pattern:
If it opens high and breaks through 3376 on Monday, August 4, it may test 3400; if it opens low and falls below 3340, it will look down to 3315-3280.
III. Operation strategy for next week on August 4
(1) Response to three opening scenarios
Scenario 1: Opening high (above 3370)
Strategy: Short in batches in the 3376-3385 area, stop loss at 3400, target 3340→3315.
Logic: Positive overdraft + technical overbought, betting on a pullback.
Scenario 2: Flat opening (around 3360)
Strategy: If the price rises from 3366 but does not break through, go short with a light position, stop loss at 3376, target 3340; if it falls below 3340, go short and look at 3315.
Alternative: If the support at 3340 is effective, go long, stop loss at 3330, target 3360.
Scenario 3: Low opening (below 3340)
Strategy: Go long in the 3338-3340 area, stop loss at 3325, target 3360; if it breaks through 3315, go short.
(2) Mid-term layout
Short opportunity: Go short in the 3385-3400 area, stop loss at 3420, target 3245 (monthly support).
Buy opportunity: If the price falls back to 3315-3280 at the beginning of the week and stabilizes, go long in the mid-term, stop loss at 3260, target 3400.
IV. Risks and Warnings
Beware of institutional manipulation: Friday's late-day surge may be a trap for buying; beware of a flash crash at Monday's opening.
Data disturbance: Pay close attention to the speeches of Fed officials. If inflation rebounds or hawkish remarks are made, it will be bearish for gold.
Undetermined trend: The market is still volatile and unilateral trends need to wait for confirmation of a breakthrough in the range.
Conclusion
Short-term: Prioritize shorting in the 3370-3385 area, and enter long positions in the 3340-3315 area when appropriate, maintaining strict stop-loss orders.
Mid-term: The monthly bearish pattern has not changed, and above 3385 is the ideal entry point for short positions.
Key Strategies: "Don't chase long positions during strong resistance; don't sell short during deep declines; follow the trend after a breakout; exercise caution in controlling the market."
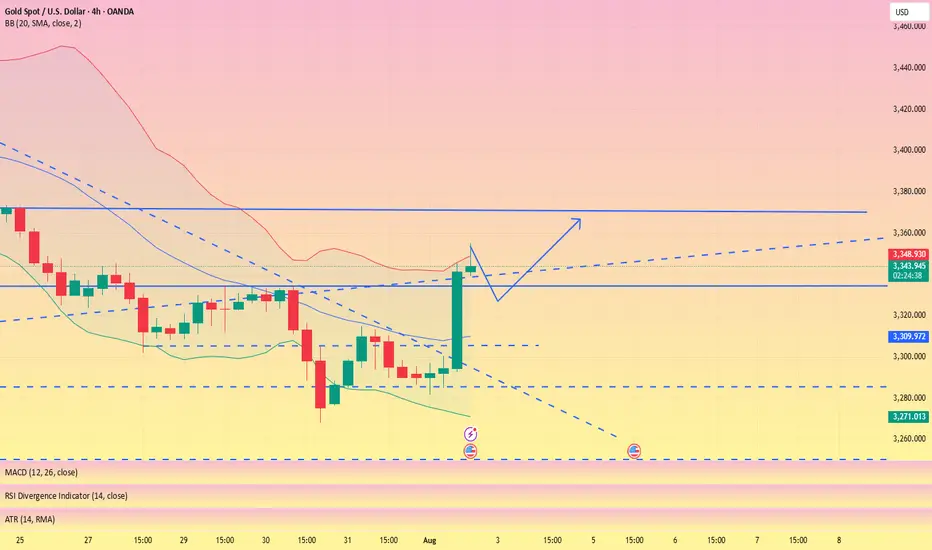
Is the uptrend complete? Will there be a pullback?On the last trading day of this week, gold prices soared, rising nearly $56, driven by the non-farm payroll data. The rally began at 3300 and peaked near 3356. The price has now retreated slightly, fluctuating around 3345.
The current uptrend has repeatedly tested the resistance level near 3355 but has failed to break through. The RSI indicator hovered around 76.8, indicating a gradual flattening of the upward trend. The 3355 high is likely the end of this uptrend.
As this is the last day of a major data week, Quaid believes the current uptrend is complete. Consider a light short position around 3350-3355. The current low has yet to be confirmed, and the pullback is likely to end around 3335.
However, we cannot rule out the possibility that the price will remain within the upward channel with slight fluctuations on the last trading day of the week.
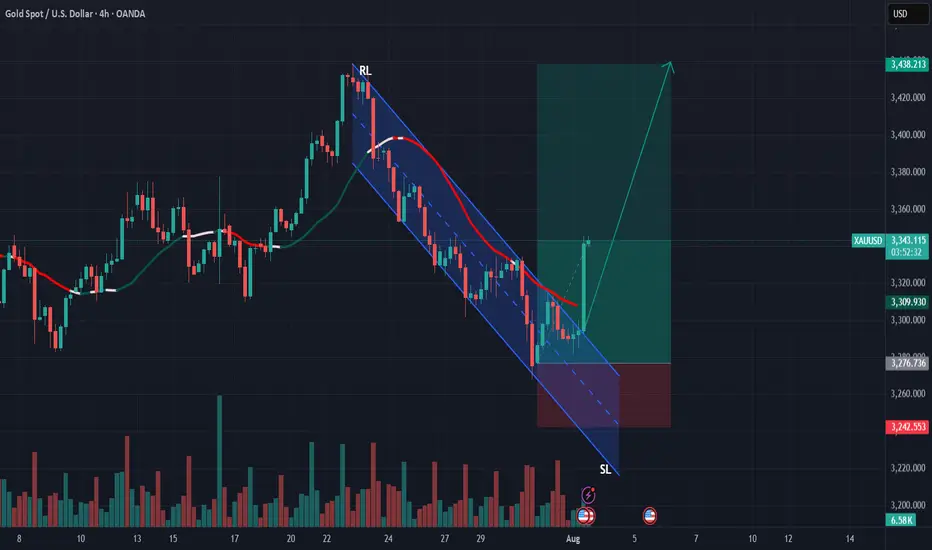
NFP data is positive, the bullish trend remains unchanged#XAUUSD
The current market, influenced by data such as NFP, remains bullish, even briefly pushing towards the 4H upper limit of 3350, reaching a high near 3354.📈
In the short term, gold still has upward momentum and could even reach the previous high resistance level near 3375.🐂
Currently, gold is undergoing a technical correction and needs to begin a pullback to accumulate more bullish momentum, giving traders who previously missed the opportunity to get on board.🚀
As resistance continues to rise, support below will also rise. 📊If gold retreats below 3335-3315, consider going long.📈
🚀 SELL 3335-3315
🚀 TP 3350-3375
GOLD 2 HR CHART Gold 2 hr chart based on the 2hr time fame , the price support at 3384 creating a ascend channel

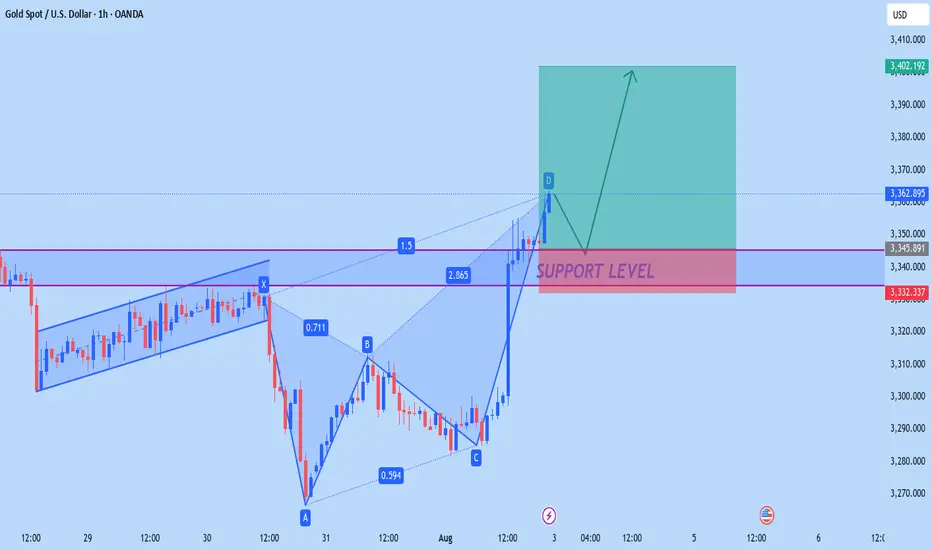
XAUUSD: Buy ideaBuy idea on XAUUSD as you can see on the chart because we have the breakout with force the vwap indicator by a big green candle...
Gold (XAU/USD) Analysis:Gold remains in a downward trend and is currently moving sideways in a consolidation phase in the short term. The bearish outlook still dominates, with a potential move toward levels like $3,245.
1️⃣ A break and close below $3,276 may trigger a drop toward the strong support zone at $3,245.
2️⃣ However, if bullish momentum pushes the price above $3,310, this opens the path toward $3,330, a key level where a bearish rejection might occur.
📈 If the price holds above $3,330, a continuation toward $3,350 becomes likely.
⚠️ Disclaimer:
This analysis is not financial advice. It is recommended to monitor the markets and carefully analyze the data before making any investment decisions.
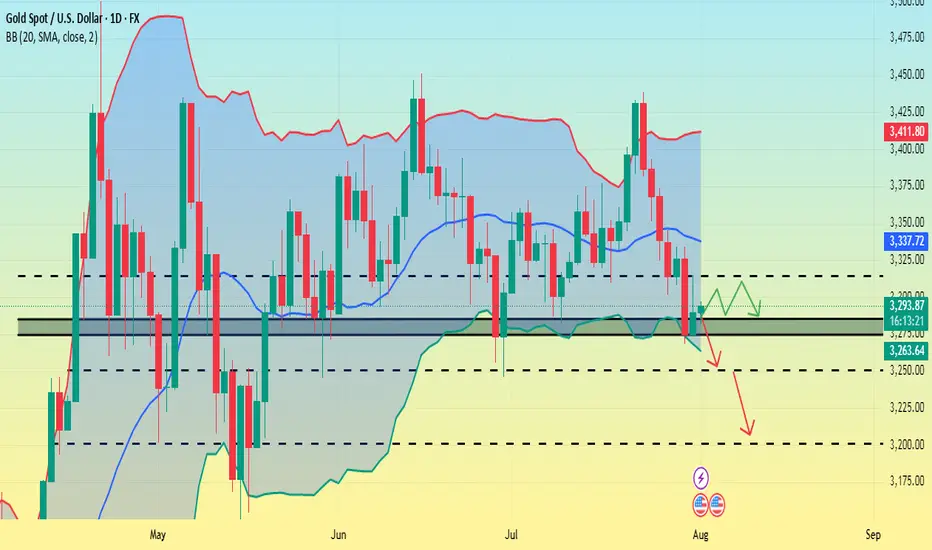
Non-farm payrolls are coming. Will it trigger the market?On Thursday, the US dollar index briefly rallied after the Federal Reserve's favorite inflation indicator unexpectedly rebounded, crossing the 100 mark for the first time in two months. This marked the sixth consecutive trading day of gains and the first monthly gain since 2025.
Spot gold rebounded as risk aversion lingered amid uncertainty surrounding Trump's tariff deadline, reaching a high of around $3,315, but its intraday gains narrowed after the release of the PCE data.
The dollar has already firmly established itself above the 100 mark on the daily chart, so the next target is likely to be between 101.5 and 102.0. Currently, support levels on the daily chart are visible at 99.5 and 99.0.
The gold market is currently consolidating in the 3315-3275 range. However, if the dollar rises again, Quaid believes gold prices could fall below 3275.
On the daily chart, if it falls below 3275, the price would likely be around 3250. If 3250 falls below, the market could test 3200. However, the possibility of a consolidation between 3315 and 3275 remains undisputed.
Before the release of the non-farm payroll data, scalping within this consolidation range is advisable. However, the risk is relatively high, so please take profits in time.
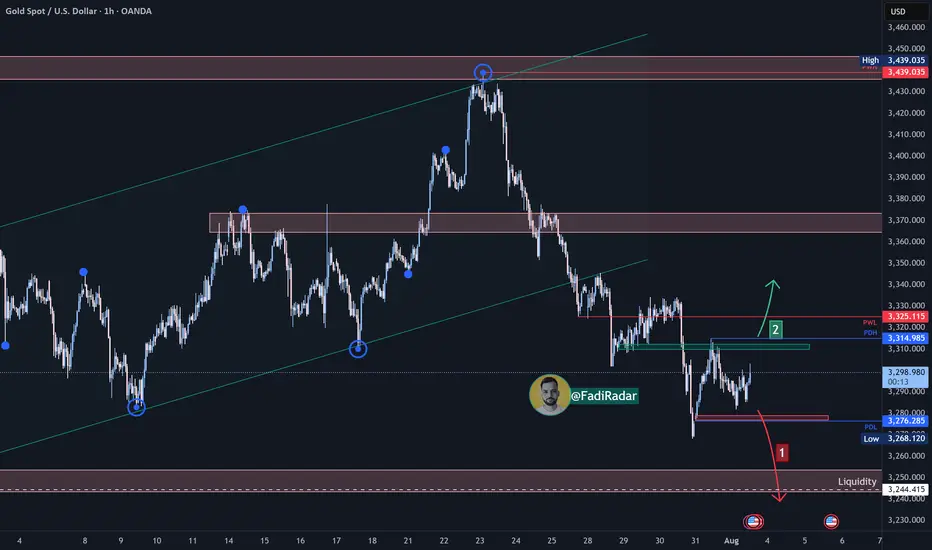
XAU USD LONG RESULT Price broken down both of our supports Trendline and zones without filling any of the supply zones hitting our SL.
Better Improved Set-ups to come 💪
_THE_KLASSIC_TRADER_.
GOLD SHORT10 year bullrun is followed by a shorter term bearmarket. Gold is starting to lose its strength, which is a clear sign of weakness and the beginning of a bearish reversal.

Will gold prices continue to fall on August 1st?
Core Logic Analysis
Negative factors dominate
The Federal Reserve's hawkish stance: keeping interest rates unchanged and Powell suppressing expectations of a rate cut have weakened gold's safe-haven appeal.
Strong economic data: ADP employment data exceeded expectations, and coupled with the upcoming PCE and non-farm payroll data, market expectations of an early Fed rate cut have cooled.
Technical Breakdown: Gold prices fell below the key support level of $3,300, hitting a new monthly low. A large weekly bearish candlestick chart indicates bearish dominance.
Key Support and Resistance
Resistance: 3315 (hourly rebound resistance), 3333 (previous high and daily resistance).
Support: 3280-3290 (short-term), 3250-3245 (strong monthly support).
Potential Risks
Unexpectedly weak non-farm payroll data or escalating geopolitical tensions could trigger a short-term rebound, but a break above 3330 is required to reverse the downward trend.
Today's Trading Strategy
Short-Term Trading
Primarily short at highs: Short lightly on a rebound to 3310-3315, stop loss at 3325, target 3290-3280.
Aggressive Short: Add to short positions if the price reaches 3330-3333, stop loss at 3340, target 3280.
Cautious Long: Try a long position on the first touch of 3250-3245, stop loss at 3235, target 3270-3280 (quick in and out).
Mid-term Strategy
If the monthly line closes below 3250, shorting at high levels can be continued in August, targeting the 3150-3100 range.
If the gold price rebounds above 3350 after the non-farm payrolls, the trend needs to be reassessed.
Events to Watch
Data:
Non-farm payroll report on Friday (if the data exceeds expectations, gold prices may fall further).
US June PCE Price Index (Federal Reserve inflation indicator).
Technical Signal:
A daily close below 3250 would confirm a medium-term downtrend.
Observe the recapture of the 3300 level, which serves as a dividing line between bulls and bears.
Summary
Gold is currently in a bearish phase. Prioritize shorting on rallies, but be wary of unexpected data fluctuations. If the mid-line breaks below 3250, the market could target the 3000-3100 range. Conversely, if it holds above 3330, strategy adjustments will be necessary. Strictly stop loss and control risks.
XAUUSD GOLD The XAUUSD Gold price is approaching our target zone, where it will find strong support in EMA 100 if it does not comply with LSOB in small timeframes. In the 4H timeframe, the price has been making lower lows so far, so I recommend waiting a little and entering based on the daily timeframe from the lower zone.

XAUUSD Outlook – From Bias to Execution Previous day closed bearish, leading to a sell bias, On the 1H, I then identified a familiar chart pattern, a rising wedge, On the 45M, I then looked for a possible entry and exit zone.

GoldTVC:GOLD price overall is bearish and looks like during NFP tomorrow it does looks like it's bout to be drop all the way down. But what are your ideas guys let me know on the comment session

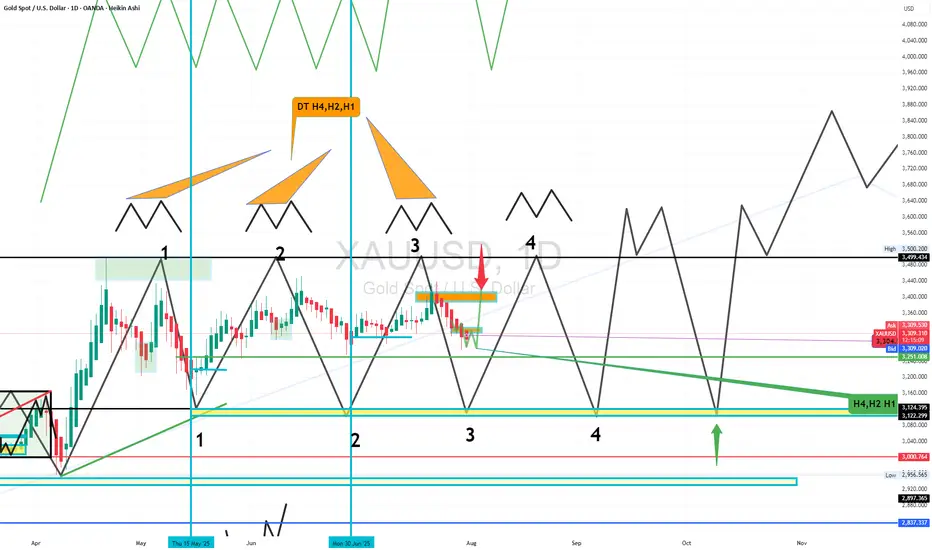
GOLD USDHI GUYS.
here we have daily path.
i expect pullback, retest to form double top h4, h2, h1 at number 3,
then we sell to clear numer 3 downwards.
currently its a buy . details on h4 chart