XAUUSD ideaWe are waiting for our asset to reach our action zone, and based on the reaction, we’ll decide on our next moves.ALWAYS WAIT FOR A CONFIRMATION TO SEE IF THE PRICE VALIDATES THE ZONE.and you what is your vision of the EURUSD its interests me! i wait you in the commentary
GOLDCFD trade ideas

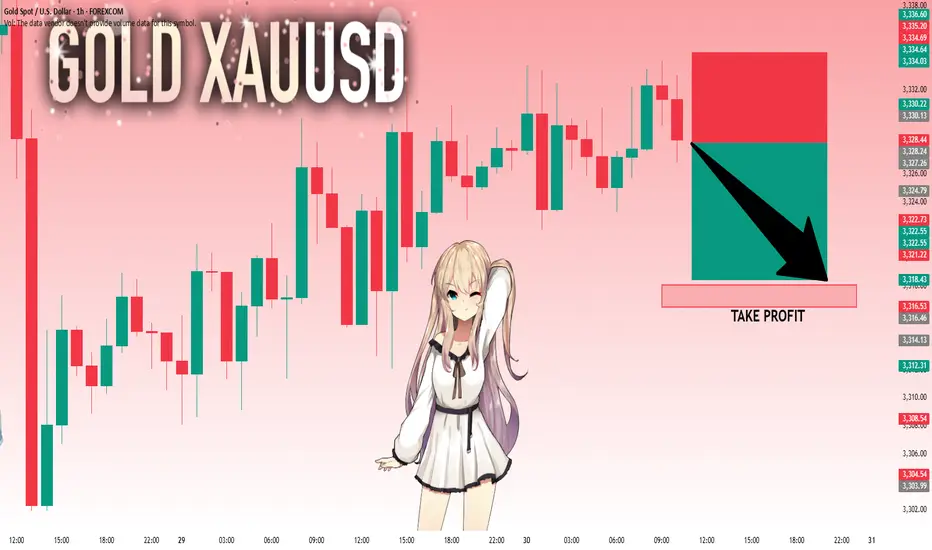
GOLD: Next Move Is Down! Short!
My dear friends,
Today we will analyse GOLD together☺️
The market is at an inflection zone and price has now reached an area around 3,328.24 where previous reversals or breakouts have occurred.And a price reaction that we are seeing on multiple timeframes here could signal the next move down so we can enter on confirmation, and target the next key level of 3,318.05..Stop-loss is recommended beyond the inflection zone.
❤️Sending you lots of Love and Hugs❤️
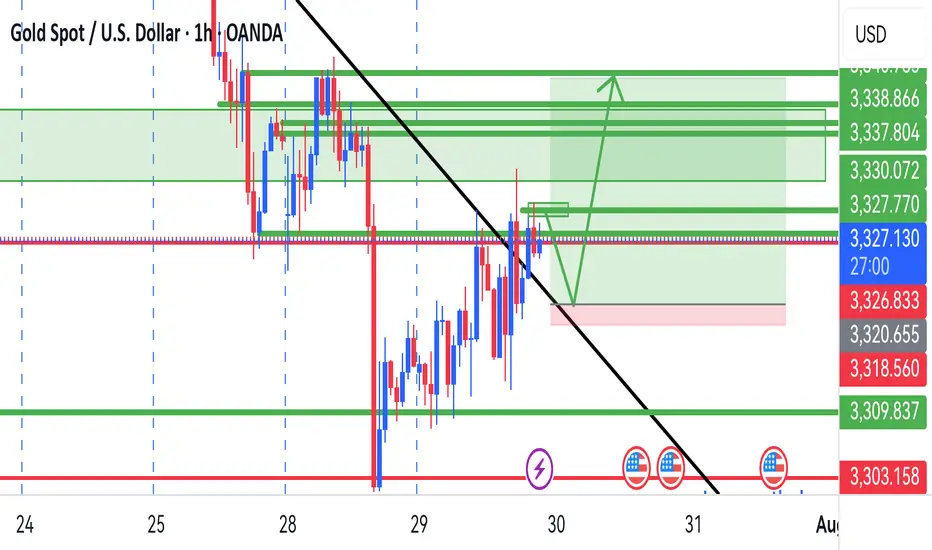
gold ranginggold is currently ranging underneath the broke of daily trendline.
possible falling wedge formation.
trade out of the wedge.

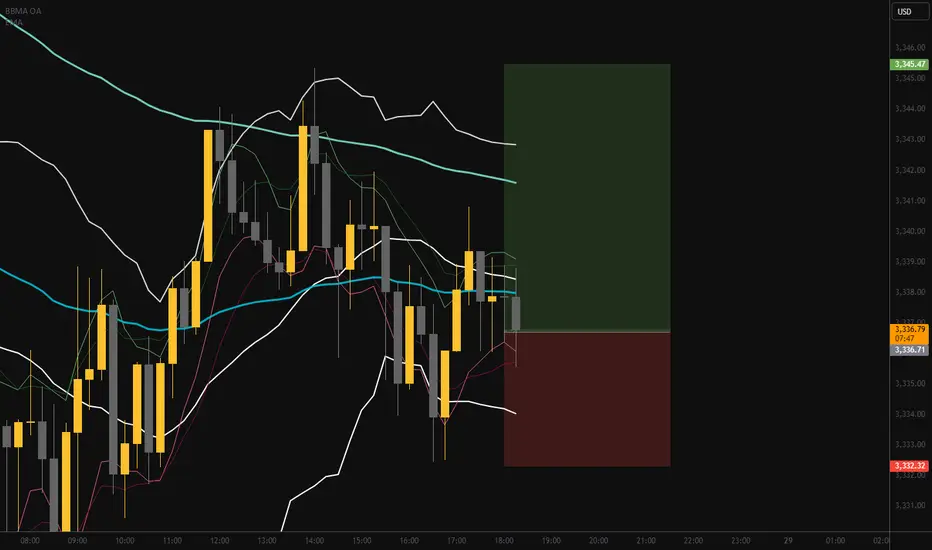
XAUUSD M45 Outlook XAUUSD
Liquidity grabbed ✅
Break of Structure & ChoCh confirmed ✅
Price taps into premium OB zone 🧠
Entry from refined supply zone 🎯
Risk:Reward 🔥
SL: 3348
TP: 3290
If this plays out, it's textbook Smart Money 👑
Risk managed. Emotions off. Let the market speak.

Gold Buy SetupHi everyone
Hope you all had a good trading week so far, this is our buy setup we looking to see for Wednesday
Let us know in the comments what you think.
Gold prices under pressure: $3,330-3,350Gold prices under pressure: $3,330-3,350
Upward momentum: Gold could break through $3,330 if the Federal Reserve hints at a September rate cut or the EU economy deteriorates.
Downside risks: Gold could fall below $3,300 if strong US economic data (such as GDP and PCE figures) are released.
Optimistic scenario: If the Fed cuts rates in September and global stagflation risks increase, gold could reach $3,400.
Pessimistic scenario: If the US economy experiences a soft landing, rising real interest rates could push gold prices down to $3,200.
Key Technical Levels:
Support: $3,300
Resistance: $3,330/$3,350
Aggressive Strategy:
Sell Price: $3,325-$3,330
Stop Loss: $3,335
Target Price: $3,310
Conservative Strategy:
Sell Price: $3,340-$3,350
Stop Loss: $3,355
Target Price: $3,330-$3,310
Bottom Picking Strategy:
Buy Price: $3,300-$3,310
Stop Loss: $3,290
Target Price: Above $3,350/$3,400
XAUUSD - BUY to SELL CONT.DI'm in on the BUY, waiting patiently to take the SELL only with confirmation
Gold setupGold us just broken to the downside from the previous uptrend and now we expect the prices to continue pushing towards the downside. the prices are likely to reject from the the current order block but if not, they will probably do on the smaller upper order block as you can see via the analysis

BUY TRADE SETUP ON XAUUSDA Quick Trade setup on Gold for Gold traders who are crazy about Gold!
Swing Trade.
Check it out!
Analysis and strategy of gold market on July 28:
Core influencing factors
Risk aversion cools down: Despite frequent geopolitical risk events, market panic has not significantly increased, weakening gold safe-haven buying.
US dollar strengthens: US economic data supports the continuous rise of the US dollar, and funds flow back to US dollar assets, suppressing the attractiveness of gold.
ETF holdings outflow: Short-term risk appetite has rebounded, and gold ETFs have seen a slight outflow of funds, reflecting the cautious attitude of the market.
Key events focus:
US-EU and US-China trade negotiations: If progress is optimistic, gold prices may fall to the $3,300/ounce mark.
Federal Reserve resolution: Pay attention to policy independence (affected by Trump's pressure) and interest rate guidance.
Non-farm data: Released on Friday, if the employment data is strong, it may strengthen the US dollar to further suppress gold.
Key technical points
Weekly level:
Watershed $3,325: If it is held, it will maintain high-level fluctuations, and if it is lost, it will open up downward space.
Support area: If the daily support is broken, the weekly support may be tested (reference 3300-3310).
Daily level:
Key support: The current daily support is facing the risk of breaking down, and we need to be alert to the acceleration of short positions.
4-hour level:
Resistance 3388 US dollars (middle track): Before the rebound is not broken, the short-term is short.
Weak signal: The price continues to run below 3363, and the rebound is weak.
Hourly chart:
Strong and weak boundary 3363 US dollars: Maintain weakness before breaking, and avoid bottom-fishing against the trend in the negative market.
Operation strategy suggestions
Short-term direction: Short-selling on rebound is the main, supplemented by light-weight buying at key support levels.
Short-term selling opportunities:
Ideal entry: 3370-3375 area (below the 4-hour middle track), stop loss above 3380.
Target: 3320-3310, if it breaks down, look at 3300.
Opportunities to buy long orders in the short term:
Participate cautiously: If the support of 3320-3310 stabilizes, combine the K-line signal to hold a light long position, and stop loss below 3300.
Quick in and out: You can exit the market when it rebounds to 3340-3350.
Risk warning:
Before the Fed’s decision: Avoid heavy positions, and be wary of unexpected hawkish policies that cause volatility.
Non-agricultural data: If the data exceeds expectations, it will be bearish for gold.
Summary: Gold is short-term technically bearish, but be wary of event-driven reversals. Trading requires strict stop losses and flexible response to data and policy risks.
Gold 1H Intra-Day Chart 24.07.2025We saw a perfect rejection from our $3,437 zone and a drop into our first TP of $3,380. What's next?
Option 1: Gold keeps dropping lower into $3,360.
Option 2: Gold buyers hold around $3,380 & push price back up.
Which scenario do you find more likely?

Daily chart gapThis gap will be closed in a week or two. I am gonna hold buy from now. At least set TP at 3400. We'll see if it goes as planned.

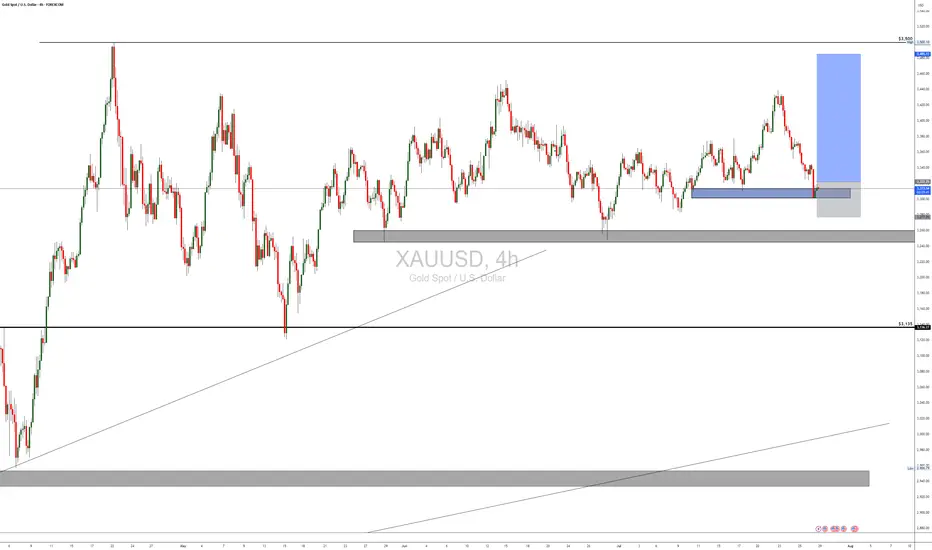
GOLD (XAUUSD)GOLD Market Outlook........
📍 Price broke daily trendline and is now retesting it.
📍 You marked a Break of Structure (BOS) — suggesting a shift in direction.
📍 Price is in a consolidation zone (range) with possible accumulation.
What to Expect:
- If price breaks above the range, expect a bullish push upward to the next supply level.
- If it rejects the upper box, it may return to fill imbalance or test previous lows again.
What You Should Do:
1. Wait for breakout confirmation from the consolidation zone.
2. For buys: Enter on a clear break and retest of the upper range box.
3. For sells: If price rejects the top and breaks back below, look for short entries toward support.

Long XAUUSD 2RXAUUSD finish doing the correction now looking toward long. I will consider taking Long on XAUUSD. Vamos !
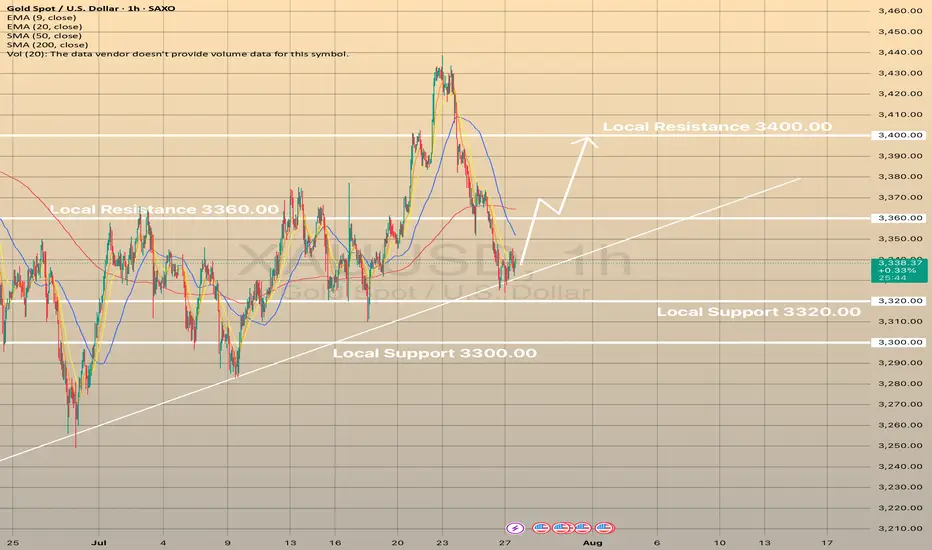
XAUUSD REBOUNDED FROM CURRENT TRENDLINE. WHAT'S NEXT?XAUUSD REBOUNDED FROM CURRENT TRENDLINE. WHAT'S NEXT?
Gold had successfully rebounded from the trendline, still showing mid-term bullish trend despite recent news on U.S. - E.U. and U.S. - Japan trade deals. Currently price is attempting to hold above the EMA20 on 1-h chart timeframe.
If this occurs and the asset develops another short-term bullish impulse, we may expect the price to reach 3,360.00 resistance level with further possible impulse towards 3,400.00 level.
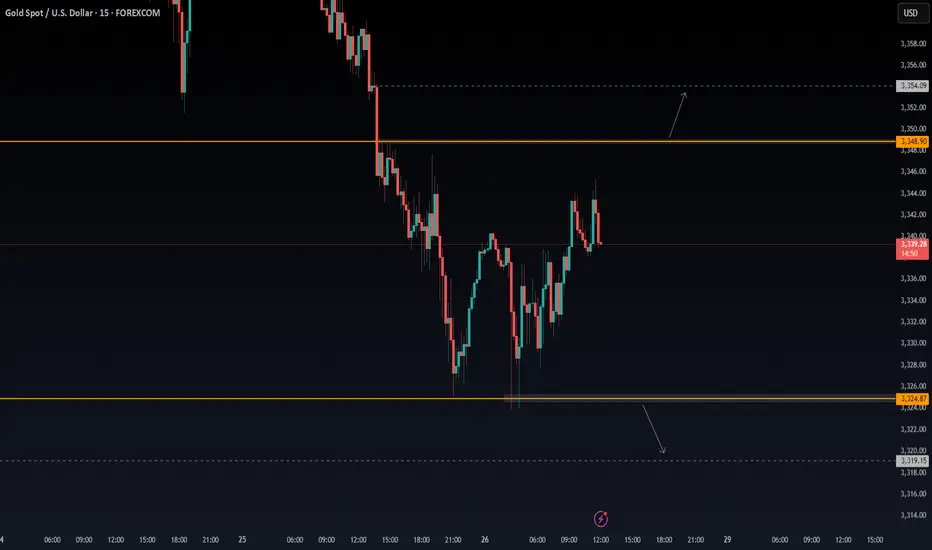
XAUUSDPrice action trading is a methodology where traders make decisions based on the interpretation of actual price movements on a chart, rather than relying primarily on lagging indicators. It involves observing and analyzing candlestick patterns, trend lines, support and resistance levels, and volume to identify potential trading opportunities and manage risk. The focus is on understanding the story the market is telling through its price behavior.
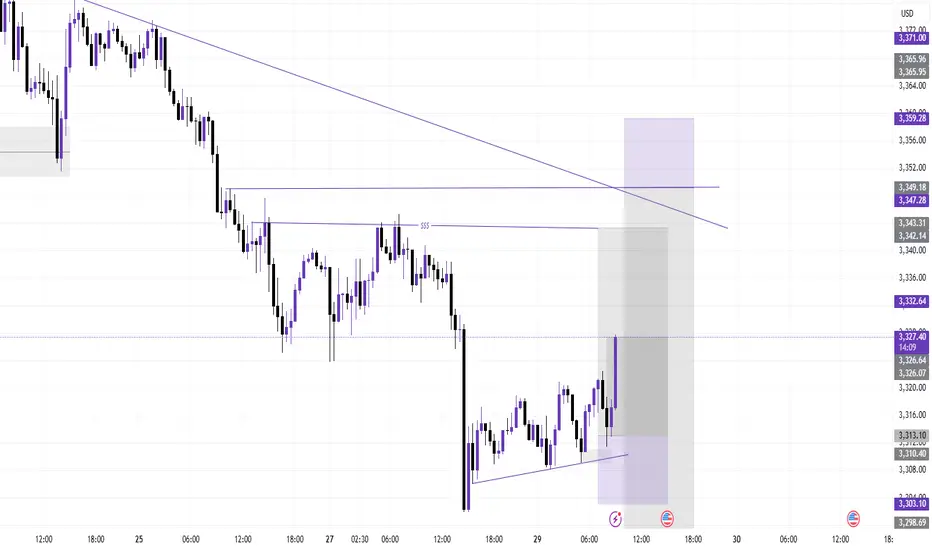
XAUUSD - Scalping ideaPrice is stuck in a range between 3348.90 and 3324.87.
📌 Looking for a clean breakout to take action:
Buy above 3348.90 → Targeting 3354.09
Sell below 3324.87 → Targeting 3319.15
Not interested in any trades inside the range only jumping in once we break out and close outside either level. Waiting for confirmation to avoid getting chopped up.
Let’s see where it goes. 📉📈
No rush, just reacting.
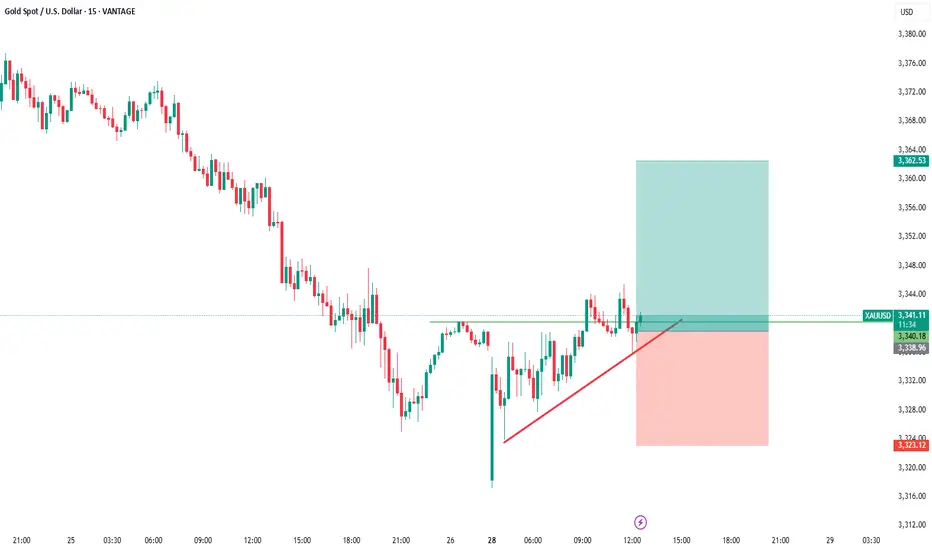
Daily Analysis- XAUUSD (Monday, 28th July 2025)Bias: Bullish
USD News(Red Folder):
-None
Notes:
- Price gap down and filled up the gap
- Looking for price to tap 0.618 fib level
- Potential BUY if there's
confirmation on lower timeframe
- Pivot point: 3300
Disclaimer:
This analysis is from a personal point of view, always conduct on your own research before making any trading decisions as the analysis do not guarantee complete accuracy.
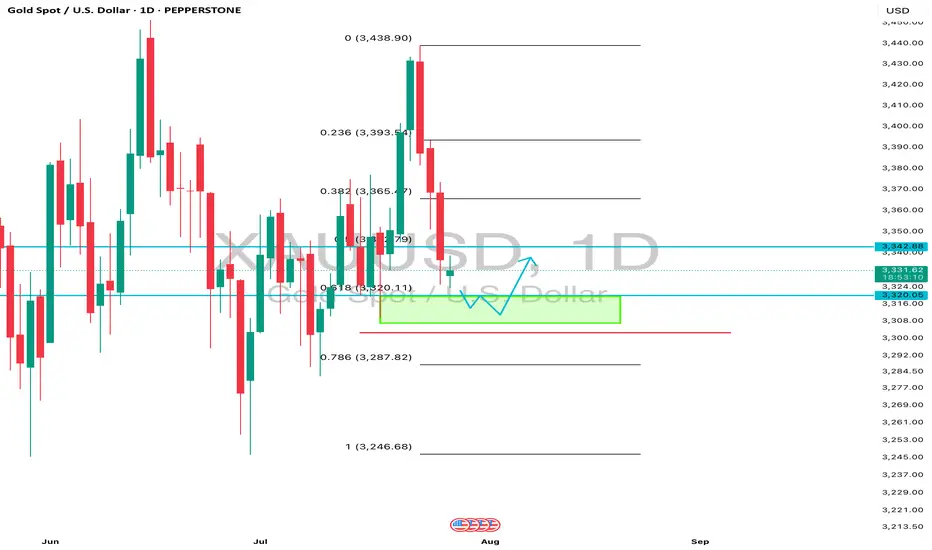
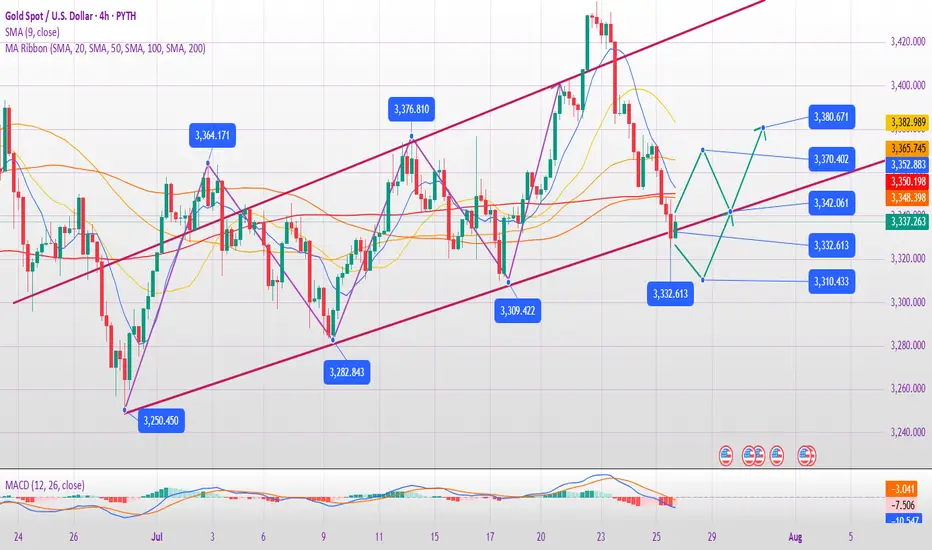
KEMANA GOLD KEDEPAN NYA ?📊 Technical Analysis – XAUUSD (July 28, 2025)
Elliott Wave Structure – Triangle (ABCDE):
The chart clearly shows a contracting triangle pattern (ABCDE), which commonly appears during corrective waves (usually Wave 4 or Wave B in a larger degree).
Currently, price seems to have just completed Wave E, and it's showing early signs of a bounce from the triangle's lower support.
If this wave count is valid, we could expect a bullish breakout soon, continuing the previous trend (most likely upward if this is part of Wave (5)).
🧭 Key Support and Resistance Levels:
Triangle Support (Wave E area):
Around $3,325 – $3,336 (price is currently testing this zone)
Potential Bullish Targets (if breakout occurs):
🎯 $3,374
🎯 $3,414
🎯 $3,498 – $3,500 (major resistance zone / Wave 5 target)
🧠 Fundamental Outlook Supporting Gold (Forward-Looking)
✅ Bullish Drivers:
Fed Rate Cut Expectations (Late 2025):
Slowing inflation → Rate cuts expected → Positive for gold.
Weaker US Dollar:
A weaker dollar makes gold cheaper for international buyers → Bullish.
Global Geopolitical Tensions:
Rising uncertainty supports gold as a safe haven asset.
⚠️ Bearish Risks:
Strong US economic data (e.g., NFP beats or rising inflation) could lead to the Fed staying hawkish → Negative for gold.
If price breaks below triangle support ($3,325), the triangle structure would be invalidated and a larger correction could unfold.
📝 Summary & Trading Strategy:
Direction Entry Area Stop Loss TP 1 TP 2 TP 3
✅ Buy (preferred) $3,330 – $3,336 Below $3,310 $3,374 $3,414 $3,498–$3,500
❌ Sell (if breakdown) Below $3,320 Above $3,340 $3,265 $3,245 $3,118

XAUUSD about to trade downwardsToo many tries on the higher high created by Gold that have failed , now the price has broken a treblndline from months back signalling a bearish move down to 3000 with few breaks to lead it there if the dollar doent slip, which the decline might take up to November according to how I see the pattern formations

XAUUSD Expecting bullish Movement Gold is currently testing a strong demand zone between 3340 to 3335, which previously acted as a support area. The price action indicates potential for a bullish reversal from this zone, supported by oversold conditions and historical reaction levels.
Entry Zone: 3340 to 3335
First Target: 3375
Second Target: 3390
Two potential scenarios are highlighted:
A direct bullish reversal from the 3340–3335 zone
A slight consolidation before continuation to the upside
This setup offers a favorable risk-to-reward opportunity for intraday or short-term swing traders. Monitor price action confirmation signals before entering

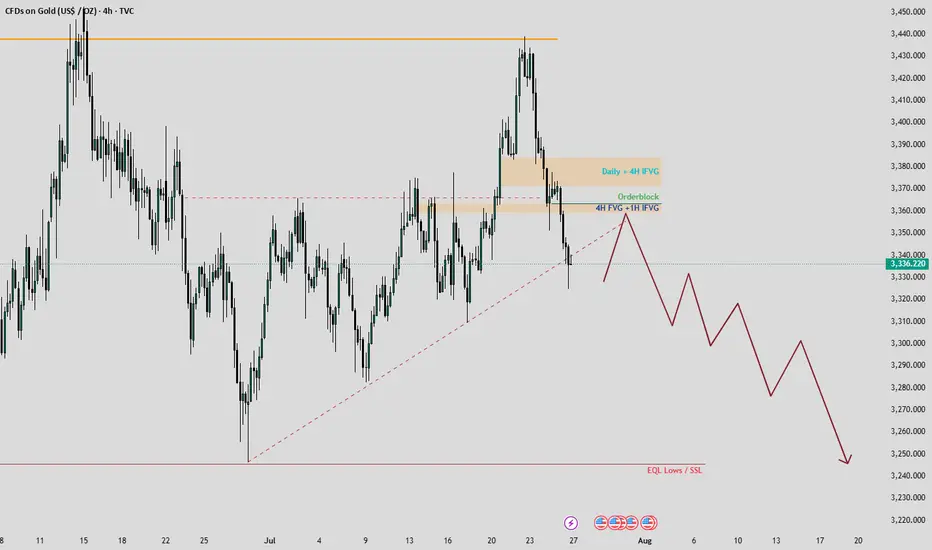
Gold Market Analysis: Seize the Bearish Opportunity!Hello, amazing traders! 📊 Last week, gold put both buyers and sellers through a rollercoaster, peaking at $3,439 on Monday and Tuesday before a sharp decline shook the market. The chart reveals a classic triangle pattern with a sneaky false breakout, designed to trap the unwary. Now, with the upside liquidity swept away, a bearish move is on the horizon—let’s break it down!
📈 Chart Insights
Take a look at the attached chart! Gold’s recent action highlights:
False Breakout: The price tricked traders with a brief surge, only to reverse sharply.
Target Zone: Equal Lows at $3,240 are the next key level to watch.
Retracements: Expect a pullback to the $3,360-$3,365 range, where order blocks, 4H Fair Value Gaps (FVG), and Hourly Imbalance Fair Value Gaps (IFVG) form a powerful demand zone.
🎯 Trading Plan
Entry Point: Prepare to short around $3,360-$3,365 as gold retraces to this strong PD Array.
Stop Loss: Place above $3,385 to avoid the daily and 4H FVG zone ($3,375-$3,385), which should act as resistance.
Target: Aim for $3,240, the Equal Lows, with updates on short-term targets to follow.
Note: The $3,375-$3,385 range is a balanced zone—unlikely to be revisited soon.
🚨 Why Act Now?
This setup offers a golden (or should I say bearish gold?) chance to capitalize on the market’s momentum. The chart’s clear levels and the false breakout signal a high-probability move. Stay tuned for real-time updates as we track this trade!
💬 Join the Conversation!
Loved this analysis? Hit the Like button to show your support! ❤️ Follow me for more actionable insights, and drop a comment below—where do you see gold heading next? Let’s build a thriving TradingView community together! 🙌
Happy trading, and may your trades be as sharp as this analysis! ✨
Gold Trading Strategy Reference On Monday✅ Gold Market Weekly Summary
Gold prices experienced significant volatility this week and ultimately closed lower on the weekly chart, failing to hold above the key $3400 level. Although the price briefly achieved a bullish breakout earlier in the week, the rally lacked follow-through, indicating weak bullish momentum and growing market indecision from a technical perspective.
✅ Detailed Review
Gold surged by 2.4% in the first two trading days of the week, but gave back nearly 3% over the last three sessions. The reversal was primarily driven by renewed optimism surrounding trade negotiations led by former President Trump, which boosted risk appetite and dampened safe-haven demand for gold.
✅ Outlook for Next Week
Investors will closely monitor the Federal Reserve’s policy meeting scheduled for July 29–30. Market expectations suggest an extremely low probability of a rate cut during this meeting, with the likelihood of holding rates steady in September rising to approximately 40%, up sharply from around 10% a month ago.
✅ If Fed Chair Jerome Powell highlights progress in trade agreements as a reduction in economic uncertainty—thereby leaving the door open for a September rate cut—U.S. Treasury yields may fall sharply, potentially boosting gold prices. Conversely, if Powell cites rising inflation data and avoids signaling any easing at the next meeting, gold may come under renewed pressure.
✅ Technical Analysis
Gold suffered a sharp decline on Friday, breaking below the key 4-hour trendline support at the $3335 level, which we previously identified. This triggered renewed bearish momentum, and the current price action reflects a clear downtrend. Unless a firm bottom is established, the bearish trend is likely to continue.
✅ Hourly Chart Structure
Volatility between bulls and bears was apparent this week. The price followed an ascending channel during the first half of the week but reversed sharply in the latter half, erasing gains and forming a new descending channel. The $3350 level now acts as a critical pivot point and will serve as the key resistance level for bearish strategies next week.
✅ Conclusion
Given that both the 4-hour and daily charts have broken major support levels, the outlook has shifted from a mildly bullish consolidation to a trend-following bearish stance.
✅ Trading Strategy Reference:
🔰 Entry: Consider initiating short positions around the $3350 level
⛔ Stop-Loss: Place stops above $3360
🔰 Targets: Initial target at $3325; if broken, look for further downside toward the $3310 area
🔥Trading Reminder: Trading strategies are time-sensitive, and market conditions can change rapidly. Please adjust your trading plan based on real-time market conditions. If you have any questions or need one-on-one guidance, feel free to contact me🤝
