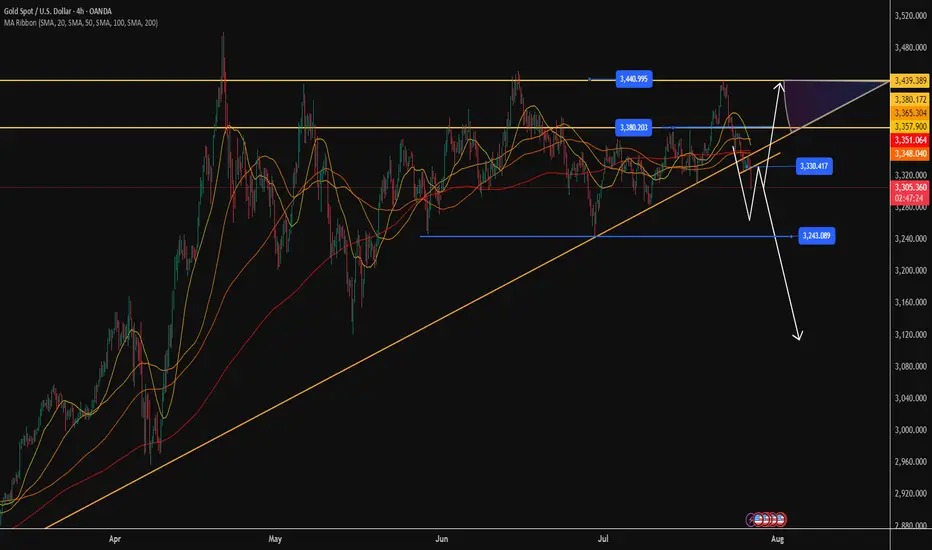
GoldTVC:GOLD price overall is bullish after NFP event on Friday, but now it's approaching for that resistance that can result in to price forming a H&S Patten On the H4 time frame. Now let's wait on price as it goes for that supply also an Oder block.
GOLDCFD trade ideas
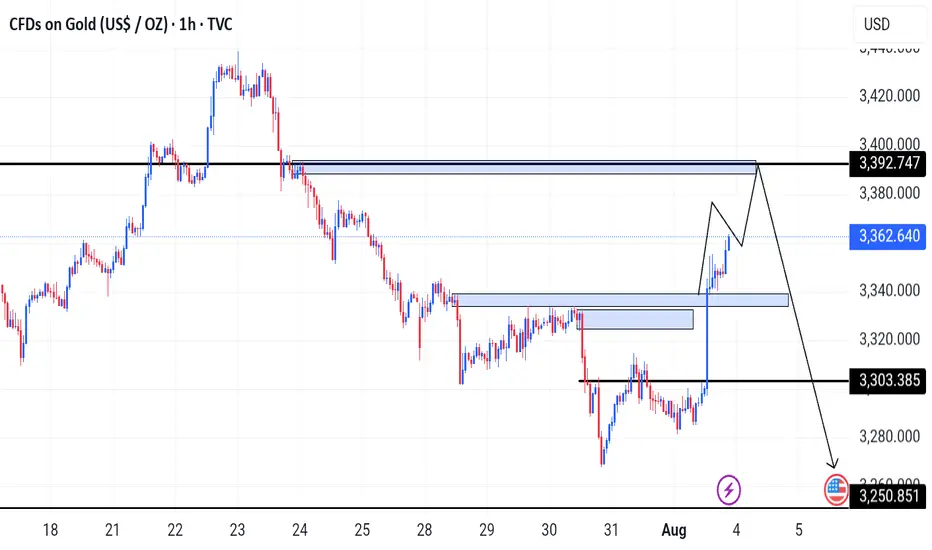
Smart Money / Price Action 5min scalping road map# 📈 ABC Pattern Explained for TradingView (Smart Money / Price Action)
The **ABC pattern** is a 3-leg corrective move in market structure, commonly used in price action, Elliott Wave, and Smart Money trading. It's mainly used to identify **pullbacks** or **correction zones** before a continuation of the main trend.
---
## 🔹 Structure of the ABC Pattern:
- **Point A**: The beginning of the move — often the end of a strong impulsive wave.
- **Point B**: The first retracement or pullback from Point A.
- **Point C**: The second corrective move that often goes beyond A, forming the completion of the correction phase.
The ABC legs can be:
- **A to B**: Impulsive or corrective.
- **B to C**: Generally a counter-trend retracement.
---
## 🔸 How to Identify on Chart:
1. **Find a strong trend** (uptrend or downtrend).
2. **Look for the first correction** — mark it as Point A to B.
3. **Next wave** that attempts to continue the trend but fails — mark the end as Point C.
4. **Use Fibonacci tools** to measure:
- **B retracement of A** (typically 50%–78.6%)
- **C extension** of AB (typically 127.2%–161.8%)
---
## 🔧 How to Draw on TradingView:
> You can use the `Trend-Based Fib Extension` tool or draw manually using the `Path` or `ABC pattern` tool.
### Step-by-Step:
1. Select the `ABC Pattern` tool from the **left toolbar** under “Prediction and Measurement Tools”.
2. Click on **Point A** (3320$).
3. Click on **Point B** (3350$).
4. Click on **Point C** (final corrective wave 3300$ ).
5. TradingView will automatically plot the shape with labels.
---
## 🧠 Pro Tips:
- Look for **liquidity sweep** or **order blocks** near Point C.
- Entry opportunity is often **after C**, targeting a **continuation** of the main trend.
- ABC is often part of **larger structures** like **complex pullbacks** or **smart money retracements**.
---
## ✅ Example Use:
- **Buy Scenario**:
- Strong uptrend → Price drops from A to B (retracement).
- Then price rises to C, failing to break above A → Possible new higher low formed.
- Enter long if price breaks above Point B again.
- **Sell Scenario**:
- Strong downtrend → A to B is a pullback.
- C attempts new high, fails → short entry after break of B.
---
## 📌 Settings Tip for Mobile Users:
- Zoom in for better point control.
- Use “Lock” feature to prevent accidental move.
- Customize color and label visibility in the style tab.
---
## 🔍 Keywords:
`ABC Pattern`, `Elliott Correction`, `Smart Money`, `Liquidity Grab`, `Break of Structure`, `Trend Continuation`, `Price Action Trading`, `Market Structure`
---

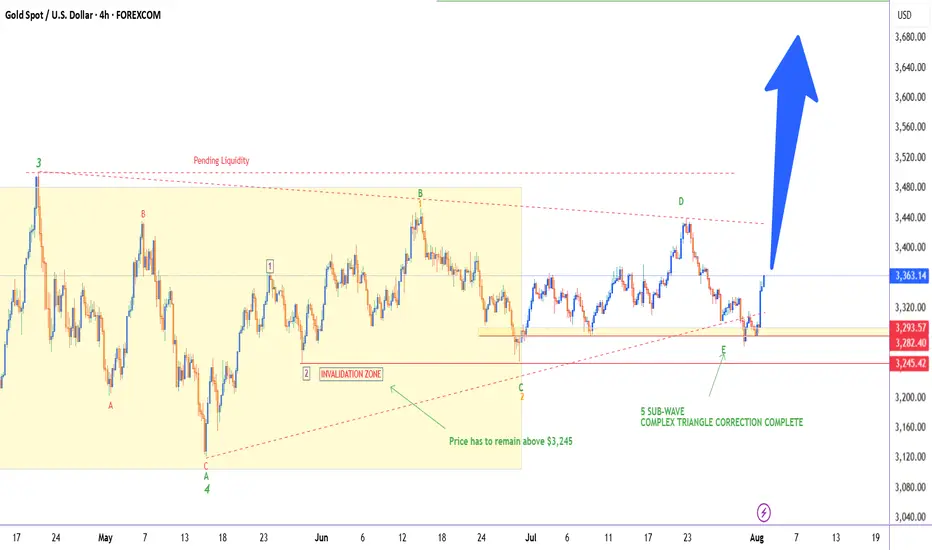
GOLD - WAVE 5 BULLISH TO $3,680As I said on our last update, this 'Gold Bullish Scenario' remains valid as price has still failed to close below $3,245 (Wave 2) low.
As long as Gold remains above Wave 2 high ($3,245), this Gold bullish bias remains an option. As traders we always have to be prepared to adapt to different market conditions.
Gold analysis and trading strategy for Monday✅ Fundamental Analysis
Friday’s Non-Farm Payrolls (NFP) data came in significantly below expectations, with new job additions falling far short of market forecasts. This sparked a sharp rise in expectations for a Fed rate cut later this year. As a result, the U.S. dollar index declined and gold prices surged violently, rallying from the 3281 level to a high of 3362 — a single-day gain of over $85, completely erasing the week's prior losses and reestablishing a strong bullish structure.
✅ Technical Analysis
📊 Weekly Chart
Gold posted a strong bullish weekly candlestick, reversing the previous consolidation trend and signaling a structural shift in market sentiment. Bulls have regained full control. The key resistance zone lies between 3380–3400; if price breaks and holds above this level, the next upside target will be around 3430.
📊 Daily Chart
Gold stabilized at the 3281 low and surged on Friday evening following the NFP surprise, closing near the day’s high — a sign of aggressive buying. The short-term trend has clearly reversed to the upside, and any pullback is now considered a buying opportunity. The key support has moved up to around 3335, serving as a critical pivot zone. Further support is seen near 3316, a previous swing low.
📊 Hourly Chart
Price is currently trading above short-term moving averages, indicating a strong bullish bias. The key level for a potential bullish continuation is around 3355, which represents a recent support-turned-resistance area. If price pulls back to this level and holds, or breaks above it directly, it will confirm bullish strength. If gold opens with a gap higher toward 3385, beware of potential short-term volatility due to a liquidity gap. Chasing highs in such scenarios requires caution.
🔴 Resistance Levels: 3375–3380 / 3400–3430
🟢 Support Levels: 3355–3340 / 3330–3335 / 3316
✅ Trading Strategy Reference
🔺 Primary Strategy – Buy on Dips:
🔰Consider long entries around 3340–3335, with a stop-loss below 3328.
🔰If the market remains strong, a direct long near 3355 is viable, targeting 3375 and above.
🔰A deeper pullback to 3330–3335 is a favorable entry zone for mid-term longs.
🔻 Secondary Strategy – Sell on Rebounds (Short-Term Only):
🔰If gold opens Monday with a sharp spike to around 3385 but fails to break higher, a light short position may be considered, targeting a quick $10–$15 pullback.
🔰If 3385 is broken and held, abandon short setups and revert to a bullish view.
✅ Overall Outlook
Gold has completed a technical reversal following the bullish fundamental catalyst from the NFP data. The trend has shifted from bearish to bullish, and the market has clearly moved into a higher price range. The core trading logic should remain “buy on dips”, and countertrend trades should be approached with caution. Look for long opportunities near key support levels, and consider short positions only at major resistance levels and for quick intraday trades. A confirmed breakout above 3375 will likely open the door to 3400–3430 in the near term
Gold Week 32 OutlookFollowing Non-farm payroll (NFP) on Friday, 01 August 2025, Gold started and maintained a bullish sentiment. With all things considered. It is likely to spend the early days of the week correcting before shooting back upwards towards Thursday/Friday.

Gold weekly chart with buy and sell entries plus swing trade ide1. Overall Chart Analysis
Timeframe and Trend: This 4-hour chart highlights a short-term downtrend with signs of exhaustion and consolidation. Gold peaked sharply on the left (possibly a local high around 2,400+), followed by a steep decline with lower highs and lower lows, forming what looks like a descending channel (diagonal trendlines connecting peaks and troughs). Recent candles show sideways ranging with smaller bodies and wicks, indicating indecision or a potential reversal setup. This could be a bear flag pattern or a base for accumulation.
Key Patterns:
Bearish Decline: Strong red candles early on suggest impulsive selling, possibly driven by external factors like USD strength or rising yields. However, the downtrend is losing steam, with recent bounces off lower levels.
Range-Bound Action: Price is trapped in a horizontal range (bounded by your marked lines), with dojis and spinning tops signaling buyer-seller balance. A breakout could lead to a volatile move.
Support and Resistance: Your green lines (lower) align with support zones where price has reversed upward multiple times. Red lines (upper) act as resistance caps, rejecting rallies.
Indicators (Inferred):
Moving Averages: Price is likely below key MAs (e.g., 50-period or 200-period EMA), confirming bearish bias. A golden cross (shorter MA crossing above longer) near green lines could validate buys.
RSI (Relative Strength Index): Potentially oversold (below 30) at green line tests, supporting buy entries. Neutral or overbought (above 70) near red lines would favor sells.
Volume and Momentum: Volume bars on the right show spikes on down moves but fading recently, hinting at bearish exhaustion. MACD might show narrowing histograms, indicating weakening momentum.
Volatility: If Bollinger Bands are applied, they're likely contracting, suggesting an imminent expansion (breakout).
Market Bias: Bearish in the short term due to the downtrend, but with bullish potential if support holds (gold's macro uptrend from inflation/geopolitical hedging). Watch for catalysts like US economic data or Fed announcements. The setup favors range trading (buy low, sell high) until a clear breakout.
Risk Considerations: Gold can move 50-100 pips per 4H candle; use tight stop-losses (SL) 1-2% away from entries. Risk no more than 1% of your account per trade. Multi-timeframe confirmation (e.g., daily chart) is recommended.
2. Analysis of Marked Levels and Entry Rationale
Your lines are horizontal, with green lines clustered at lower price levels (buy zones, e.g., around 2,300–2,320) and red lines at higher levels (sell zones, e.g., around 2,340–2,360). These appear to be based on prior price action (swing points). I'll group them by color and explain the technicals, drawing from support/resistance, patterns, Fibonacci, and momentum.
Green Lines: Potential Buy Entries (Bullish Setups)
These lower lines seem to mark strong support areas where price has bounced repeatedly, often with bullish candle formations. They could represent the floor of the descending channel or a demand zone.
Technicals Supporting Buys:
Support Zones: Green lines align with historical swing lows (e.g., visible double or triple bottoms in the chart's dips), where buyers have defended price. This creates a "value area" for accumulation, especially in gold's broader bullish context.
Candlestick Patterns: Bullish signals like hammers, bullish engulfing, or long lower wicks appear at these levels—indicating rejection of lower prices and potential reversal. For example, a green candle closing above the line after a touch would confirm entry.
Fibonacci Retracement: Drawing from the chart's high (left peak) to low, green lines likely hit key levels like 61.8% or 78.6% retracements—common for buying deep pullbacks in trending markets.
Momentum and Divergence: RSI bullish divergence (price lower lows, RSI higher lows) or an oversold reading supports upside. The downtrend's slowing pace (smaller red candles) suggests fading sellers.
Trend Context: These are counter-trend buys in a downtrend—ideal for scalps or reversals. Wait for confirmation, like a 4H close above the green line or increased volume.
Entry Strategy: Enter long on a retest of the green line with bullish confirmation (e.g., RSI >30 crossover). Place SL 20-30 pips below the line to account for wicks.
Suggested Take-Profit Levels:
TP1 (Conservative): Nearest minor resistance or 38.2% Fibonacci level—e.g., if entry at ~2,310, TP at 2,330 (1:1 risk-reward, ~20 pips profit for quick partial exit).
TP2 (Aggressive): Mid-range or next red line—e.g., 2,340–2,350 (1:2 ratio, scale out 50% of position).
Stretch TP3: If bullish breakout above the channel, target prior highs (e.g., 2,370–2,400). Trail stops using a 20-period MA or ATR-based levels for dynamic exits.
Red Lines: Potential Sell Entries (Bearish Setups)
These upper lines appear to cap price action, with rejections forming bearish patterns. They could be the ceiling of the channel or supply zones.
Technicals Supporting Sells:
Resistance Zones: Red lines correspond to prior swing highs (e.g., failed rallies in the mid-chart), round psychological numbers, or the upper channel boundary. Multiple touches with downside reversals confirm seller control.
Candlestick Patterns: Bearish indicators like shooting stars, bearish engulfing, or long upper wicks at red lines signal rally failures—sellers stepping in aggressively.
Fibonacci Extension/Retracement: From the downtrend's wave, red lines might align with 38.2% or 50% retracements—prime spots for selling into strength within a bearish structure.
Momentum Indicators: RSI overbought (above 70) or bearish divergence (price higher highs, RSI lower highs) at these levels reinforces downside. MACD line cross below signal line could trigger entries.
Trend Context: Aligns perfectly with the downtrend's "sell the rallies" mantra. The overall lower highs pattern suggests continuation unless broken.
Entry Strategy: Enter short on a rejection from the red line (e.g., red candle close below it with volume). Place SL 20-30 pips above the line.
Suggested Take-Profit Levels:
TP1 (Conservative): Nearest minor support or green line below—e.g., if entry at ~2,350, TP at 2,330 (1:1 ratio, ~20 pips for scalping).
TP2 (Aggressive): Lower range or channel support—e.g., 2,310–2,300 (1:2 ratio, partial close).
Stretch TP3: If bearish breakdown below green lines, target extended supports (e.g., 2,280–2,250 via 161.8% Fibonacci extension). Trail stops with a parabolic SAR or based on recent swing lows.
3. Additional Suggestions and Scenarios
Breakout Scenarios:
Bullish Breakout: A strong close above the highest red line (e.g., on high volume or positive news) invalidates sells—switch to longs targeting 2,400+ (macro resistance).
Bearish Breakdown: Close below the lowest green line accelerates downside to 2,250–2,280 (next major support, possibly a monthly low).
Risk-Reward and Position Management:
Prioritize 1:2+ RR (e.g., risk 20 pips to gain 40+). Use partial profits: Exit 50% at TP1, trail the rest.
Combine with oscillators: Avoid buys if RSI <20 (extreme oversold) or sells if >80 (overbought).
Time of Day: Gold volatility peaks in NY/London sessions; avoid thin markets.
Potential Biases or Warnings:
Gold's inverse correlation to USD (check DXY) or bonds could override technicals—e.g., a weak USD might break red lines upward.
The range is tightening; a false breakout is possible. If consolidation persists, consider straddle strategies.
This is a technical view only; fundamental shifts (e.g., Middle East tensions boosting gold) could alter dynamics.

Gold looks like still having Bullish Momentum Based on current situation, XAUUSD looks like still having bullish momentum. looks at momentum candle, it like give early signal of next pole movement.
I just labelled two significant zone that I think, it is possible to create an edge. Even though, just wait for price action.

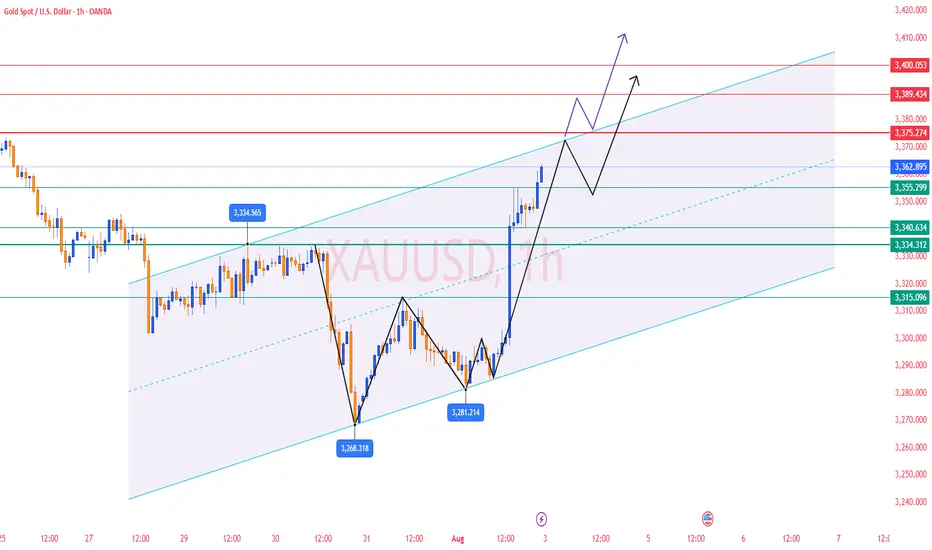
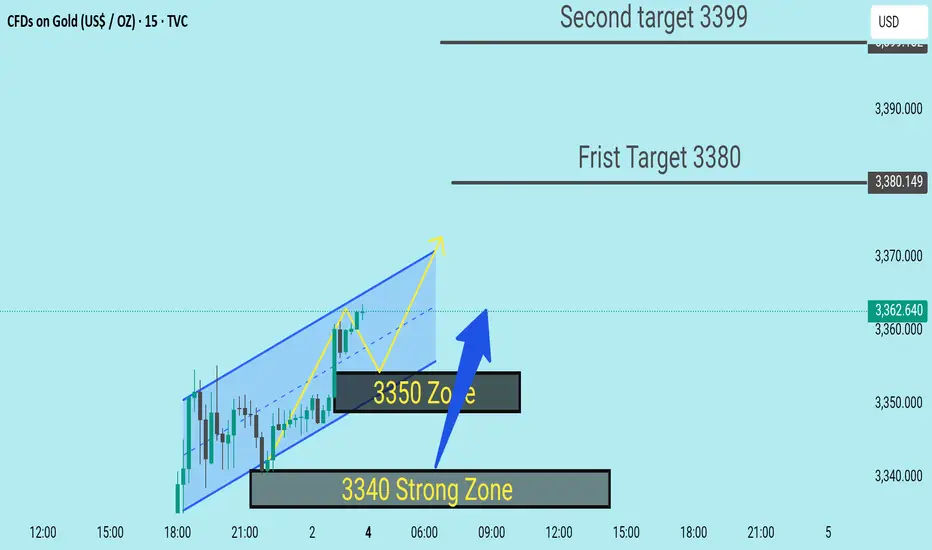
XAUUSD Expecting bullish Movement Price respected the Strong Demand Zones at 3350 & 3340, showing clear signs of buyer strength. After forming a falling wedge pattern, a bullish breakout was observed — confirming potential upside momentum.
Zone Analysis
3350 Zone: Minor support confirmed with consolidation
3340 Zone: Stronger support with buying pressure visible
Current Price: 3362
First Target: 3380
Second Target: 3399
A clean move above the wedge resistance is now playing out, and as long as price holds above 3350, bullish momentum remains valid.
Monitoring price action around 3380 for partials, and watching for clean sweep into 3399
Target 3470 Tests zone Gold will going towards 3470/3480 zone for retesting area its because of fill imbalance over long term candle stick , Two area need to watched one 3470/3480 or 3520

ATH - Not in my watch for nowAs mentioned in my last post, Gold won't be pushing to break ATH unless there's an unusual catalyst that attracts it. Range bound trading is still the play, especially as we're coming into August. Save your ammunition for the Fall season, reduce your position and trade conservatively to build your equity safely. The USD has some room leg room to push higher in the short term that should hinder the yellow metal to go full bore.

Bullish
Description
Hi traders
I think after the fake break that happened last week at 3280, we should be ready to move higher with a target of 3430-3450 and if the fundamentals are impressive, even a break of the previous high.
Of course, the resistance zone of 3385-3405 is in the way of the price.
I hope that the analysis I am providing is accurate and effective.
Possible positions this week
A:Suitable prices for BUY positions
1)3345-3340
2)3174-3150
B:Suitable prices for SELL positions
1)3385-3405(Of course, with approval from the market and the type of candles)
This is just an analysis and everyone is responsible for their own work.
Hoping for a good and profitable week.

Gold ready to create new all time high!!!Buy: $3447.28
Set up: wait for a breakout and hidden bullish divergence on a weekly basis.
Sl: $3183.11

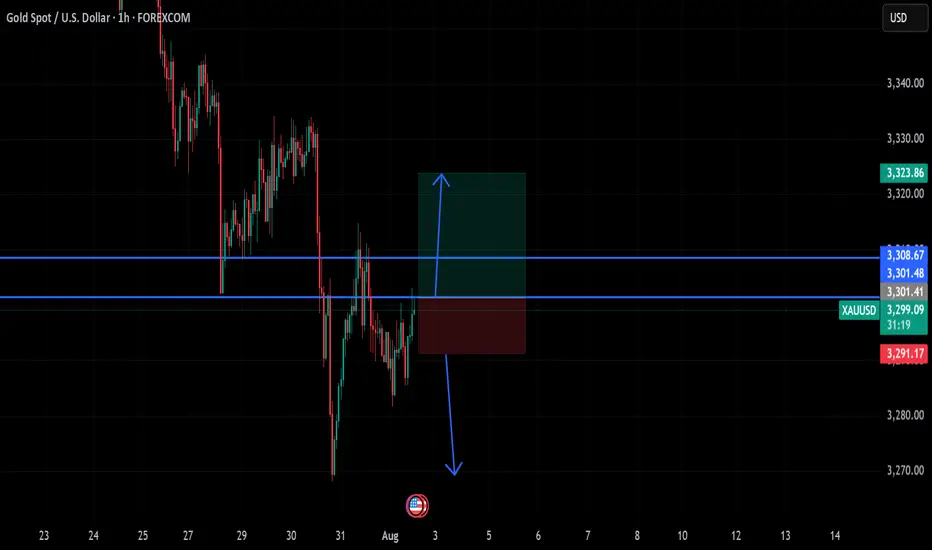
gold on third pattern breakout#XAUUSD have multiple test the third pattern, now price forming needs to breakout the 3308 before any further movement.
Buy entry 3301.4, TP 3308-3323.
Below 3291 holds a very strong bearish continuation, if breakout price will fall till 3269
XAUUSD Gold Trading Strategy August 1, 2025
Yesterday's trading session, gold prices recovered to the 3315 area and then continued to decrease to the 3281 area. Currently, gold prices are fluctuating quite unpredictably due to the impact of tariff news and investor confidence.
Basic news: The Federal Reserve FED continues to maintain the federal funds benchmark interest rate in the range of 4.25% - 4.50%, in line with policy since 2025. Chairman Powell did not give any signal about the next interest rate cut on September 16 - 17.
Technical analysis: After falling sharply to the 3269 area, gold prices are showing signs of recovery. In the current downtrend channel, there has been a higher bottom than the bottom at H1. We can see that if the bullish pattern at H1 is confirmed, combined with the reversal candlestick appearing at H4, the possibility of gold bouncing back to reach the resistance area of 3330, even 3350 is completely possible. In the weekend trading session, we will wait at the support zones to trade.
Important price zones today: 3280 - 3285 and 3269 - 3274.
Today's trading trend: BUY.
Recommended orders:
Plan 1: BUY XAUUSD zone 3283 - 3285
SL 3280
TP 3288 - 3300 - 3310 - 3330.
Plan 2: BUY XAUSD zone 3269 - 3271
SL 3266
TP 3274 - 3284 - 3300 - 3320.
Wish you a safe, favorable and profitable trading day.🥰🥰🥰🥰🥰

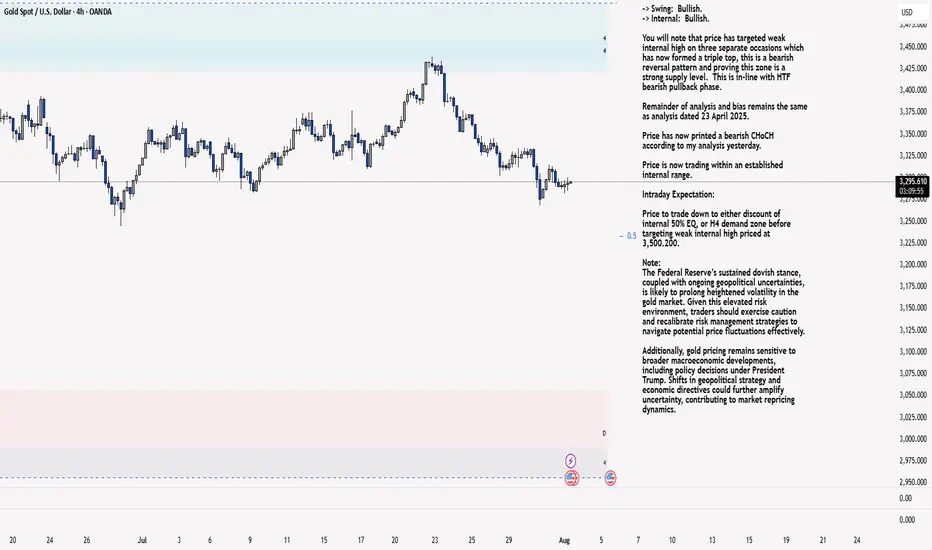
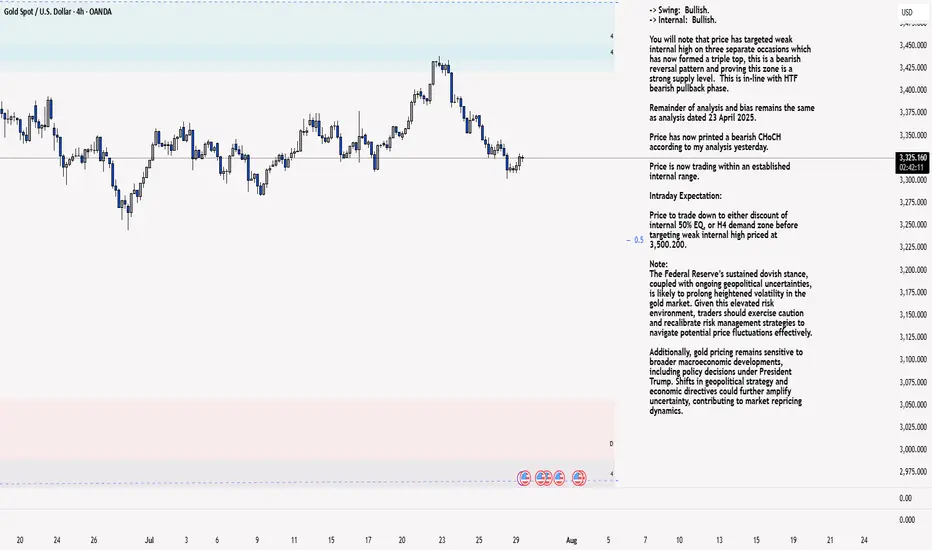
XAU/USD 01 August 2025 Intraday AnalysisH4 Analysis:
-> Swing: Bullish.
-> Internal: Bullish.
You will note that price has targeted weak internal high on three separate occasions which has now formed a triple top, this is a bearish reversal pattern and proving this zone is a strong supply level. This is in-line with HTF bearish pullback phase.
Remainder of analysis and bias remains the same as analysis dated 23 April 2025.
Price has now printed a bearish CHoCH according to my analysis yesterday.
Price is now trading within an established internal range.
Intraday Expectation:
Price to trade down to either discount of internal 50% EQ, or H4 demand zone before targeting weak internal high priced at 3,500.200.
Note:
The Federal Reserve’s sustained dovish stance, coupled with ongoing geopolitical uncertainties, is likely to prolong heightened volatility in the gold market. Given this elevated risk environment, traders should exercise caution and recalibrate risk management strategies to navigate potential price fluctuations effectively.
Additionally, gold pricing remains sensitive to broader macroeconomic developments, including policy decisions under President Trump. Shifts in geopolitical strategy and economic directives could further amplify uncertainty, contributing to market repricing dynamics.
H4 Chart:
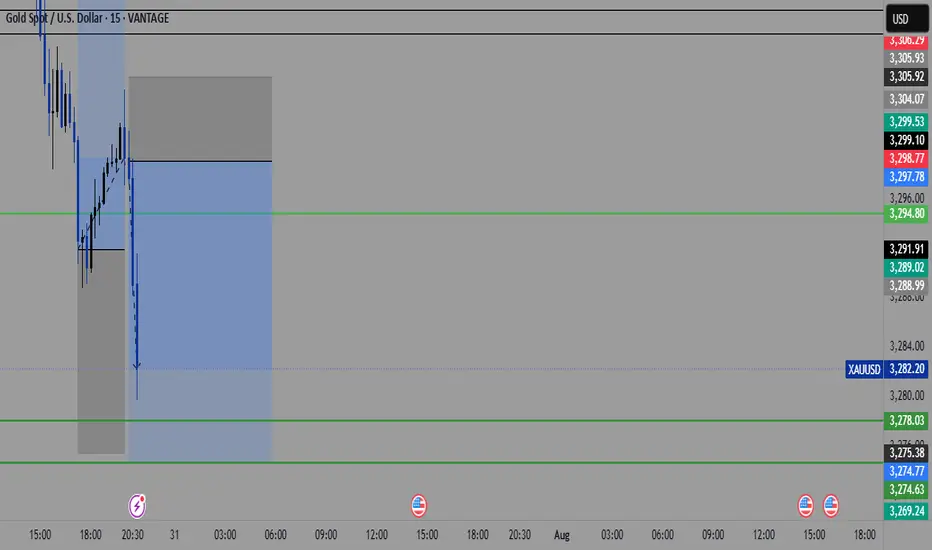
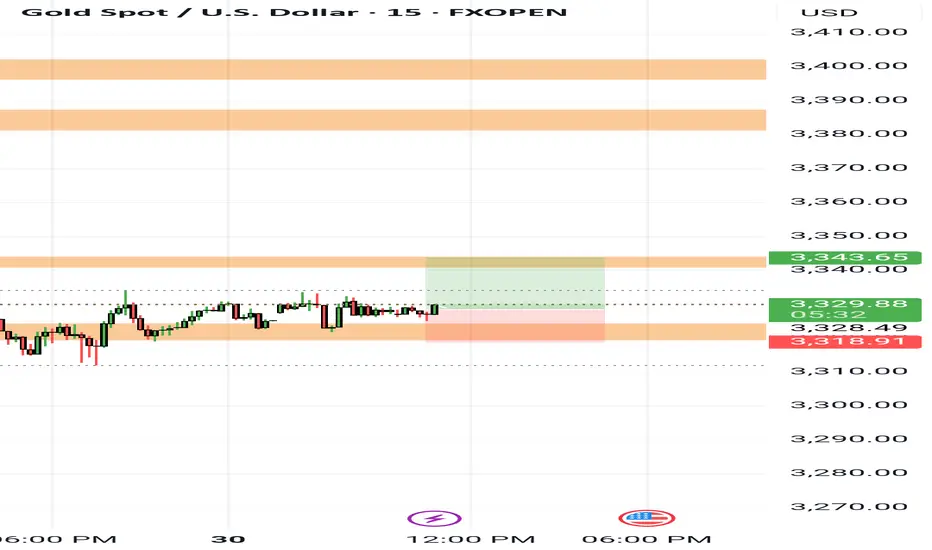
M15 Analysis:
-> Swing: Bullish.
-> Internal: Bullish.
H4 Timeframe - Price has failed to target weak internal high, therefore, it would not be unrealistic if price printed a bearish iBOS.
The remainder of my analysis shall remain the same as analysis dated 13 June 2025, apart from target price.
As per my analysis dated 22 May 2025 whereby I mentioned price can be seen to be reacting at discount of 50% EQ on H4 timeframe, therefore, it is a viable alternative that price could potentially print a bullish iBOS on M15 timeframe despite internal structure being bearish.
Price has printed a bullish iBOS followed by a bearish CHoCH, which indicates, but does not confirm, bearish pullback phase initiation. I will however continue to monitor, with respect to depth of pullback.
Intraday Expectation:
Price to continue bearish, react at either M15 supply zone, or discount of 50% internal EQ before targeting weak internal high priced at 3,451.375.
Note:
Gold remains highly volatile amid the Federal Reserve's continued dovish stance, persistent and escalating geopolitical uncertainties. Traders should implement robust risk management strategies and remain vigilant, as price swings may become more pronounced in this elevated volatility environment.
Additionally, President Trump’s recent tariff announcements are expected to further amplify market turbulence, potentially triggering sharp price fluctuations and whipsaws.
M15 Chart:
Interest rates unchanged, sticking to my bearish idea.Look at my other posts and you''ll understand as to why, I was telling everyone to sell. There was a small sellers trap, we pushed up, at that moment I already had closed my positions. Now we go down to the other key levels. I'm done till the end of August. Will still post my setups, but won't take any trades. Stay safe and keep your funds safe. Hella Love!
Gold intraday downside
Gold intraday: down trend, short position below 3335 with target 3296 and 3278. Long position 3274-3280.

XAU/USD 29 July 2025 Intraday AnalysisH4 Analysis:
-> Swing: Bullish.
-> Internal: Bullish.
You will note that price has targeted weak internal high on three separate occasions which has now formed a triple top, this is a bearish reversal pattern and proving this zone is a strong supply level. This is in-line with HTF bearish pullback phase.
Remainder of analysis and bias remains the same as analysis dated 23 April 2025.
Price has now printed a bearish CHoCH according to my analysis yesterday.
Price is now trading within an established internal range.
Intraday Expectation:
Price to trade down to either discount of internal 50% EQ, or H4 demand zone before targeting weak internal high priced at 3,500.200.
Note:
The Federal Reserve’s sustained dovish stance, coupled with ongoing geopolitical uncertainties, is likely to prolong heightened volatility in the gold market. Given this elevated risk environment, traders should exercise caution and recalibrate risk management strategies to navigate potential price fluctuations effectively.
Additionally, gold pricing remains sensitive to broader macroeconomic developments, including policy decisions under President Trump. Shifts in geopolitical strategy and economic directives could further amplify uncertainty, contributing to market repricing dynamics.
H4 Chart:
M15 Analysis:
-> Swing: Bullish.
-> Internal: Bullish.
H4 Timeframe - Price has failed to target weak internal high, therefore, it would not be unrealistic if price printed a bearish iBOS.
The remainder of my analysis shall remain the same as analysis dated 13 June 2025, apart from target price.
As per my analysis dated 22 May 2025 whereby I mentioned price can be seen to be reacting at discount of 50% EQ on H4 timeframe, therefore, it is a viable alternative that price could potentially print a bullish iBOS on M15 timeframe despite internal structure being bearish.
Price has printed a bullish iBOS followed by a bearish CHoCH, which indicates, but does not confirm, bearish pullback phase initiation. I will however continue to monitor, with respect to depth of pullback.
Intraday Expectation:
Price to continue bearish, react at either M15 supply zone, or discount of 50% internal EQ before targeting weak internal high priced at 3,451.375.
Note:
Gold remains highly volatile amid the Federal Reserve's continued dovish stance, persistent and escalating geopolitical uncertainties. Traders should implement robust risk management strategies and remain vigilant, as price swings may become more pronounced in this elevated volatility environment.
Additionally, President Trump’s recent tariff announcements are expected to further amplify market turbulence, potentially triggering sharp price fluctuations and whipsaws.
M15 Chart:

BOS into Downtrend I think price is going down to the higher level support to sweep liquidity and go back to continue into the uptrend

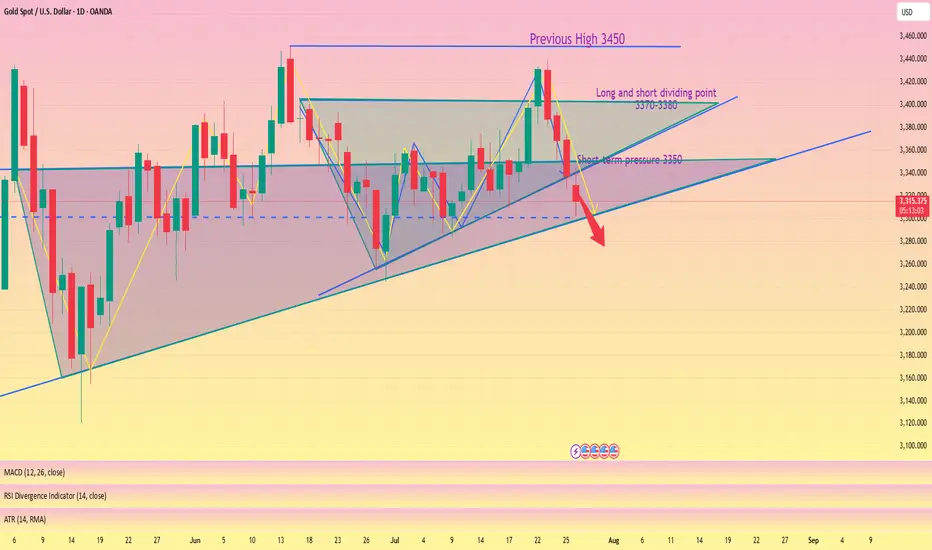
3300 may fall below, possibly setting a new low#XAUUSD
From the daily chart perspective, gold has a tendency to form a converging triangle, and observing the technical indicators of the daily chart, the downward trend may have just begun📉.
So, how should we plan for the evening?📊 Now there are certainly many outside buyers who will continue to increase their positions and try to recover their losses💰. So, should we continue to be long?📈 My opinion is to wait and see.👀 If the daily chart does not fall below 3300 points, it will consolidate between 3300 and 3350 points in the future. If it falls below 3300 points, we will next focus on the support level of 3295-3285 points, and then consider whether to go long🤔.
If you are more aggressive, you can consider going long near 3305 points and exit after earning $10-20. All opinions have been informed and everyone can choose to adopt them according to their own circumstances.😄
Gold price final game: 3300Gold price final game: 3300
Today's gold price is on the verge of collapse, but the direction divergence still exists, with long and short intertwined.
Pay attention to the 3300 support.
The entire triangle convergence and oscillation pattern has been broken, and the important support platform before 3330 points has been broken.
Regardless of how the policy is announced,
shorting is inevitable.
Next, the bulls will enter the final bottom-picking stage:
Buy: 3300-3310
Stop loss: 3290
Target: 3330-3340+
Technical analysis:
Short-term support level: 3300
Short-term resistance level: 3330-3345
Market sentiment: The gold market sentiment presents a pattern of long and short intertwined and weak volatility.
In the short term, pay attention to the $3300 support level and the Fed's interest rate cut policy signal.
If the Fed turns to interest rate cuts or geopolitical conflicts escalate, gold may resume its upward trend.
Daily operation suggestions:
Long-term thinking: Bottom-picking thinking: Bottom-picking range: 3300-3310
Stop loss: 3290
Target: 3330-3345+
Short-term thinking: Trend-following thinking: High-altitude range: 3320-3330
Stop loss: 3345
Target: 3300-3280-3250
Final game of gold price: 3300
Today's gold price is on the verge of collapse, but the direction divergence still exists, and long and short positions are intertwined.
Pay attention to the 3300 support.
The entire triangle convergence and oscillation pattern has been broken, and the important support platform before 3330 points has been broken.
Regardless of how the policy is announced,
shorting is inevitable.
Next, the bulls will enter the final bottom-picking stage:
Buy: 3300-3310
Stop loss: 3290
Target: 3330-3340+
Technical analysis:
Short-term support: 3300
Short-term resistance: 3330-3345
Market sentiment: The gold market sentiment shows a pattern of mixed long and short positions and weak volatility.
In the short term, pay attention to the $3,300 support level and the Fed's interest rate cut policy signal.
If the Fed turns to interest rate cuts or geopolitical conflicts escalate, gold may resume its upward trend.
Daily operation suggestions:
Long-term thinking: bottom-picking thinking: bottom-picking range: 3300-3310
Stop loss: 3290
Target: 3330-3345+
Short-term thinking: trend-following thinking: high-altitude range: 3320-3330
Stop loss: 3345
Target: 3300-3280-3250