gold is in the range of 3440-3325gold is still in formation of penant in the higher time frame and currently has just given a sign of bullish after the 3 days bearish.
certain key levels to look out for.
3325, 3347, 3365, 3373,3393, 3402.
still sideways.
GOLDCFD trade ideas

GOLD - W30📅 Gold Weekly Outlook (July 29 – Aug 2, 2025)
Current Price: ~$3,336
Last Week: Rejected near $3,400+, bearish weekly close expected.
🔍 Key Levels
Resistance: $3,365 → $3,380 → $3,400
Support: $3,330 → $3,310 → $3,275
⚠️ Why It Moved
Strong dollar & fading rate cut hopes pressured gold.
Risk sentiment improved → gold demand dropped.
📉 Outlook
Bearish bias if price stays below $3,365.
Watch for bounce near $3,310, but no reversal yet.
Break below $3,310 opens downside to $3,275.
✅ Trade Setup #1 – Sell the Pullback
Type: Short
Entry: $3,360–$3,370 (if price retests broken support)
Stop Loss: Above $3,380
Take Profit:
TP1: $3,330
TP2: $3,310
TP3: $3,275
Condition: Only take this if price fails to break $3,370 and shows bearish rejection (e.g., wick or bearish candle)
✅ Trade Setup #2 – Buy on Support Bounce
Type: Long (counter-trend, risky)
Entry: $3,310–$3,320 zone
Stop Loss: Below $3,295
Take Profit:
TP1: $3,340
TP2: $3,365
Condition: Only if bullish reversal pattern forms (e.g., hammer, bullish engulfing)
🗓️ Events to Watch
Wed: FOMC rate decision
Fri: US Non-Farm Payrolls
GOLD POSSIBLE SHORT (LT Buy Oriented)Things are starting to calm down. Gold might see a shift in demand and calm down.
Report - 29 jully, 2025Summary
Initial optimism following the historic US–EU trade agreement has swiftly eroded as France and Germany openly criticized the deal, warning it undermines EU sovereignty and economic stability. The euro fell sharply, carmakers led equity declines, and political fractures within the bloc widened. While the deal averted a full-blown trade war, concerns over inflation, competitiveness, and regulatory submission have shifted sentiment. The perception of European capitulation under pressure from Trump has reignited transatlantic tensions and injected fresh volatility into global markets.
This retreat in EU support underscores the precarious nature of transatlantic cooperation under Trump’s economic nationalism. Meanwhile, signs of tech decoupling, tariff expansion beyond the EU, and deferred retaliation signal a fractured global trade order. European fiscal policy, particularly Germany’s defense-driven deficit expansion, is now under heightened scrutiny amid market volatility and FX pressure.
Market Reactions
Equity markets across the EU opened higher on tariff relief expectations but reversed course as Germany’s Chancellor Merz and France’s Prime Minister Bayrou denounced the deal. The DAX fell 1.1%, CAC 40 slipped 0.4%, and eurozone auto stocks plunged 1.8%. The euro lost over 1% against the dollar in its second-largest daily drop this year, reflecting concern over structural imbalance and political subordination.
In contrast, semiconductor stocks surged, with ASML and BE Semiconductor rising over 4% as the tech sector escaped tariffs. Wall Street remained relatively stable, buoyed by optimism around defense, energy, and tech sectors gaining from the deal. The dollar index (DXY) rose 0.9%, reflecting both euro weakness and expectations that inflationary tariffs could keep Fed rates elevated.
Fiscal and Political Implications
The backlash from Berlin and Paris lays bare deep fractures within the EU regarding its posture toward Washington. Chancellor Merz’s warning of "considerable damage" and Bayrou’s reference to EU “submission” cast doubt on Ursula von der Leyen’s negotiation strategy. The deal’s imposition of a 15% baseline tariff—triple the pre-deal weighted average—exposes Europe to substantial cost increases without achieving reciprocal liberalization.
Internally, the European Commission is accused of caving to U.S. pressure while undermining its own credibility. Documents and diplomatic leaks suggest that more aggressive retaliatory planning was watered down due to fears of a broader security rupture, particularly concerning NATO and U.S. arms support to Ukraine. This reinforces the EU’s strategic dependency, limiting its ability to resist U.S. economic coercion.
Germany’s effort to shield its auto industry via offset schemes largely failed, while Brussels’ “trade bazooka” was shelved in favor of “strategic patience.” This perceived capitulation may embolden further unilateral action from the U.S., especially as Trump eyes tariffs on pharmaceuticals and rest-of-world imports up to 20%.
Strategic Forecasts
Europe's short-term economic outlook has darkened. The tariff burden—especially on high-margin exporters like German autos—raises inflation risks while lowering competitiveness. Political backlash could destabilize Commission leadership and provoke calls for more aggressive economic sovereignty.
Expect further euro weakness, sectoral underperformance in autos and industrials, and possibly downgrades to GDP forecasts across the eurozone. On the U.S. side, Trump’s success with transatlantic leverage may embolden him to expand tariff threats to Asia and Latin America. The Fed will likely face a more inflationary policy environment, with fiscal and protectionist stimulus prolonging higher rate expectations.
Simultaneously, China's relief from U.S. tech export freezes—designed to secure a Xi-Trump summit—adds complexity to the strategic tech rivalry. The suspension of chip export controls could spur near-term capital inflows to Chinese AI firms while igniting concern in U.S. defense circles.
Risks and Opportunities
Risks
Breakdown in EU cohesion and trust in Commission leadership
Expansion of U.S. tariffs to rest of world (ROW), escalating global trade friction
Retaliation by China if U.S. chip diplomacy reverses
Drag on European industrial profits and inflation-driven ECB recalibration
Fed rate path upwardly skewed due to structural tariff-driven inflation
Opportunities
U.S. defense and energy sectors benefit from guaranteed EU purchases
Semiconductors remain shielded, with valuation support in ASML, TSMC, Nvidia
Dollar strength provides tactical trades in EURUSD, GBPUSD
Select EM exporters (e.g. Brazil) benefit from re-diversified trade flows
AI hardware and chip infrastructure (Samsung–Tesla deal) gains strategic momentum
Key Asset Impact – Outlook
XAUUSD (Gold):
Gold holding firm around $3,340. With fresh political discord and rising protectionist inflation, gold remains a hedge. If Fed signals rate hold, expect a push to $3,400.
Bias: Bullish
S&P 500:
Resilient, driven by defense, energy, and AI. But prolonged strong dollar and tariff-induced input cost pressures are risk factors.
Bias: Moderately Bullish
Dow Jones:
Benefiting from defense and dividend-heavy mix, but under pressure from industrial drag.
Bias: Neutral to Bullish
DXY (US Dollar Index):
Strengthening on euro weakness and policy divergence. However, long-term Fed autonomy concerns and political volatility could reverse trend.
Bias: Bullish short-term, Neutral longer-term
USDJPY:
Little movement today. BoJ still cautious, yen capped unless Fed shifts dovish or global risk-off resumes.
Bias: Range-bound
EURUSD:
Second-largest single-day drop YTD. Political backlash and export headwinds limit upside.
Bias: Bearish
Crude Oil (WTI):
Flat to slightly higher, supported by EU commitment to U.S. energy, but demand data remains soft.
Bias: Neutral
Stoxx Autos:
Heavy selloff (-1.8%) despite tariff reduction, reflecting margin pressure.
Bias: Bearish
ASML / BE Semiconductor:
Relief rally on tariff exclusion. Long-term tailwinds from open AI infrastructure and Samsung–Tesla chip deal.
Bias: Bullish
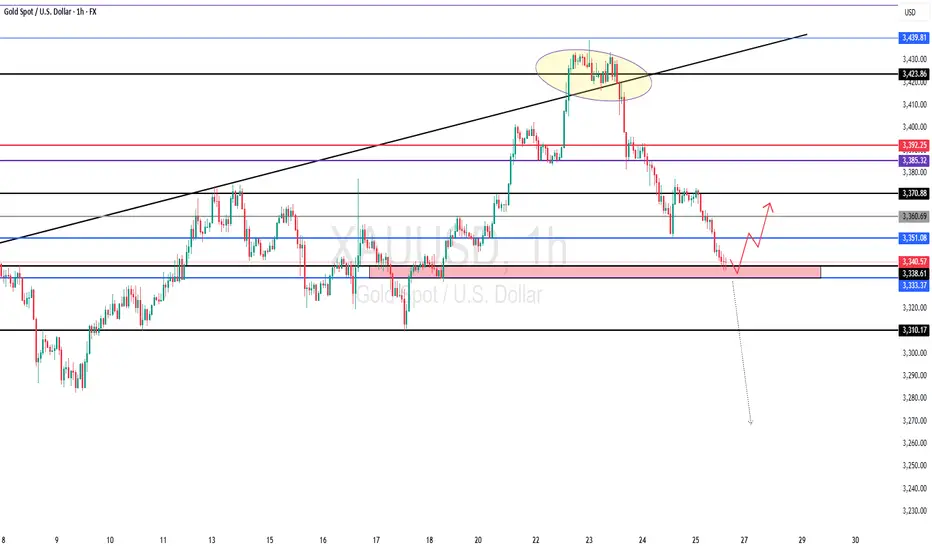
GOLD Drops $60 – Bearish Bias Holds Below 3365GOLD | OVERVIEW
As expected, gold continued its bearish momentum, dropping from the 3430 level and delivering a move of approximately $60.
For today, the bearish bias remains valid as long as the price stays below 3365, with potential targets at 3337 and 3320.
However, if the price reverses and stabilizes above 3365, it could signal a shift to bullish momentum.
Key Levels:
Support: 3355 · 3337 · 3320
Resistance: 3374 · 3388
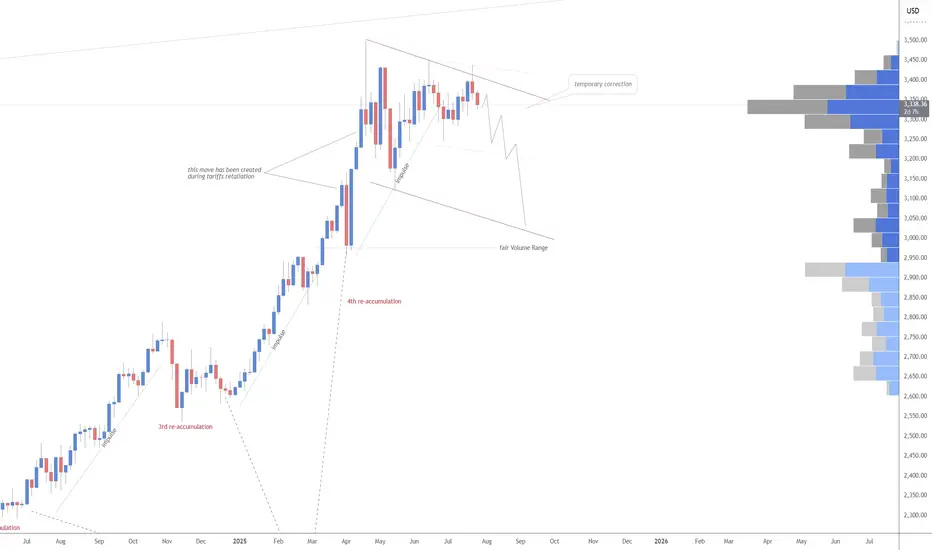
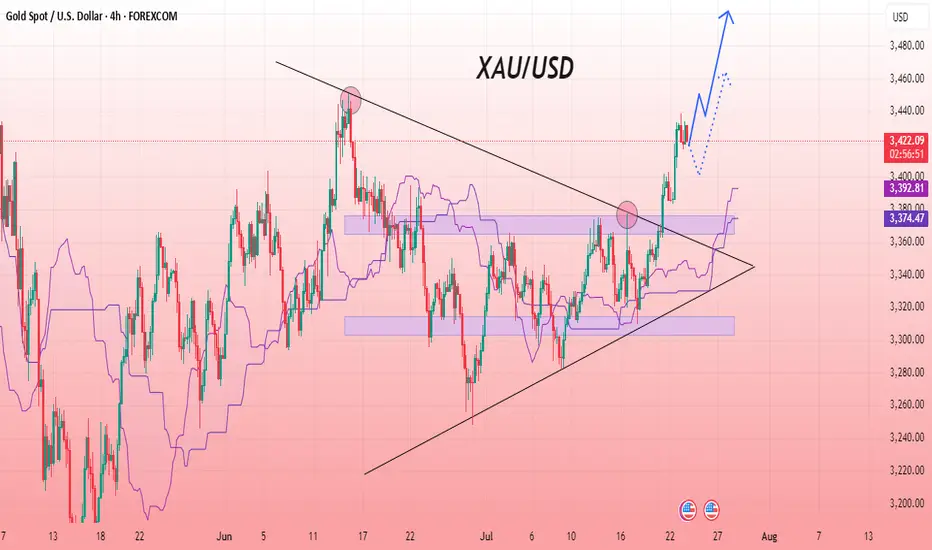
XAU/USD Powerful Bullish Rally AheadThe XAU/USD 4-hour chart shows a decisive breakout from a symmetrical triangle pattern, signaling a shift towards bullish momentum. Price action has moved strongly above the upper trendline, indicating that buyers are in control. The Ichimoku cloud provides additional confirmation of the uptrend, with price holding well above the cloud zone. Previous resistance areas have been converted into support, and the upward projection suggests potential continuation of the rally. The chart structure reveals consistent higher highs and higher lows, which further supports bullish sentiment. As long as the price remains above the breakout zone and maintains strong volume, the trend is expected to extend upward, reflecting strong market confidence in gold’s short-term growth.
Entry Buy : 3420
First Target :3450
Second Target :3500
If you found this analysis helpful, don’t forget to drop a like and comment . Your support keeps quality ideas flowing—let’s grow and win together! 💪📈
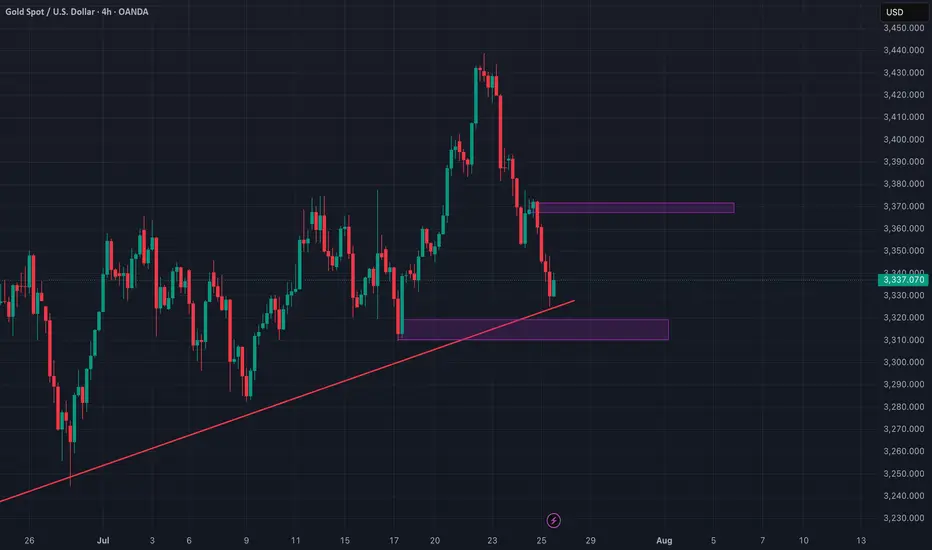
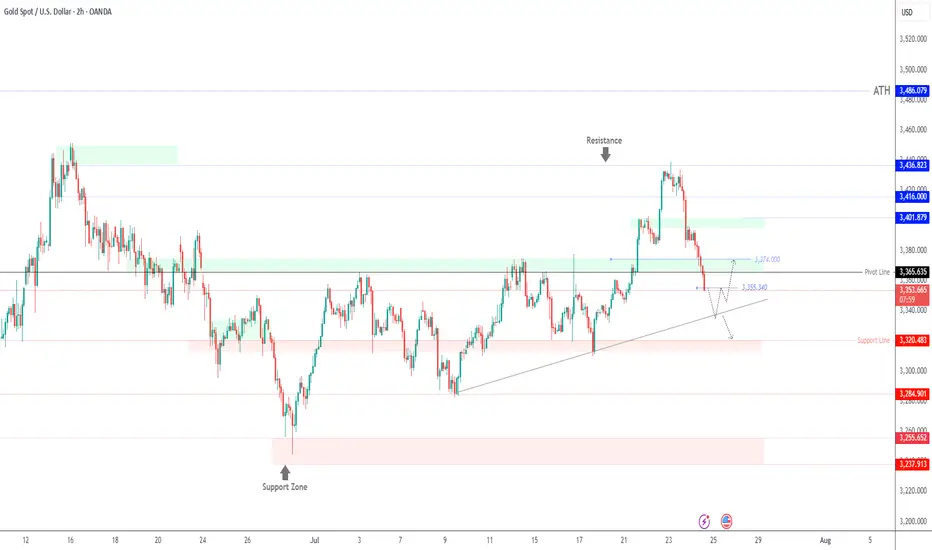
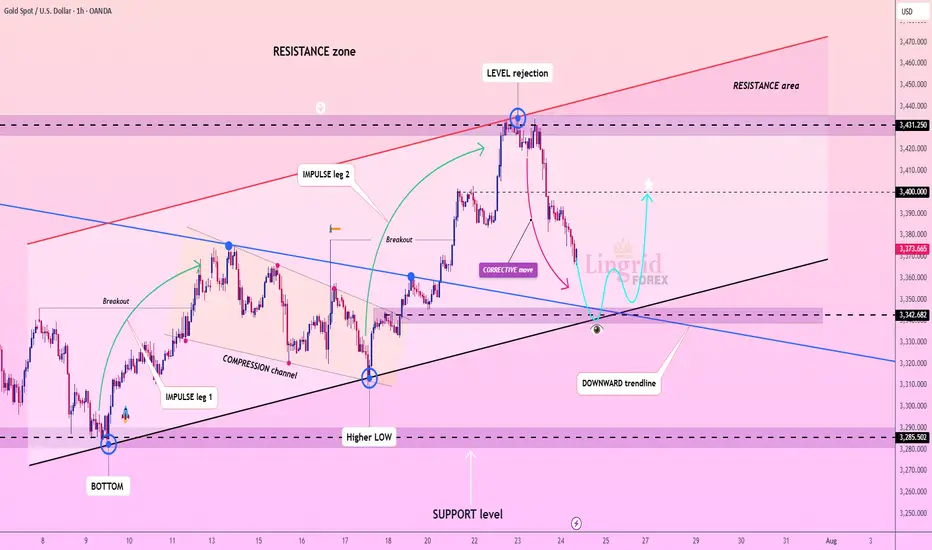
Lingrid | GOLD Corrective Move: Potential Long Trade OpportunityThe price perfectly fulfilled my last idea . OANDA:XAUUSD is pulling back sharply after facing rejection from the key resistance level at 3431, following a two-leg impulse wave. The structure shows a correction within an active uptrend, nearing confluence support from the upward trendline and horizontal level. As long as price holds above 3342, a bounce and continuation toward 3400 remain the favored scenario. Broader bullish structure and momentum buildup point to a possible resumption after the current retracement.
📉 Key Levels
Buy trigger: Break above 3350
Buy zone: 3345 – 3340
Target: 3400
Invalidation: Break below 3320
💡 Risks
Failure to hold the upward trendline could shift momentum
Weak bounce may trap buyers before real breakout
Resistance at 3400 could remain firm without stronger volume support
If this idea resonates with you or you have your own opinion, traders, hit the comments. I’m excited to read your thoughts!
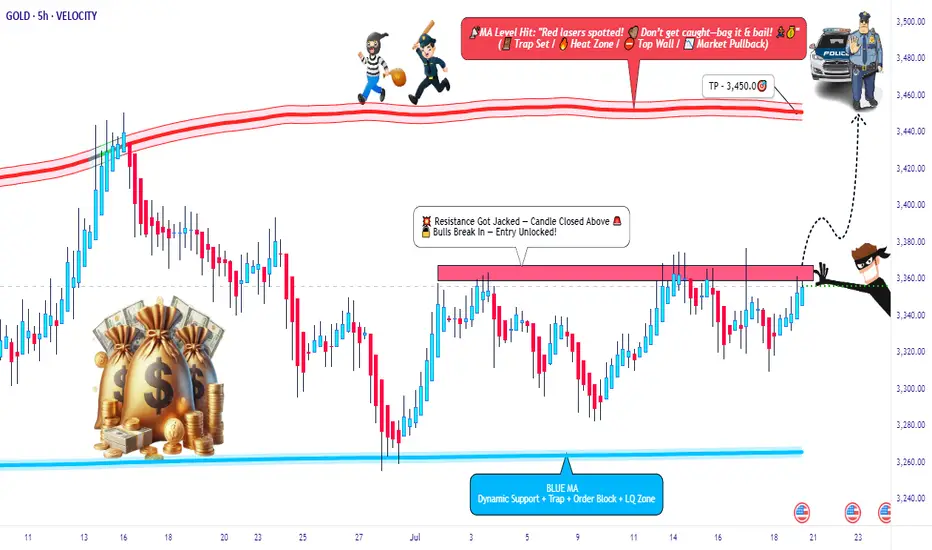
XAU/USD Breakout Playbook – Rob the Market!🚨💰 GOLD HEIST IN MOTION! | XAU/USD Thief Trading Strategy (Breakout Edition) 🏴☠️
🧠 Strategic Mindset | Not Your Average Chart Talk
Yo Market Bandits & Pip Hunters – welcome to the underground playbook!
This isn't your grandma’s chart breakdown – it’s a Thief Trading Takedown on XAU/USD (Gold), where we’re not chasing the market… we’re outsmarting it.
THE MASTER PLAN: Enter Like a Ghost, Exit Like a King 👑
📍 ENTRY POINT – The Break-In Begins!
💥 Breakout Level: Watch for 3370.00 resistance to crack – this is our green light.
🕵️♂️ Entry Style:
• Buy Stop above MA resistance zone (fast & clean)
• OR Buy Limit near swing low zones after confirmation pullback (sniper entry)
🧠 Thief Tip: Wait for the breakout to happen. No orders, no SL before it. Patience is profit.
🔄 Layer the Entry:
• Deploy DCA (Dollar Cost Averaging) or scaling entries with precision
• Build positions like stacking cash bags — smart, silent, and calculated
🛡️ PROTECT THE LOOT – Stop Loss Logic 💣
📍 SL Guide: 3310.00 (4H swing low – update as price structure evolves)
🔥 SL ONLY comes after breakout. Set it too early? That’s how you get caught.
⛔ No pre-breakout orders. No early SL. Stay invisible till it's go time.
🎯 THE ESCAPE – Profit Like a Phantom 🚀
💸 Take Profit: 3450.00
📉 Scalpers: Trail SL as price pushes – never give back stolen pips
🌀 Swing Traders: Monitor resistance layers – don’t let the bulls turn on you
🧭 CONTEXT – Why This Setup?
🔍 Macro Snapshot:
• Trend: Neutral/Bullish Lean
• Influencers: COT reports, geopolitical tension, dollar flows
• Sentiment Shifting – watch the herd, but don’t run with it
🗞️ News Risk: Don’t get wrecked by events! Avoid entries during high-impact news.
🚨 Trailing SL is your best weapon during volatility.
⚡ POWER UP THE CREW – Support the Movement
💬 Drop a comment, hit the 🔥 like button, and share with your trading gang
More Thief Trading blueprints coming soon – bigger breakouts, cleaner setups
⚠️ STAY SHARP, THIEVES!
This ain't financial advice – it’s an outlaw’s edge on the market.
Trade smart. Risk well. Protect the bag.
🏴☠️ XAU/USD GOLD HEIST IN PROGRESS... Join the Movement. Let’s Rob the Market.
Weekly Analysis on GOLDFor next week trading sessions i will be more patience in waiting for my set up to appear before taking trades.
GOLD - at Cut n Reverse Region, whats next ??#GOLD - market just reached at his ultimate area and keep in mind that if market break his current region than it will go further and nose dive..
NOTE: cut n reverse below our mentioned region..
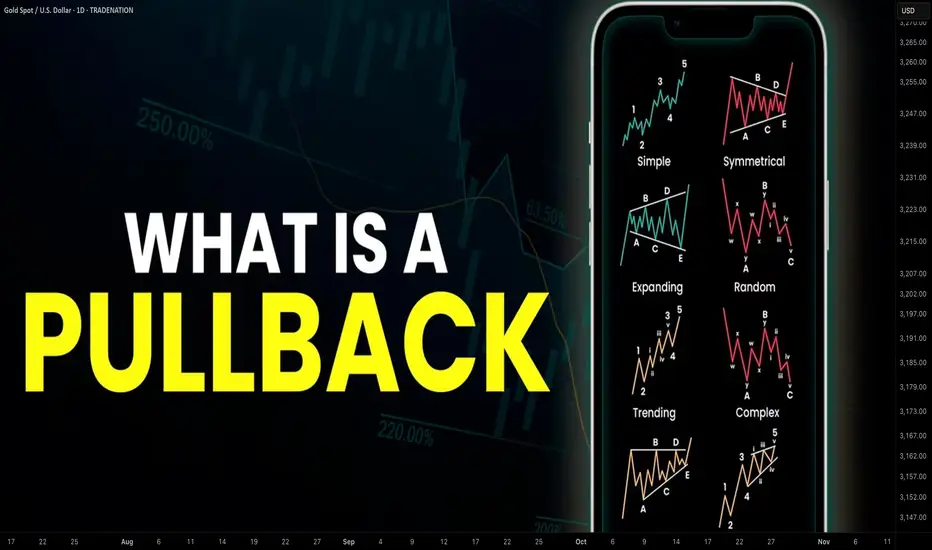
Learn What is PULLBACK and WHY It is Important For TRADING
In the today's post, we will discuss the essential element of price action trading - a pullback.
There are two types of a price action leg of a move: impulse leg and pullback.
Impulse leg is a strong bullish/bearish movement that determines the market sentiment and trend.
A pullback is the movement WITHIN the impulse.
The impulse leg has the level of its high and the level of its low.
If the impulse leg is bearish , a pullback initiates from its low and should complete strictly BELOW its high.
If the impulse leg is bullish , a pullback movement starts from its high and should end ABOVE its low.
Simply put, a pullback is a correctional movement within the impulse.
It occurs when the market becomes overbought/oversold after a strong movement in a bullish/bearish trend.
Here is the example of pullback on EURJPY pair.
The market is trading in a strong bullish trend. After a completion of each bullish impulse, the market retraces and completes the correctional movements strictly within the ranges of the impulses.
Here are 3 main reasons why pullbacks are important:
1. Trend confirmation
If the price keeps forming pullbacks after bullish impulses, it confirms that the market is in a bullish bearish trend.
While, a formation of pullbacks after bearish legs confirms that the market is trading in a downtrend.
Here is the example how bearish impulses and pullbacks confirm a healthy bearish trend on WTI Crude Oil.
2. Entry points
Pullbacks provide safe entry points for perfect trend-following opportunities.
Traders can look for pullbacks to key support/resistances, trend lines, moving averages or Fibonacci levels, etc. for shorting/buying the market.
Take a look how a simple rising trend line could be applied for trend-following trading on EURNZD.
3. Risk management
By waiting for a pullback, traders can get better reward to risk ratio for their trades as they can set tighter stop loss and bigger take profit.
Take a look at these 2 trades on Bitcoin. On the left, a trader took a trade immediately after a breakout, while on the right, one opened a trade on a pullback.
Patience gave a pullback trader much better reward to risk ratio with the same target and take profit level as a breakout trader.
Pullback is a temporary correction that often occurs after a significant movement. Remember that pullbacks do not guarantee the trend continuation and can easily turn into reversal moves. However, a combination of pullback and other technical tools and techniques can provide great trading opportunities.
❤️Please, support my work with like, thank you!❤️
I am part of Trade Nation's Influencer program and receive a monthly fee for using their TradingView charts in my analysis.
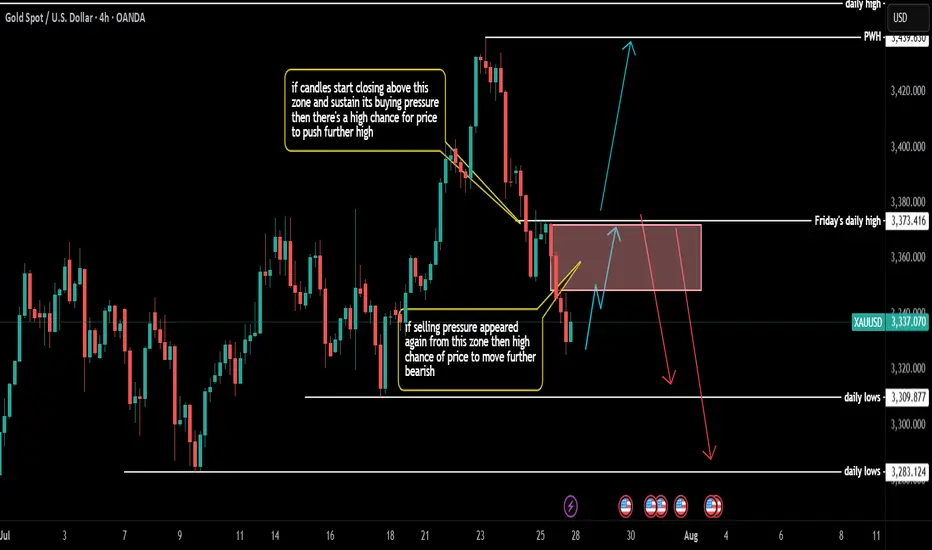
#XAUUSD H1 Setup – Smart Money Outlook📊 **#XAUUSD H1 Setup – Smart Money Outlook**
What we've been observing over the **last 3 sessions** is consistent **selling pressure** with **no meaningful pullback** yet — something that’s usually inevitable, even in strong downtrends.
🔁 A **retracement** is likely, and to identify key levels, we use the **Fibonacci Retracement Tool**.
---
### 🔍 **Market Sentiment Right Now**:
* Many traders are expecting a pullback into the **3348–3360 H1 Order Block**,
* Others are targeting **3368–3375** as a sell zone.
But here’s the twist:
⚠️ **Both these zones** could be potential **sell trap areas** (Fakeout Zone 1 & 2).
Why? Because **massive liquidity sits just above these levels**.
---
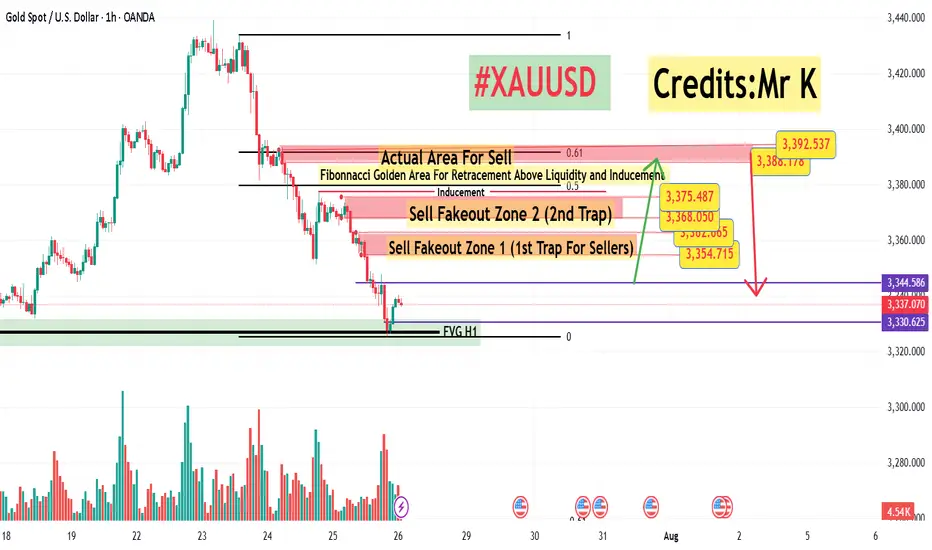
### 💡 **Smart Money Logic**:
Above the second fakeout zone lies an **inducement area** (liquidity pool).
And beyond that sits our **true institutional sell zone** at **3388–3393**, which aligns perfectly with the **Golden Fibo Zone (0.50–0.618)**.
📌 This is where we may see the **real bearish reaction**.
---
### 🟢 **Buy Setup Plan (Short-Term Opportunity)**:
If we get a **fully bullish H1 candle close above 3345**, we’ll look to **buy** with:
* **Entry:** Above **3345**
* **Stoploss:** Around **3332**
* **Target 1:** **3355**
* **Target 2:** **3368**
*(Potential final move into the trap zone)*
📢 **Important Note**: No buy will be considered without a strong **bullish H1 candle close** for confirmation. ✅
---
Let the market come to us — stay smart, not emotional. 🧠💰
\#SmartMoneyConcepts #XAUUSD #H1Analysis #LiquidityHunt #OrderBlock #GoldenFiboZone
Gold 30Min Engaged ( Bearish Entry Detected )————-
➕ Objective: Precision Volume Execution
Time Frame: 30-Minute Warfare
Entry Protocol: Only after volume-verified breakout
🩸 Bearish From now Price : 3423
➗ Hanzo Protocol: Volume-Tiered Entry Authority
➕ Zone Activated: Dynamic market pressure detected.
The level isn’t just price — it’s a memory of where they moved size.
Volume is rising beneath the surface — not noise, but preparation.
🔥 Tactical Note:
We wait for the energy signature — when volume betrays intention.
The trap gets set. The weak follow. We execute.

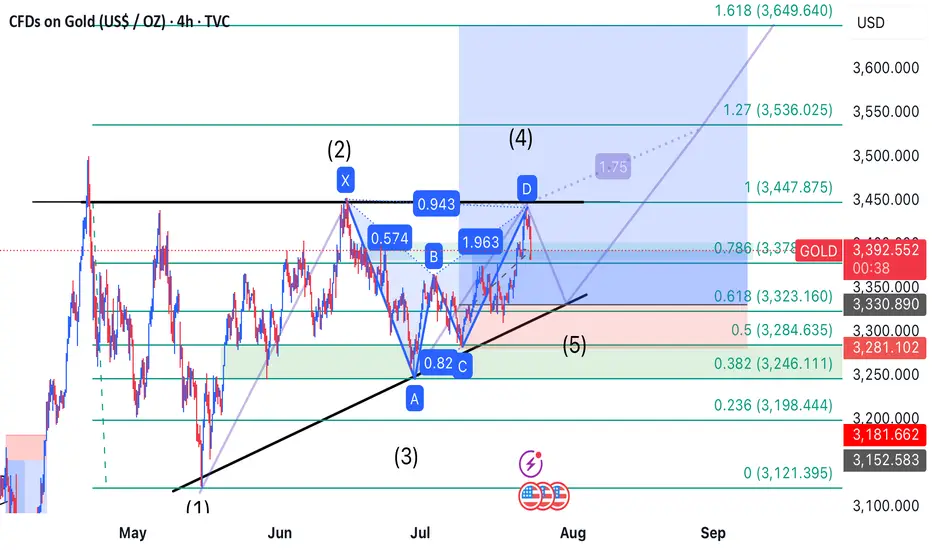
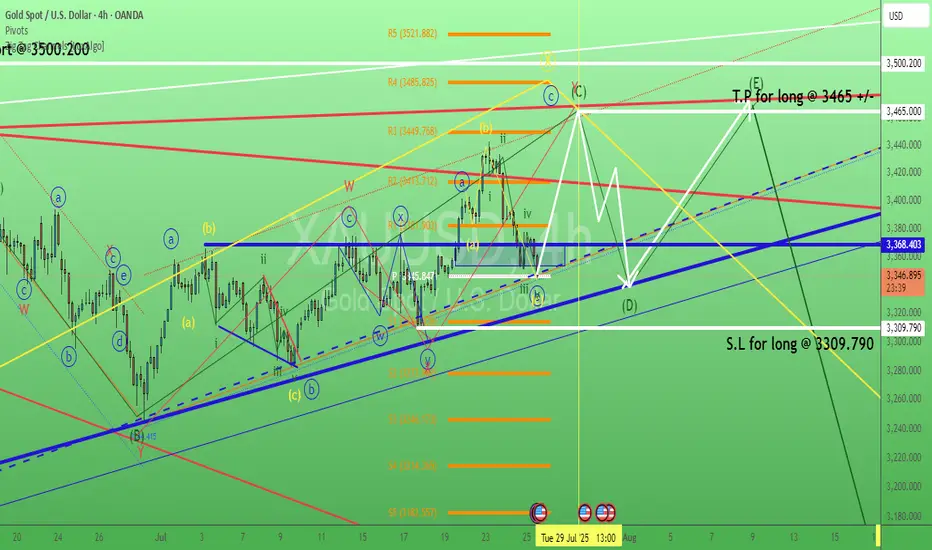
Hybrid Gartley-Elliott Wave Trade Setup on Gold Detailed Analysis & Prediction:**
This trade setup merges two powerful frameworks: a **bearish Gartley pattern** indicating a short-term pullback, and an **Elliott Wave interpretation** suggesting bullish continuation via wave five.
---
### 🧠 Thought Process:
1. **Gartley Pattern Completion:**
- The chart shows a completed bearish Gartley pattern with point D aligning around the **3,372 level**.
- As per harmonic rules, point D typically signals a reversal zone, suggesting a short-term drop.
2. **Projected Pullback:**
- A drop is expected toward the **3,323 support zone**, which coincides with previous swing lows and Fibonacci retracement confluence.
- This area likely marks the start of **wave five** in the Elliott Wave count — indicating that the bearish move is simply the final corrective wave before continuation.
3. **Wave 5 Bullish Opportunity:**
- Once price reaches the 3,323 zone and shows reversal confirmation, a strong bullish push is expected to begin.
- This aligns with historical wave structures and momentum indicators showing possible trend exhaustion.
---
### 🎯 Profit Targets:
| Target | Type | Price (USD) |
|--------|-----------------------|---------------|
| TP1 | Fibonacci 1.0 | 3,447.875 |
| TP2 | Fibonacci 1.27 | 3,536.025 |
| TP3 | Fibonacci 1.618 | 3,649.640 |
---
### 🛑 Stop Loss Strategy:
| Level | Type | Price (USD) |
|-----------|---------------------|---------------|
| SL1 | Conservative | 3,246.111 |
| SL2 | Aggressive | 3,198.444 |
---
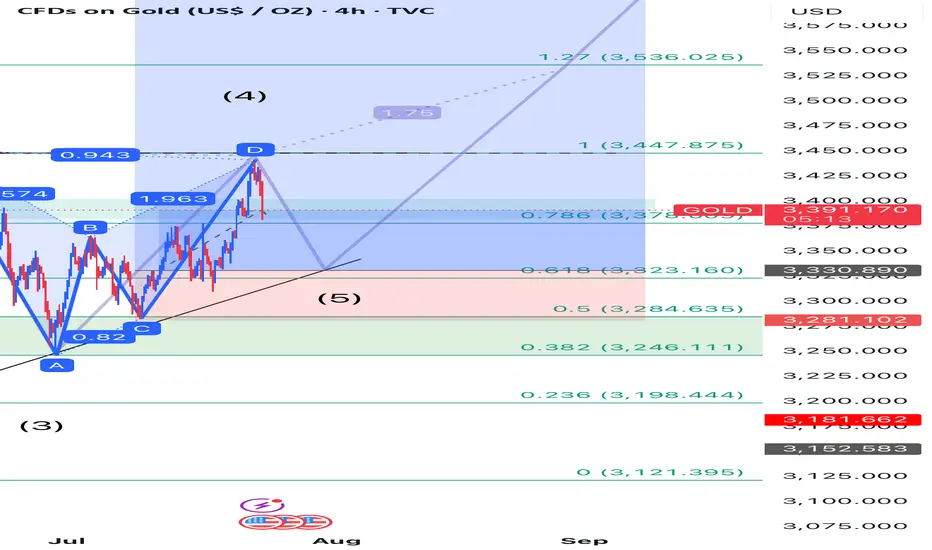
Hybrid Gartley-Elliott Wave Trade Setup on Gold – Bearish Dip In📊 Detailed Analysis & Prediction:**
This trade setup merges two powerful frameworks: a **bearish Gartley pattern** indicating a short-term pullback, and an **Elliott Wave interpretation** suggesting bullish continuation via wave five.
### 🧠 Thought Process:
1. **Gartley Pattern Completion:**
- The chart shows a completed bearish Gartley pattern with point D aligning around the **3,372 level**.
- As per harmonic rules, point D typically signals a reversal zone, suggesting a short-term drop.
2. **Projected Pullback:**
- A drop is expected toward the **3,323 support zone**, which coincides with previous swing lows and Fibonacci retracement confluence.
- This area likely marks the start of **wave five** in the Elliott Wave count — indicating that the bearish move is simply the final corrective wave before continuation.
3. **Wave 5 Bullish Opportunity:**
- Once price reaches the 3,323 zone and shows reversal confirmation, a strong bullish push is expected to begin.
- This aligns with historical wave structures and momentum indicators showing possible trend exhaustion.
Profit Targets:
| Target | Type | Price (USD) |
|--------|-----------------------|---------------|
| TP1 | Fibonacci 1.0 | 3,447.875 |
| TP2 | Fibonacci 1.27 | 3,536.025 |
| TP3 | Fibonacci 1.618 | 3,649.640 |
---
### 🛑 Stop Loss Strategy:
| Level | Type | Price (USD) |
|-----------|---------------------|---------------|
| SL1 | Conservative | 3,246.111 |
| SL2 | Aggressive | 3,198.444 |
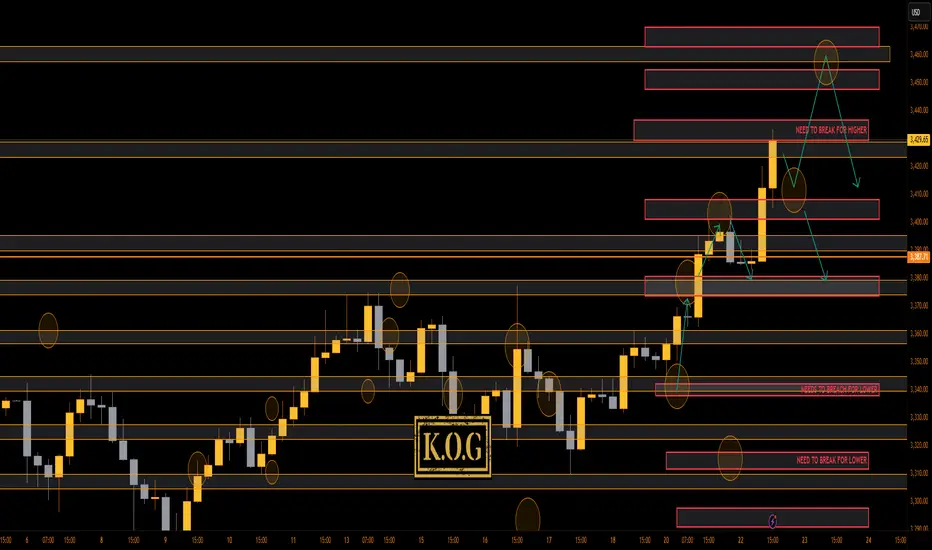
THE KOG REPORT - UpdateA rare day for us today even though we got the level for the short from above, we activated again, and due to everything lining up confirming the short into the lower order region where we wanted to bounce, we took it. Gold, had other plans, engulfing upside resulting in us having to SL the trade. It then went on to break above and complete our daily targets.
You win some, you lose some!
Now, we have support below at the 3410 region which will need to break to change short-term structure, while there is the order region above 3430-35 which could hold price and accumulate. All our bullish targets for the day are completed, we just wanted lower to then go higher.
If lower support can be targeted and held, we could see a move higher into the 3345-50 region before then a reaction in price. I'm still not happy with this move, something doesn't quite look right, so let's play it day by day.
RED BOXES:
Break above 3395 for 3404✅, 3410✅ and 3420✅ in extension of the move
Break below 3375 for 3368 and 3355 in extension of the move
As always, trade safe.
KOG
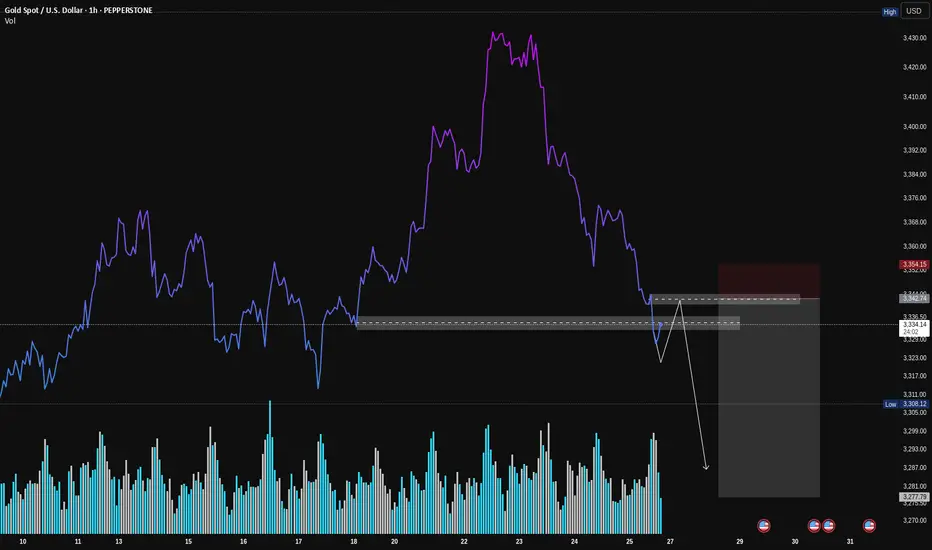
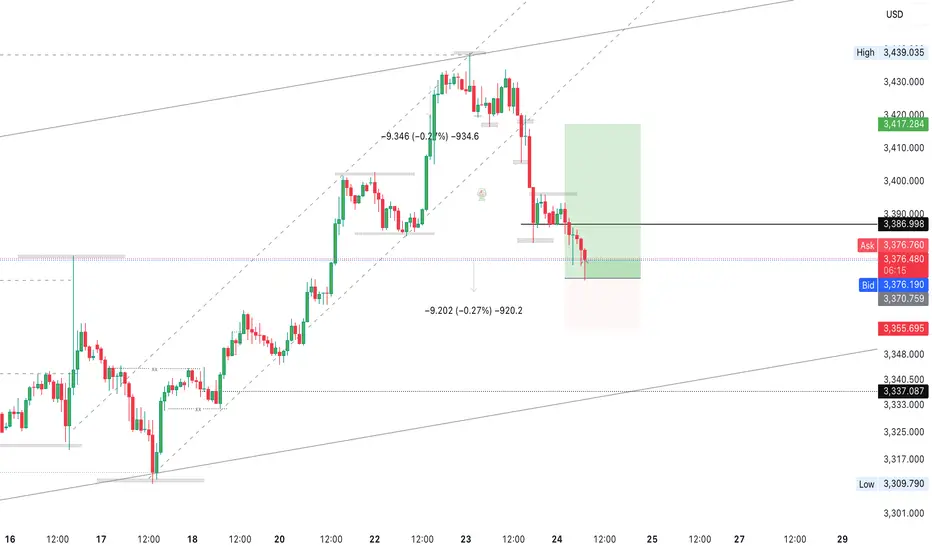
Gold (XAU/USD): A Classic VSA Short Setup in PlayHey Traders,
Following up on the general weakness we discussed in Gold, here's a closer look at a specific trade setup that's unfolding right now. This is a textbook example of a high-probability short setup according to Volume Spread Analysis (VSA).
Let's break down the story the volume is telling us.
1. The Breakdown: Sellers Show Their Hand
First, look at how the price broke down hard through that support level (the grey box). Notice the volume on that sharp drop? It was high. This is our clue that sellers are strong and in control. They had enough power to smash right through a level that was previously holding the price up.
2. The Retest: Buyers Don't Show Up
Now, the price is creeping back up to that same exact level. But here's the most important clue: look at the volume on this rally. It's much lower than the volume on the breakdown.
This is what VSA calls a "No Demand" rally. It’s like the market is trying to push a car uphill without any gas. It tells us that strong buyers (the "smart money") have no interest in buying at these prices.
3. The Setup: Selling into Weakness
This combination creates a classic short setup:
Logic: We are looking to sell at a level where old support has flipped into new resistance.
Confirmation: The low volume on the retest confirms the rally is weak and likely to fail.
How to Potentially Trade It
The grey box represents a high-probability entry zone. To time an entry, you could watch for a clear rejection signal right inside this zone. For example:
A "rejection candle" (like a pin bar) that pushes into the zone but gets slammed back down.
An up-bar with a tiny body and very low volume, showing buyers are completely exhausted.
Seeing one of these signs would be the final confirmation that sellers are about to take back control.
Conclusion:
This is a powerful setup because all the pieces line up: the background is weak, sellers have shown their strength, and buyers are now showing no interest at a key resistance level.
Disclaimer: This is my personal analysis using VSA and is for educational purposes only. It is not financial advice. Always do your own research and manage your risk. Good luck, traders!
Gold. Trade Swing buy setup 25/July/25XAUUSD "erased" all its early weekly gain by having deep pullback until its weekly pivot and channel support confluence zone again..
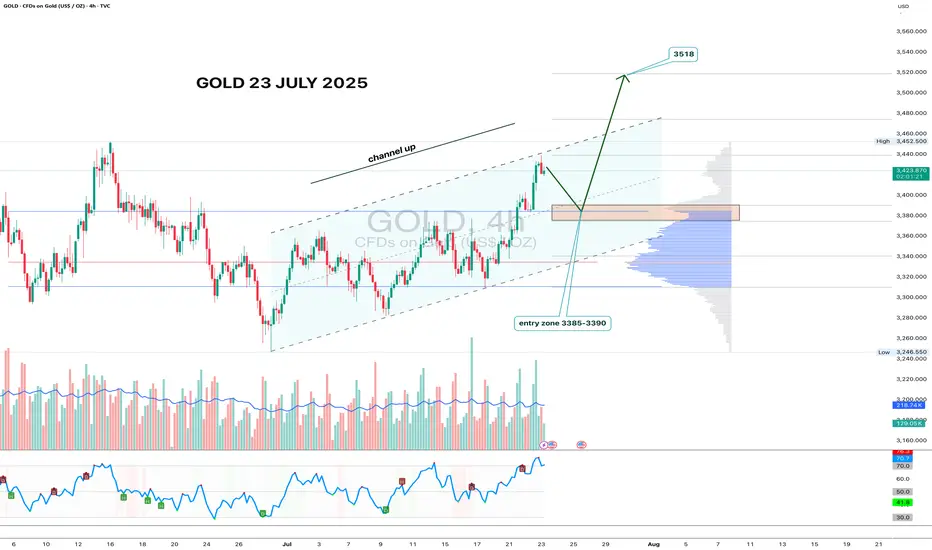
Gold 4H - channel breakout, looking for 3518 nextGold has formed a clean ascending channel on the 4H chart, broke out above resistance, and is now pulling back into the 3385–3390 zone. This area aligns with volume clusters - a perfect entry zone for bulls waiting on the sidelines.
If price holds this zone and prints a reversal candle with volume, the upside target remains at 3518 - the 1.618 Fibonacci extension and historical resistance. Volume increased during the breakout move, confirming interest. RSI still has room to go higher, supporting the bullish continuation.
Fundamentally, gold remains a safe-haven asset amid geopolitical tension, USD weakness, and potential Fed easing. Central bank accumulation further supports the bullish case.
Tactical setup:
— Entry zone: 3385–3390
— Trigger: candle confirmation + volume
— Target: 3518
— Invalidation: break below 3360 without buyer volume
If the plan plays out — gold might shine bright while bears squint in disbelief.
Welcome Back! Gold Trading Strategy & Key Zones to WatchIn this week’s welcome back video, I’m breaking down my updated approach to XAU/USD and how I plan to tackle the Gold markets in the coming days. After taking a short break, I’m back with fresh eyes and refined focus.
We’ll review current market structure, identify key liquidity zones, and outline the scenarios I’m watching for potential entries. Whether you’re day trading or swing trading gold, this breakdown will help you frame your week with clarity and confidence.
📌 Covered in this video:
My refreshed trading mindset after a break
Key support/resistance and liquidity zones
Market structure insights and setup conditions
What I’ll personally avoid this week
The “trap zones” that might catch retail traders off guard
🧠 Let’s focus on process over profits — welcome back, and let’s get to work.

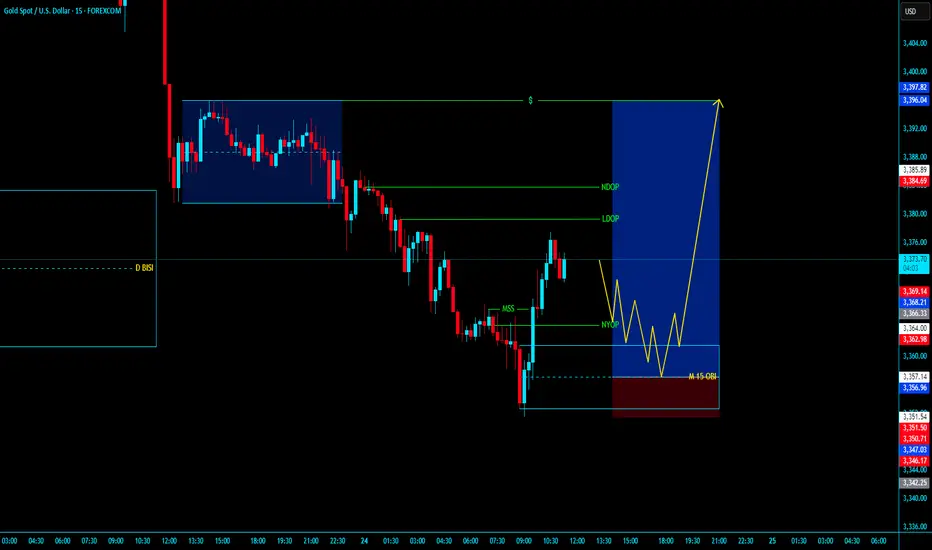
XAUUSD BUY LONG XAUUSD BUY LONG FROM BULLESH OBI
- In Daily TF Market will bullesh
- In H1 TF market is stell fully bullesh
- Market is in Daliy , H4 , H1 , M15 BISI
- In H1 & M15 MSS then our entry in OBI in LTF Valid MSS then our Entry target H1 Nearest Liquidity with Tight SL
tradE anD enjoY ......................................................
~~ KGB Priyabrat Behera ~~
~ ICT Trader & Advance Mapping SMC Trader ~
Gold Market Shorts to 3370's, Eyes Pullback to 3400'sGold market initiates a short move down to 3370's, reacting to short-term resistance.
A pullback stance is now forming, targeting a potential retracement back through to the 3400's, follow for more insights , comment and boost idea
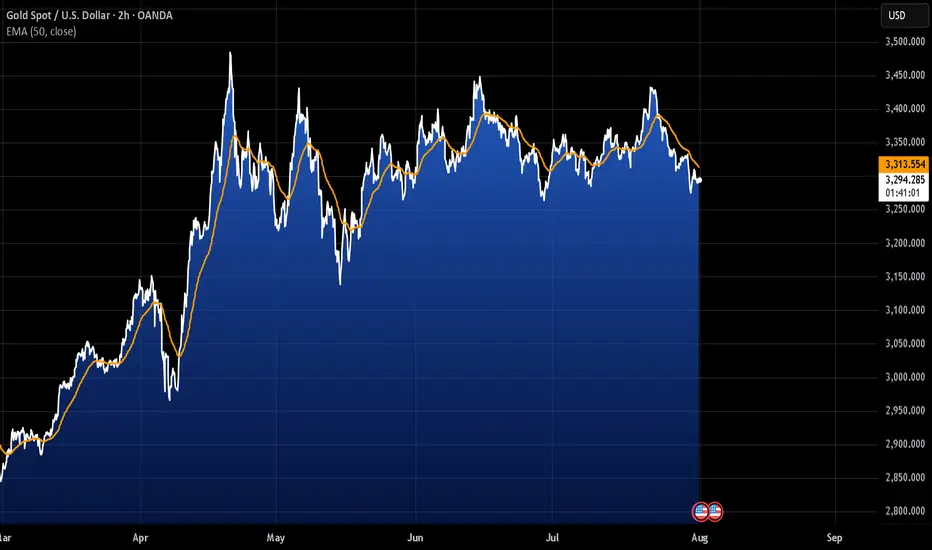
GOLD Weekly Idea💡Why Gold Pulled Back
- Gold pulled back today after hitting $3439.04, just below resistance at $3451.53. Traders took profits ahead of key Fed and trade headlines. Right now, it’s trading around $3414.48, down 0.50%.
- The dip came after the U.S.-Japan trade deal eased geopolitical tension, cutting safe-haven demand. Plus, U.S. bond yields are climbing (10-year at 4.384%), which adds pressure on gold.
Support is building at $3374.42, with stronger buying interest expected around $3347.97 and the 50-day moving average at $3336.40 — a key level bulls want to defend.
Short-term looks a bit weak, but as long as gold holds above the 50-day MA, the bullish trend remains intact. Longer-term, weakness in the dollar, central bank gold buying, and concerns about Fed independence could push prices higher.
🔍Watching the Fed’s July 29–30 meeting next