GOLDCFD trade ideas

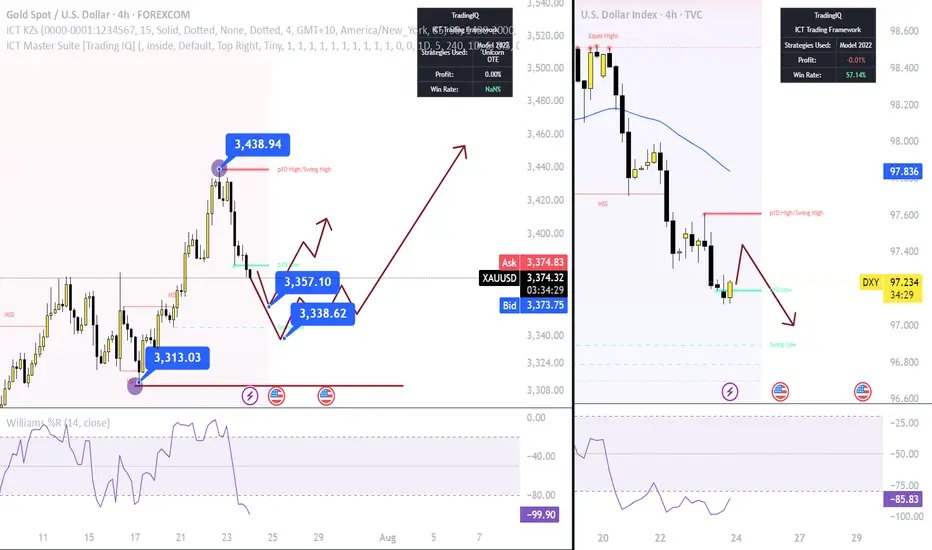
XAUUSD Weekly July 2025 28 July - 1 Aug🧭 MARKET STRUCTURE OVERVIEW – H4
1. Major Trend: Bullish
The overall trend remains bullish, with multiple Bullish Breaks of Structure (BOS) recorded during the upward move since early July.
A strong CHoCH followed by a solid Bullish BOS on H4 after the early July breakout confirms strong buyer intent.
---
2. Bearish BOS?
You're absolutely right — there are no significant Bearish BOS on H4 after the recent rally.
The current downward movement appears to be a retracement, not a structural break. No confirmation of bearish market structure yet.
---
🔵 CURRENT ZONE: H4 OB BUY (Active POI)
Price is currently rejecting from the H4 OB BUY zone, which aligns with the ascending trendline confluence.
If the H4 candle closes with a strong rejection (e.g. bullish engulfing or pinbar), this would confirm a potential buy entry for the next bullish leg.
This OB BUY is the main POI for next week and represents a:
✅ Buy from Discount
✅ Entry in Uptrend Structure
✅ Confluence of OB + POI + Momentum
---
🟥 FVG & TP Structure
1. TP1 / Scaling Zone:
H4 Fair Value Gap (FVG) around 3368–3380 can serve as the first target.
2. Final TP / ATH Zone:
Upper FVG (3420+) near a previous POI could act as the final target or a potential ATH test zone if buyers push higher.
---
🚀 TRADING PLAN – NEXT WEEK (Still Valid)
✅ Structure is still bullish
✅ Current drop is a retracement to OB BUY
✅ No valid Bearish BOS detected
✅ Current POI + OB BUY zone = prime entry level
---
📌 ENTRY STRATEGY
Entry: Buy within the OB BUY H4 zone (around 3320–3340)
Confirmation: Wait for a strong H4 rejection candle
Stop Loss: Below OB H4 (~3310, or adjust to lower OB zone)
TP1: 3368–3380 (FVG zone)
TP2: 3420+ (Upper FVG / POI / ATH zone)
---
⚠️ Additional Notes
If price breaks below OB BUY H4 with a strong bearish candle, this setup becomes invalid.
Then, we shift focus to lower OB zones (3280 / 3250).
Be cautious of high-impact news (FOMC/NFP?) – price may spike before confirming direction.
---
🔥 FINAL VERDICT:
✅ Plan is highly valid
❌ No strong bearish structure in place
🔒 Current POI is a key sniper entry zone

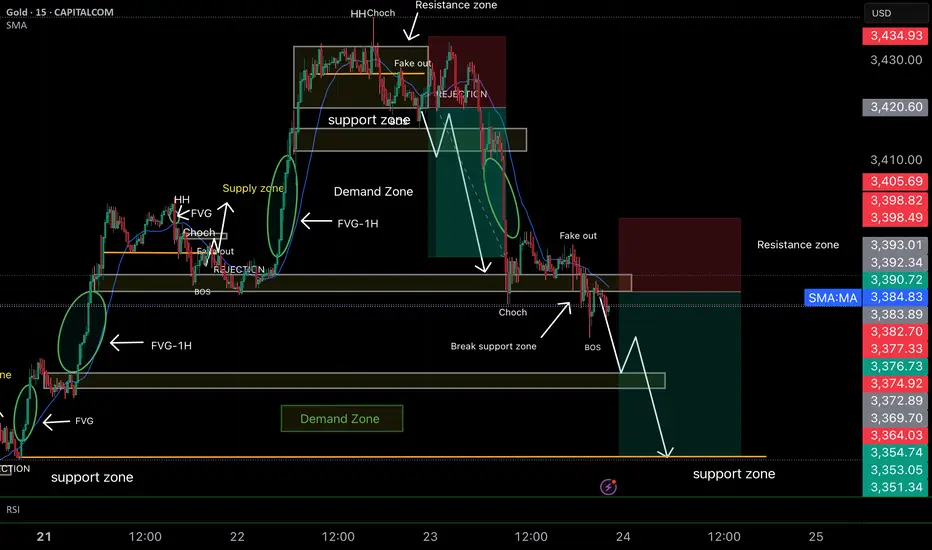
SMC Strengths of the Analysis
• ✔️ Clear bearish structure (ChoCH + BOS + fake out)
• ✔️ Mitigation target (1H FVG not yet closed)
• ✔️ SL well protected outside the manipulation zone
• ✔️ Logical entry right where the imbalance begins
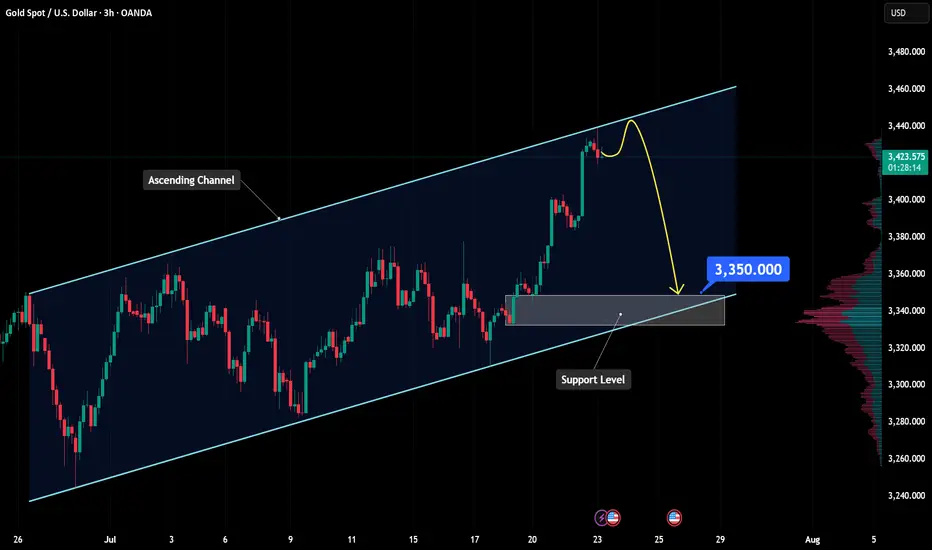
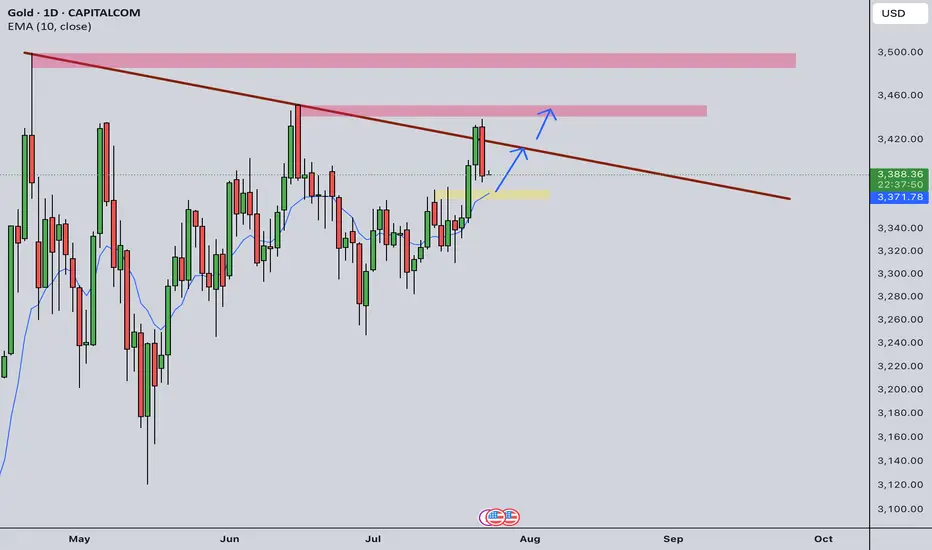
Gold technical outlook – Signs of exhaustion at channel topOANDA:XAUUSD is climbing within a well-defined ascending channel, and price is now brushing up against the upper boundary, a dynamic resistance zone that has historically triggered pullbacks. If price gets rejected here, we may see a healthy correction toward the key support at 3,350, offering a potential reload point for bulls.
Should buyers step in and defend this level, the bullish structure remains intact, setting the stage for a renewed push higher. On the other hand, a clean break below 3,350 could open the door for a deeper retracement toward the lower edge of the channel, where more significant demand may lie.
All eyes should be on price action and volume in this regio, watch for reversal patterns like bullish pin bars or engulfing candles to confirm entries. As always, risk management comes first. Don't trade assumptions, trade confirmations.
What’s your take on this setup? Drop your thoughts below and let’s discuss!
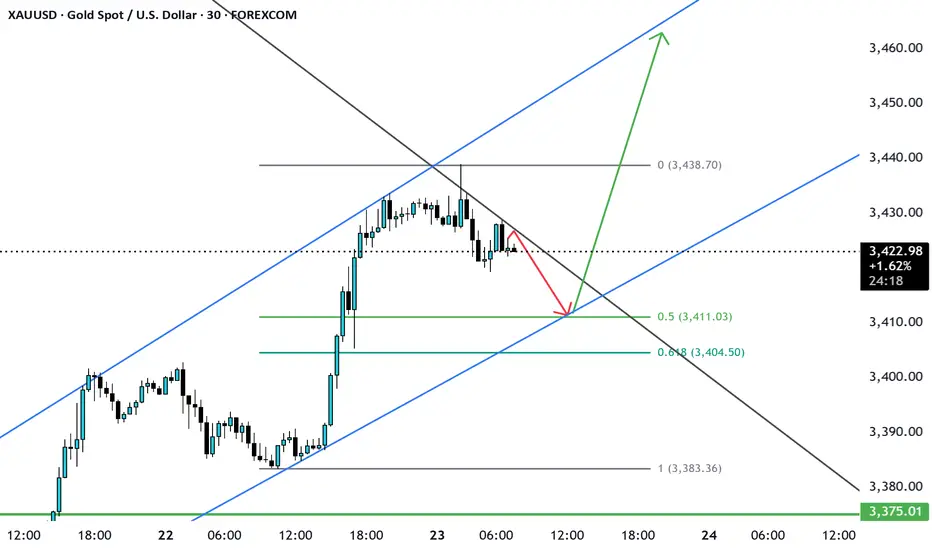
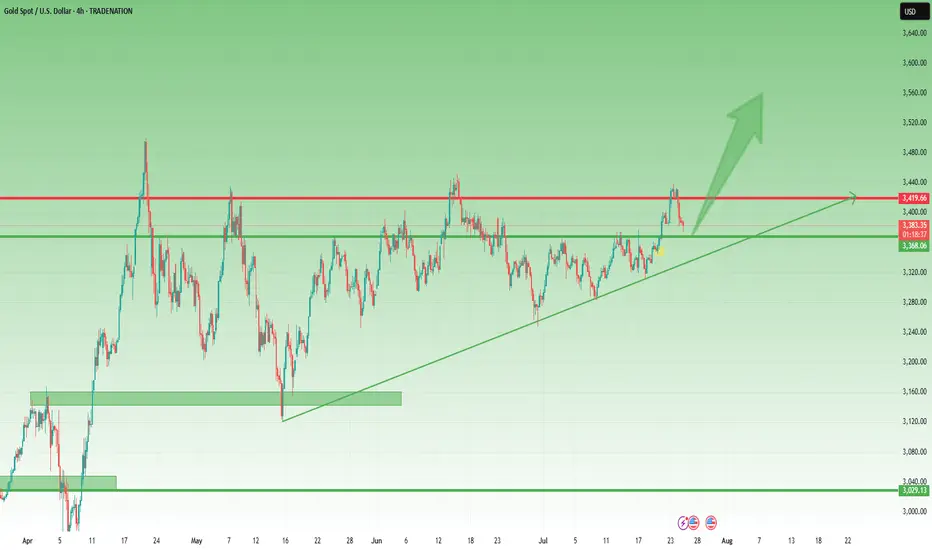
XAUUSD correction in progress Next target 3460-3470XAUUSD was trading in a up trend and currently consolidating, At the fib 0.5 and support channel support trendline both overlap at 3410-3415 area from where the price may resume again up the target can be 3460. let us see.
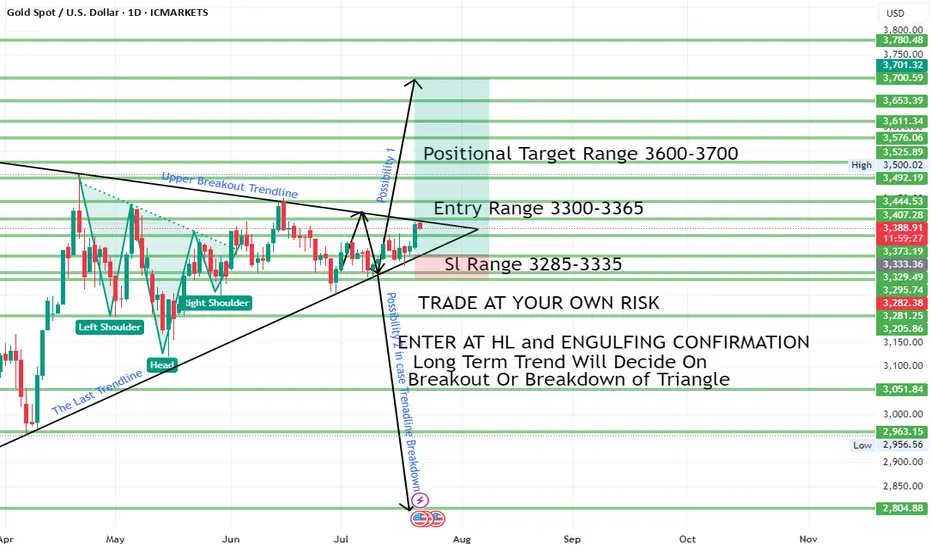
XAUUSD Path Going As per Previous Ideas Analysis Discussed.XAUUSD Path Going As per Previous Ideas Analysis Discussed in the images above for further information or Previous Analysis refer previous Ideas.
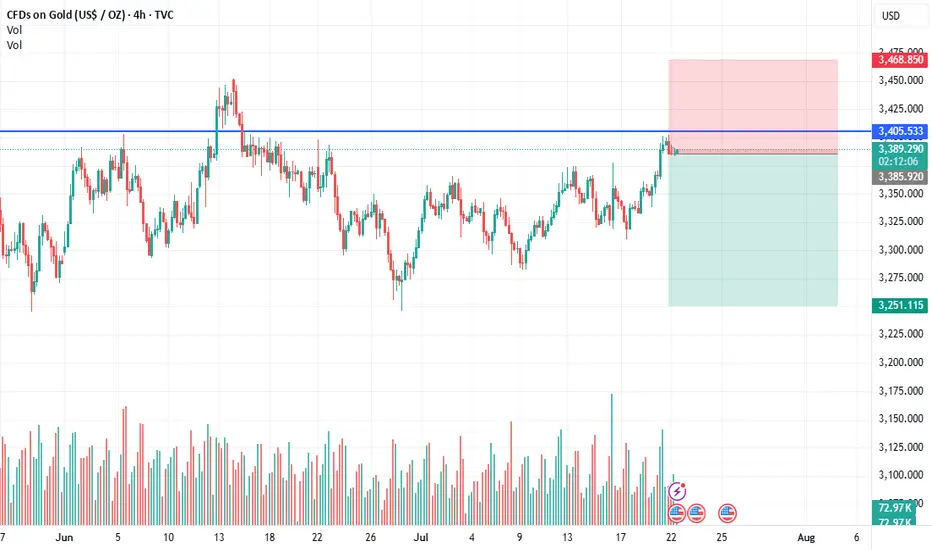
GOLD BEARS ARE STRONG HERE|SHORT
GOLD SIGNAL
Trade Direction: short
Entry Level: 3,383.09
Target Level: 3,336.50
Stop Loss: 3,413.51
RISK PROFILE
Risk level: medium
Suggested risk: 1%
Timeframe: 12h
Disclosure: I am part of Trade Nation's Influencer program and receive a monthly fee for using their TradingView charts in my analysis.
✅LIKE AND COMMENT MY IDEAS✅

Gold Intraday Trading Plan 7/24/2025Yesterday in lower TF, gold was testing the resistance line for a couple of times but failed to maintain it. It quickly dropped back into the line and closed the day under 3400. Daily, it still looks bullish but in lower TF, it is still bearish.
Therefore, I will be cautious in placing buying orders today. As long as 3373 still holds, I am still bullish in gold. I will look for set up around this level and my 1st target will be around 3415. Final target for today is 3450.
Correction in Play, Long-Term BUY Opportunity Ahead XAUUSD 24/07 – Correction in Play, Long-Term BUY Opportunity Ahead
🧭 Market Outlook
Gold has dropped sharply from the 343x region, exactly as outlined in yesterday’s plan. Price has broken below the ascending trendline on the H1 chart and is now tapping into lower liquidity zones (FVG + OBS), signaling continuation of the short-term bearish move.
Key context to watch:
Traders are awaiting final decisions on US global trade policy agreements.
Next week’s FOMC meeting may confirm expectations of an interest rate cut.
Later today, markets will react to US PMI data and Jobless Claims, which could trigger volatility.
📊 Technical View
While the higher timeframe trend (D1/H4) remains bullish, the short-term structure has broken, and the market is now exploring unfilled liquidity pools below. Once these are swept, we anticipate a strong long-term BUY opportunity.
🎯 Trading Plan for Today
📌 Short-Term Strategy:
Look for short-term SELL setups on retracements toward resistance zones. Wait for clear rejection signals before entering.
📌 Mid/Long-Term Strategy:
Prepare to BUY from major Key Levels once price taps into deep liquidity zones. Ensure confluence and good risk/reward before entering.
🔎 Key Levels to Watch
🔺 Upper Resistance Zones:
3393 – 3404 – 3414 – 3420 – 3428
🔻 Lower Support Zones:
3375 – 3366 – 3352 – 3345 – 3330
🔽 Trade Setups
✅ BUY ZONE: 3352 – 3350
SL: 3345
TP: 3356 → 3360 → 3364 → 3370 → 3375 → 3380 → 3390 → 3400
🔻 SELL ZONE: 3414 – 3416
SL: 3420
TP: 3410 → 3406 → 3400 → 3395 → 3390 → 3380
⚠️ Risk Reminder
No major economic news is scheduled for today, but unexpected political statements or geopolitical tensions could cause price spikes.
✔️ Always follow your SL/TP strictly.
✔️ Avoid entering without solid confirmation.
✔️ Watch how price reacts to the levels above.
📣 Follow MMF on TradingView
If this trading roadmap helps your strategy,
📌 Follow the MMF team on TradingView for daily actionable setups, real levels, and no-nonsense analysis based on real market conditions.
🎯 Real trades. Real zones. Real discipline.

Will gold continue to fall on July 25?
1. Brief analysis of gold fundamentals
The current gold price is fluctuating downward, and the core driving factors are:
Risk aversion has cooled down:
The United States and Japan reached an agreement on automobile tariffs and promoted an agreement with the European Union, easing previous global trade tensions;
The overall risk appetite of the market has increased, and safe-haven funds have withdrawn from gold.
The US dollar rebounded in stages:
The US dollar index rebounded after the previous decline, which partially offset the safe-haven appeal of gold;
Although there are expectations of interest rate cuts within the Federal Reserve, there are large differences, and the overall trend is still "wait-and-see", which has increased the volatility of the US dollar trend.
2. Technical analysis of gold
Trend characteristics:
Gold has fallen from the high of 3438 and has been under pressure for two consecutive days;
It is currently testing the 0.618 retracement support (about 3360) of the 3310-3438 increase;
The European session continued to fall. If there is a rebound before the US session, there may be a risk of "false breakthrough and real decline";
If the US session still does not rise in the early session, it is necessary to pay attention to the possible V-shaped reversal in the future.
Technical indicators:
The short-term MACD bottom divergence gradually emerges, and the probability of oversold rebound correction increases;
Important support: 3350-3340 range (once lost, it may test the lower track of the 3337 daily triangle);
Key pressure: 3393-3403 range (initial rebound resistance), stronger resistance is around 3416-3418.
III. Short-term operation strategy suggestions
✅ Main idea: shorting on rebound is the main, and long on callback is the auxiliary
Short order layout reference:
If the 3393-3403 area encounters resistance, you can try to short with a light position;
Stop loss is set above 3410, and the target is 3360-3350;
If the market breaks through 3403 strongly and stabilizes, the short order strategy needs to be suspended.
Long position layout reference:
If it drops to 3350-3340 and stabilizes, you can try short-term long with a light position;
Stop loss is set below 3335, and the target is 3375-3385;
If the market quickly breaks below 3337, wait for the lower support to stabilize before intervening.
IV. Trend warning points
If the price does not rebound significantly before the early US market, it is necessary to guard against a sudden V-shaped pull after the US market;
If it directly falls below 3340, the space below opens, it is recommended to stop loss in time and wait for new support points.
✅ Conclusion:
In the short term, gold is still in the downward correction stage, but as the technical oversold signs appear, short-term sharp pull rebound should be guarded against. It is recommended to respond flexibly in operation, pay attention to the response of key support and resistance levels, and avoid chasing up and selling down.

XAUUSD continuation of larger bullish move - 25/7/25Gold did touch the higher timeframe supply zone and pull back. It is now at a point where i am looking for a pivot to form to continue bullish.
I did place a buy limit trade at the extreme zone that started the break of structures.
i will wait a see if it drops and triggers or forms a pivot at the 4H zone that broke structure.

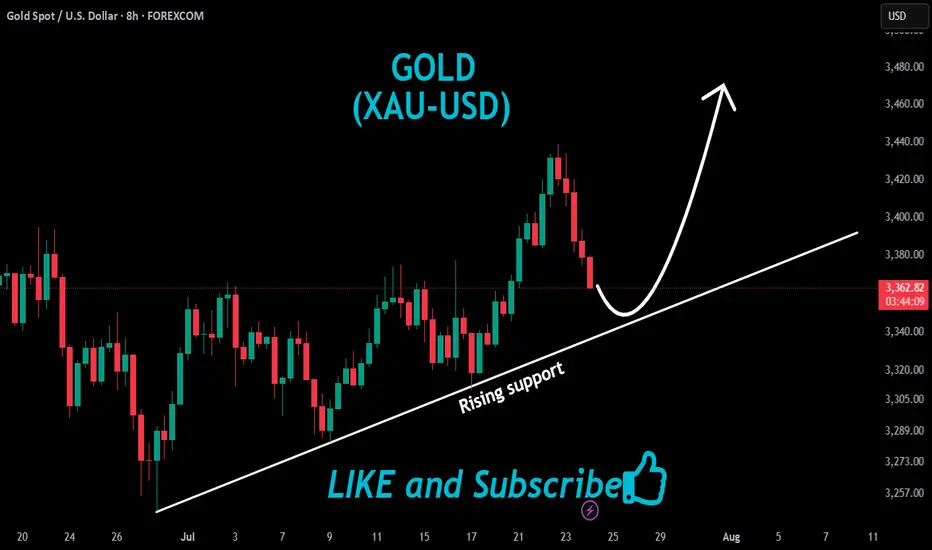
#GOLD Will Keep Growing!
HI,Traders !
#GOLD keep trading in An uptrend
along the rising support So as the gold
is approaching A the support we will be
Expecting a bullish rebound !
Comment and subscribe to help us grow !
Gold Correction Went Deeper, but the Bullish Structure Intact📌 Quick recap from yesterday:
In my previous analysis, I mentioned that I was looking to buy dips around 3400, expecting a continuation move toward the ATH near 3500.
That was the plan.
But as the day unfolded, I removed my pending buy order — and explained exactly why in an educational post on how context can override entry levels.
If you read that, you already understand:
It’s not where price goes. It’s how it gets there.
________________________________________
📉 So… where are we now?
The big question is:
Was this just a deeper correction, or is Gold preparing to shift direction entirely?
In my opinion, we’re still in a healthy correction, not a reversal.
Why?
• Price remains above the horizontal support — the same level that acted as resistance last week
• The market is still above the trendline from mid-May
• No breakdown, no major structure violation — just deeper retracement after a sharp impulsive move
________________________________________
📈 What’s the plan going forward?
As long as these two supports hold, I believe the buy-the-dip narrative remains valid — even at better prices.
In fact, I already entered a new long position about an hour ago, which is currently up around 90 pips at the time of writing.
My bias stays bullish unless proven otherwise.
________________________________________
📌 Conclusion:
Yes, the correction went deeper than expected.
Yes, I removed a pending order — because the reaction was not what I wanted to see.
But structure still supports continuation, and I remain in the buy-the-dip camp as long as key support holds. 🚀
Disclosure: I am part of TradeNation's Influencer program and receive a monthly fee for using their TradingView charts in my analyses and educational articles.
GOLD SELL POSITIONPrice have been correcting the last move down and now is showing a strong resistance at this level. expect price to move down in any news coming soon from US session.
Very Strong Short!Hello all. as you see market needs a new lower low. a little above we have an Strong level that in throw the market down. be happy and Trade it if your method confirm. (wink)

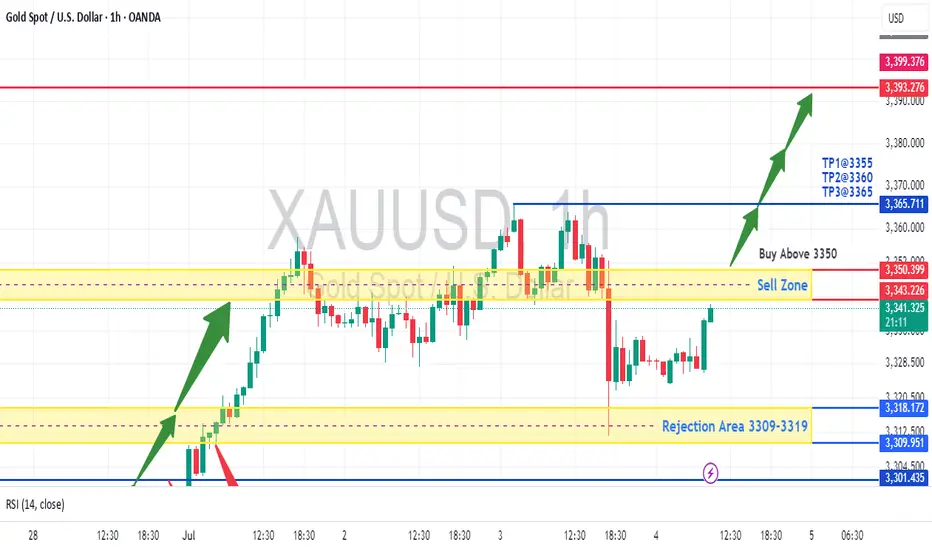
XAUUSD - Retesting 3400 before DeclineThe chart shows a potential buy setup for gold (XAUUSD) with the following key points:
Price Action: Gold is trading at 3,341.465, above the suggested "Buy Above 3350" level, indicating a bullish bias.
Support/Resistance: The rejection area at 3309-3319 held as support, and price has moved higher, confirming buyer interest.
Take Profit Levels: TP1 (3355), TP2 (3360), and TP3 (3365) provide clear upside targets.
RSI Confirmation: The RSI (14) at 54.21 shows moderate bullish momentum without being overbought.
Volume & Close: The slight increase in price (+0.09%) with supportive volume suggests accumulation.
Trade Idea: Enter long above 3350 with stops below 3309, targeting TP1-TP3. The rejection zone and RSI support further upside.
Disclaimer: This is not financial advice. Please consult with a financial advisor before making any investment decisions. We are not responsible for your loss because we are not SEBI registered and this analysis based on technical aspects and only for educational practice. Do your own research.
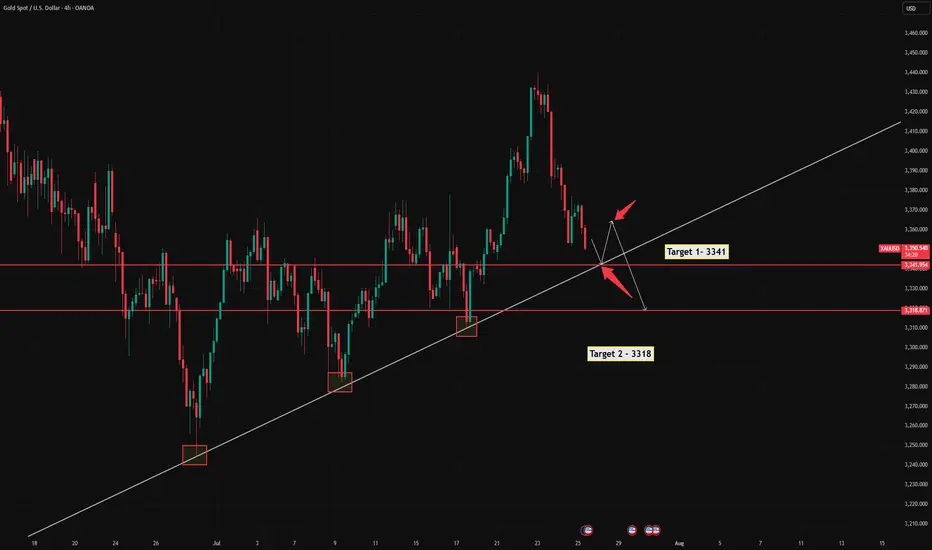
Gold XAUUSD Sell in trendline completion stageGold XAUUSD Sell in trendline completion stage - short term trade. now in 4th touch. bounce back to test previous level testing and return back to support again and it will break to test the sellers.
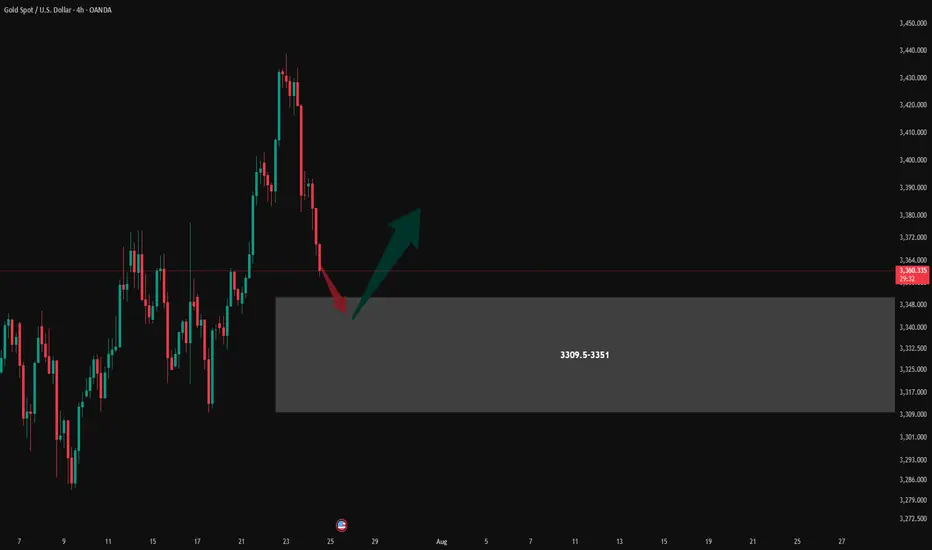
Gold Buy OfferIn 4H time frame there is a good Demand area in 3309.5-3351 price.
Ofcourse it is a thick one and S/L would be too far. So I prefer to enter the Buy position in the middle it .( some price around 3330 if drops )
Gold to Take Support Gold at key support level, There is two chances.. where it can grab the liquidity... we will wait and watch... Cheers

Chart Analysis Gold (XAU/USD)Chart Analysis Gold (XAU/USD)
**Bearish Outlook (Short-Term)**
* **Price is below EMA 7 and EMA 21**, showing short-term bearish momentum.
* Strong **resistance zone** around **\$3,430–\$3,440** was rejected sharply.
* Price has broken below **\$3,405–\$3,395** support and is now **consolidating above \$3,385–\$3,380**, a critical support area.
* Volume is rising on red candles, supporting **selling pressure**.
**Key Support Zone:**
\$3,380 – If broken, next downside targets:
→ **\$3,370**
→ **\$3,360**
*Bullish Scenario (If Support Holds)**
* If **\$3,380** holds and price reclaims above **\$3,395**, a **bounce toward \$3,405–\$3,410** is possible.
* Look for a **break above EMA21 (currently near \$3,402)** for bullish confirmation.

Gold at a Critical Reversal Zone – Waiting for Structural Break 📉 Gold Outlook – Corrective Dollar Strength & Potential Reversal Zones
🧭 Market Structure-Based Outlook with Multi-Timeframe Confluence
Gold is currently experiencing a controlled decline, primarily driven by a short-term corrective appreciation in the U.S. dollar.
This dollar strength is likely temporary and is expected to reverse toward the 3370–3354 zone — a technically significant area marked by previous liquidity sweeps and imbalance fills.
🔍 Technical Setup:
Bias (HTF): Bullish
Current Move (LTF): Corrective
Key Observation: No shift in long-term market structure on higher timeframes; price action remains within a bullish regime.
✅ Strategic Trade Plan:
We will not engage prematurely.
The optimal entry will only be considered upon a confirmed bullish market structure shift on the 15-minute timeframe — ideally a BOS (Break of Structure) followed by mitigation.
🛒 Entry Zone:
Around 3370 – 3354, contingent upon a clean bullish break in structure.
⛔ Invalidation Level (SL):
Below 3308 (structure invalidation + liquidity trap zone)
🎯 Profit Targets (Scaled):
TP1: 3400
TP2: 3430
TP3: 3500 – 3560
TP4 (Extended): 3600 – 3720
(Use partials & scale accordingly based on trade management plan)
🧠 Fundamental Confluence:
The macro picture remains supportive of higher gold prices.
Anticipated dovish shifts from the Federal Reserve, particularly in the form of rate cuts or forward guidance softening, may act as the macro catalyst for continuation toward new highs.
🛎 Conclusion:
While the current correction appears sharp, it lacks HTF structural reversal characteristics.
Patience and precision are essential — no entry should be considered without a 15m bullish break in structure.