Gold Exhibiting Weak Bearish Momentum – Is a Rebound Imminent?Gold Exhibiting Weak Bearish Momentum – Is a Rebound Imminent?
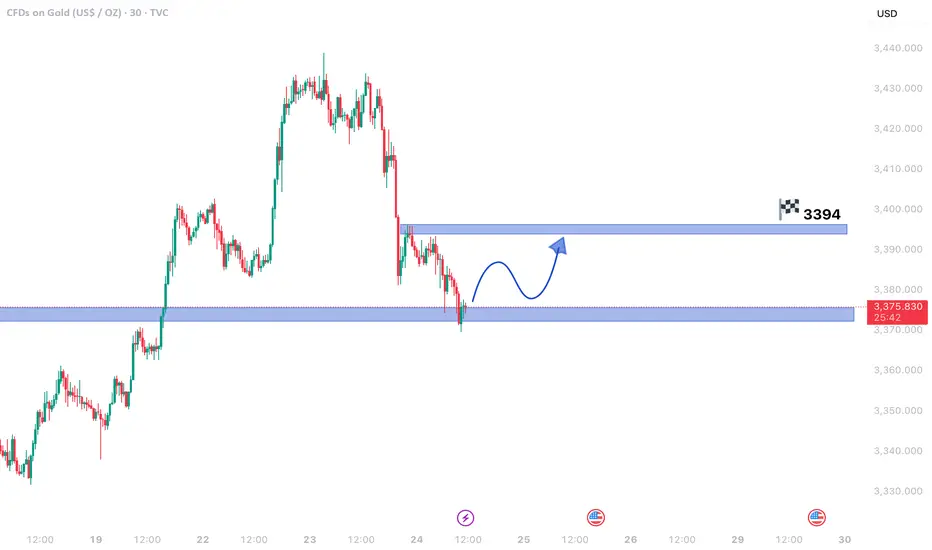
The 30-minute chart reveals gold prices in a mild downtrend, but the sluggish decline hints at weakening bearish pressure. This could set the stage for a temporary price recovery before any further downward movement.
Critical Insights:
- Fading Bearish Strength: The downtrend persists, but its slowing pace suggests seller exhaustion.
- Key Support Zone: With prices hovering near a major support area, a bullish reversal becomes plausible.
- Upside Potential: A resurgence in buying momentum may propel gold toward 3,394.60, a significant resistance level.
Market Dynamics:
1. Possible Short-Term Reversal: Shallow bearish trends near support often precede upward corrections.
2. Bullish Opportunity: A breakout past nearby resistance could fuel a rally toward 3,394.60, creating a swing trade setup.
3. Downside Risk: If support fails, the bearish trend may extend, though weak selling pressure limits immediate declines.
Strategic Approach:
- Entry Consideration: Long positions near current support levels could capitalize on a rebound.
- Risk Management: A drop below support would negate the bullish outlook, warranting a stop loss.
- Confirmation Signals: Bullish candlestick formations or increasing volume would strengthen reversal prospects.
Concluding Thoughts:
Gold’s tepid bearish momentum near a crucial support level raises the likelihood of a short-term bounce. Traders should watch for confirmation—if the recovery gains traction, 3,394.60 may come into play. Conversely, a support breakdown could renew downward pressure.
GOLDCFD trade ideas
XAU/USD) Bullish trend analysis Read The captionSMC Trading point update
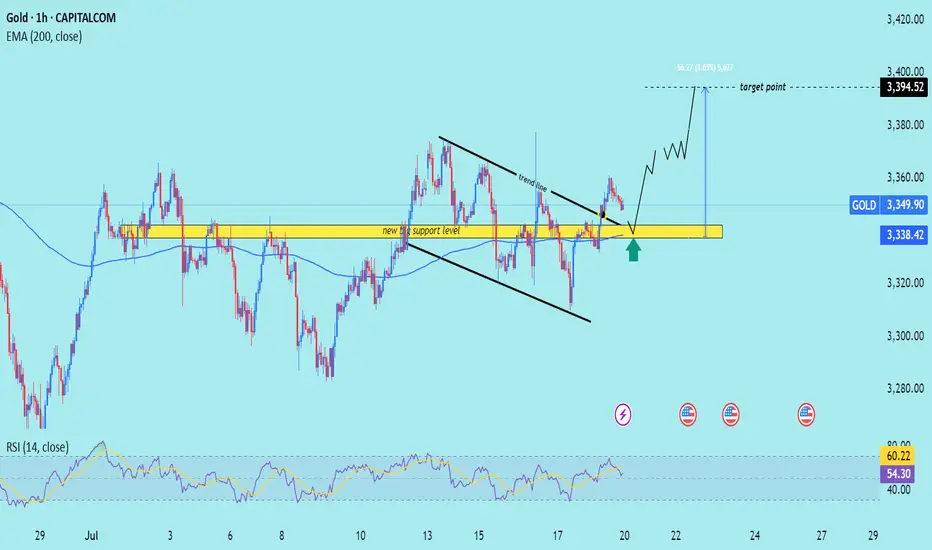
Technical analysis of XAU/USD (Gold) on the 1-hour timeframe. Here’s a breakdown
---
Technical Analysis Summary
Descending Channel Breakout
Price action previously formed a descending wedge/channel, shown by the two black trendlines.
A bullish breakout occurred above the trendline, signaling a shift in momentum from bearish to bullish.
Key Support Zone
The yellow highlighted zone (around $3,338–$3,340) is marked as the “new key support level”.
Price is expected to retest this area (confluence with 200 EMA), which aligns with standard bullish breakout behavior.
The green arrow indicates potential bounce confirmation.
Bullish Projection
After the retest, price is projected to climb steadily toward the target point at $3,394.52.
The setup anticipates around 56.27 points upside, or roughly +1.69% gain from the support zone.
---
Target
$3,394.52 – defined using the previous range breakout height and horizontal resistance.
---
Trade Idea
Entry: On bullish confirmation near $3,338 support zone.
Stop Loss: Just below the yellow zone (e.g., under $3,330).
Take Profit: Near $3,394.
Mr SMC Trading point
---
Conclusion
This is a classic breakout-retest-play, supported by trendline structure, a key horizontal support zone, and RSI strength. As long as price respects the highlighted support, the bullish outlook remains valid.
Please support boost 🚀 this analysis)
XAUUSD Analysis todayHello traders, this is a complete multiple timeframe analysis of this pair. We see could find significant trading opportunities as per analysis upon price action confirmation we may take this trade. Smash the like button if you find value in this analysis and drop a comment if you have any questions or let me know which pair to cover in my next analysis.

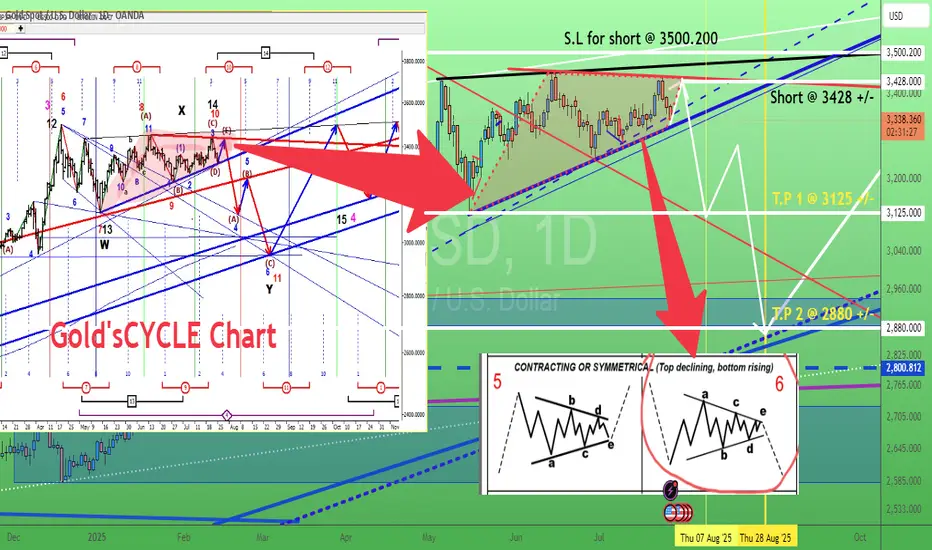
Gold. Could this be the final "shape" of triangle? 26/July/25XAUUSD. back to previous ideas that we possible having a contracting /symmetrical triangle pattern on gold chart..Probarly a "big surprise" on 31 July FED/FOMC meeting?
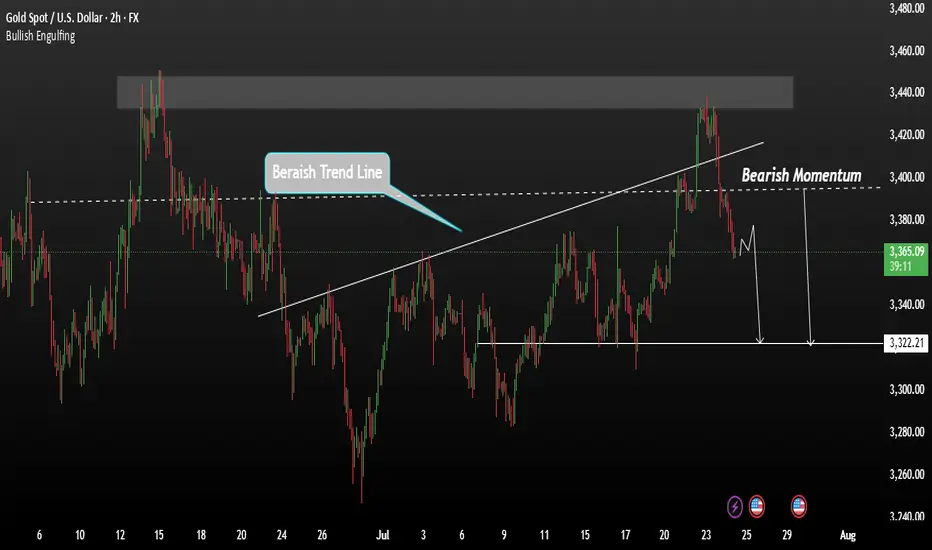
Gold remains in a bearish trendGold followed our previous analysis closely, rejecting from the strong resistance level at $3430, confirming bearish momentum. This rejection has opened the door for a potential move toward the 3400 level, and further downside is likely.
Gold remains in a bearish trend. A temporary pause or minor consolidation may occur, but the overall direction remains to the downside. This week, markets are watching the outcome of the ES–US agreement closely. If a resolution is reached, it could strengthen the USD and increase risk appetite—potentially pushing gold even lower.
We expect gold to remain under pressure unless major market sentiment shifts. A break below 3400 could accelerate the drop toward 3322.
You May find more details in the chart.
Ps Support with like and comments for better analysis Thanks.

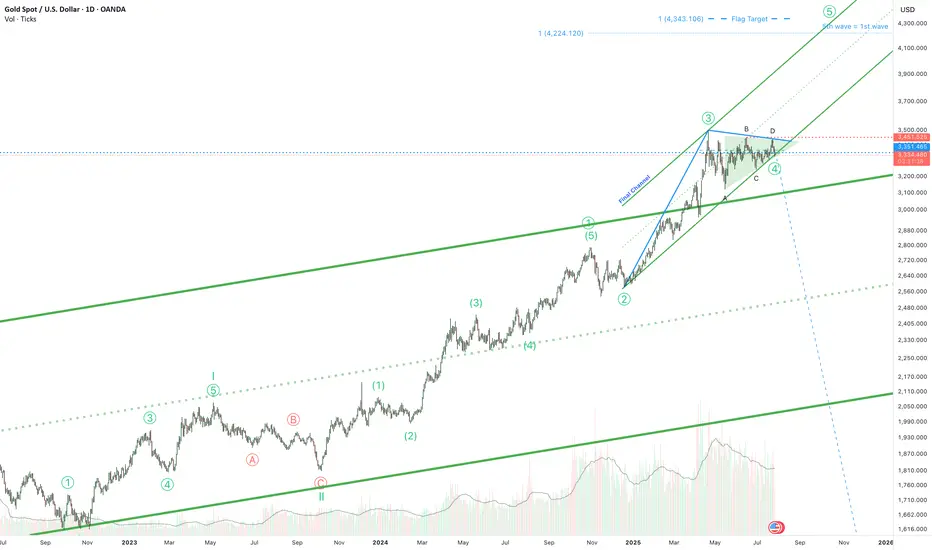
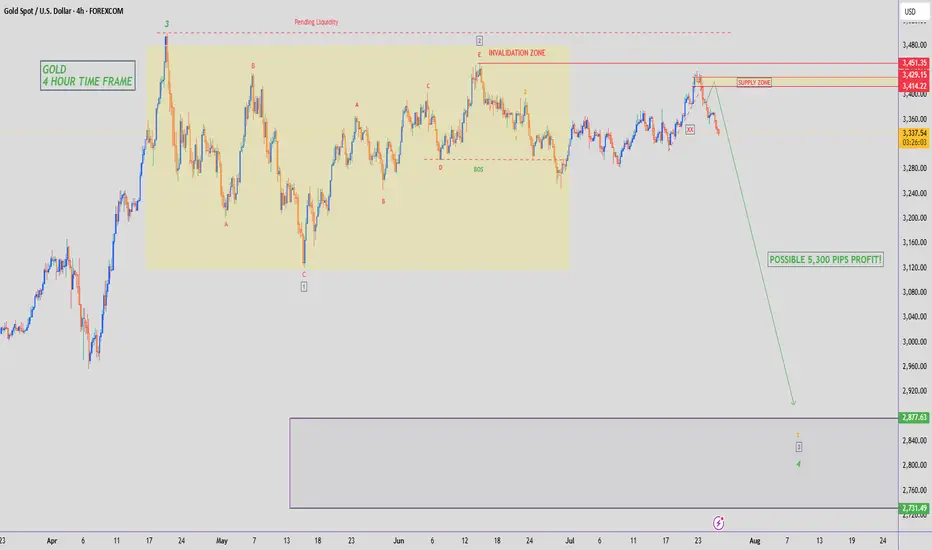
Gold is ready for the 5th wave!Hello! If you're following gold, here's some exciting news. The triangle correction phase that began in April is almost over. It's been a long journey, but we're almost there.
And guess what? The final phase is expected to reach around $4,300. But wait, there's more! The price is holding above the top of a long-term channel. This isn't just a random move; it could be a strong signal that the price could rise even higher than the $4,300 mark.
So, if you're following the gold market, keep your eyes peeled. Big moves could be just around the corner!
SellRejection Level
Daily Volume
Market Structure Shift
London Session
Trend Line Break
Untapped Order Point
GOLD BULLISH IN 1HR TIME FRAME GOLD followed the same pattern from its previous data and will be going for the ATH

Gold approaches wedge resistance -Breakout or Fakeout incoming?Gold is trading within a rising wedge pattern, showing consistent higher lows and repeated rejections near the 3400 resistance zone.
Price is now approaching the upper trendline, an area of prior wick rejections and potential liquidity grab.
A confirmed breakout could signal continuation, while failure to sustain above this level may indicate bearish divergence or a reversal setup.👀📉

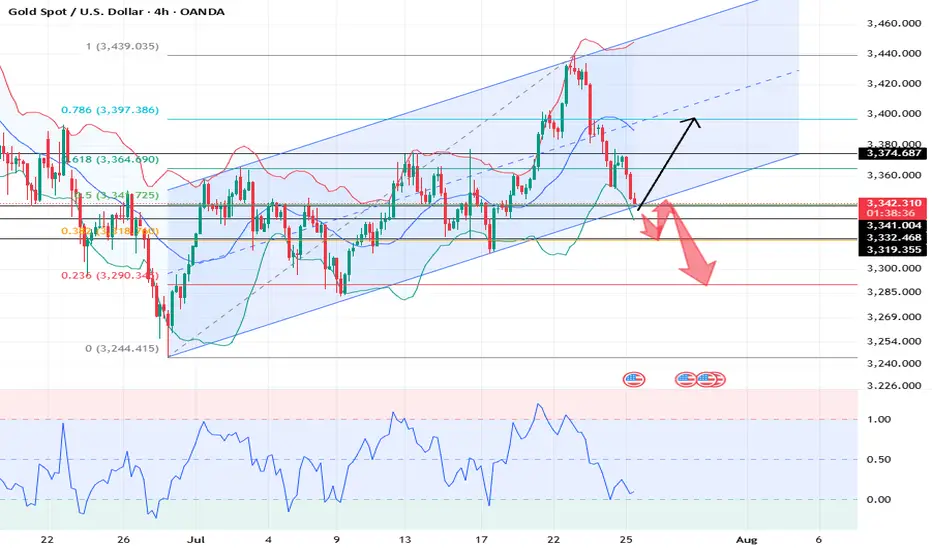
XAUUSD: Market Analysis and Strategy for July 25Gold technical analysis:
Daily chart resistance 3400, support 3300
4-hour chart resistance 3375, support 3342
1-hour chart resistance 3350, support 3333.
Gold, starting from 3438 this Wednesday, has fallen by nearly $100. It rebounded quickly after falling to 3351 yesterday. After sideways fluctuations in the Asian session, the current price is around 3343, and the key support below is around 3333. From a spatial point of view, this wave of adjustment is nearing its end. After waiting for the adjustment to be completed, the market will most likely return to an upward trend.
The short-term top and bottom resistance at the 1-hour level is around 3351. For intraday short-term operations, the current gold price is around 3343. Pay attention to the bearish trend near 3351. If it does not break near 3333, it will be bullish again!
SELL: 3350near
BUY: 3333near
GOLD SELLGold price bears retain control amid fading safe-haven demand, rebounding USD
US President Donald Trump announced late Tuesday that his administration had reached a trade deal with Japan. Furthermore, reports that the US and the European Union are heading towards a 15% trade deal boost investors' confidence and weigh on the safe-haven Gold price for the second straight day on Thursday.
The markets do not expect an interest rate cut from the US Federal Reserve in July despite Trump's continuous push for lower borrowing costs. In fact, Trump has been attacking Fed Chair Jerome Powell personally over his stance on holding rates and repeatedly calling for the central bank chief's resignation.
Moreover, Fed Governor Chris Waller and Trump appointee Vice Chair for Supervision Michelle Bowman have advocated a rate reduction as soon as the next policy meeting on July 30. This keeps the US Dollar depressed near a two-and-a-half-week low and could offer some support to the non-yielding yellow metal.
Traders now look forward to the release of flash PMIs, which would provide a fresh insight into the global economic health and influence the safe-haven commodity. Apart from this, the crucial European Central Bank policy decision might infuse some volatility in the markets and drive the XAU/USD pair.
Meanwhile, the US economic docket features Weekly Initial Jobless Claims and New Home Sales data, which, in turn, would drive the USD and contribute to producing short-term trading opportunities around the commodity. Nevertheless, the fundamental backdrop warrants caution for aggressive traders.
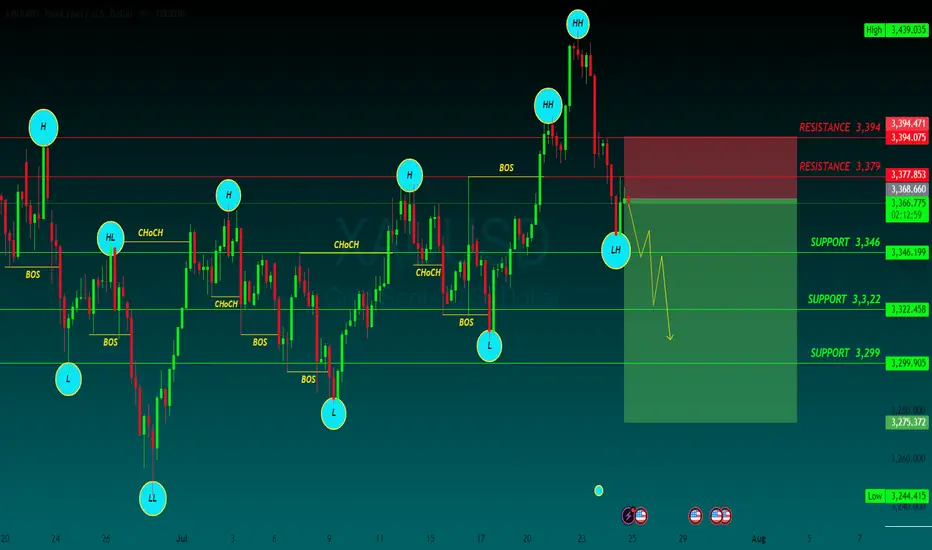
SUPPORT 3,346
SUPPORT 3,322
SUPPORT 3,399
RESISTANCE 3,394
RESISTANCE 3,379
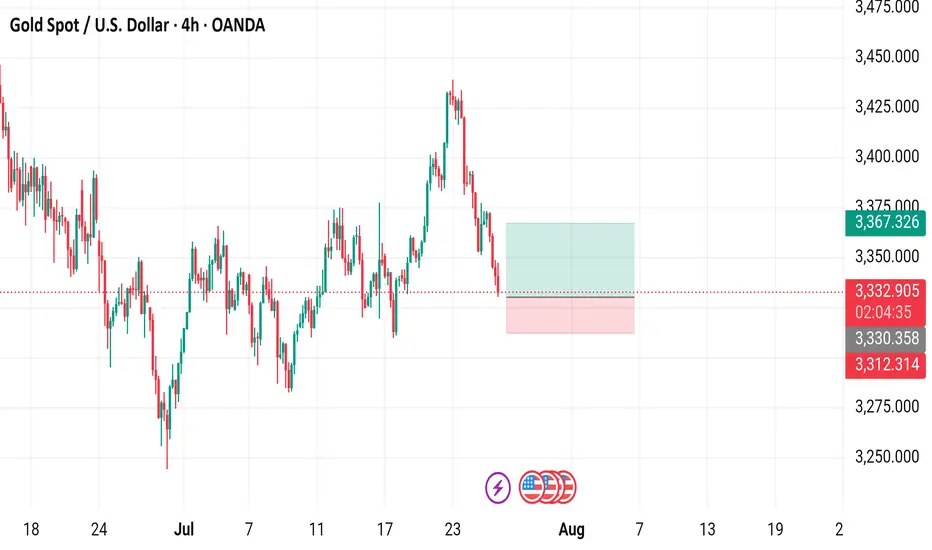
Gold Spot / U.S. Dollar (XAUUSD) - 4 Hour Chart (OANDA)4-hour chart from OANDA displays the price movement of Gold Spot (XAUUSD) from late July to early August 2025. The current price is $3,332.775, reflecting a decrease of $35.935 (-1.07%) as of 07:54 PM PKT on July 25, 2025. Key levels include a sell price of $3,332.480 and a buy price of $3,333.050. The chart shows recent volatility with a shaded support zone around $3,312.314 to $3,367.326, indicating potential price stabilization or reversal areas.
GOLD - SHORT TO $2,880 (UPDATE)Gold sellers have now pushed down to where price opened on Monday, turning the weekly candle bearish. A huge move down, compared to where price was at on Tuesday high!
R.I.P to those who bought the top. But this is what happens when you trade without a strategy or guidance⚰️
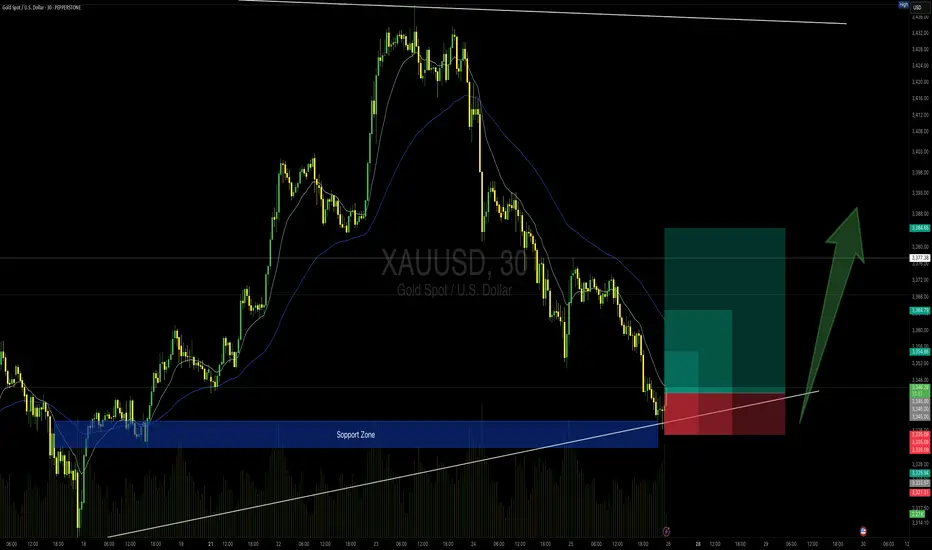
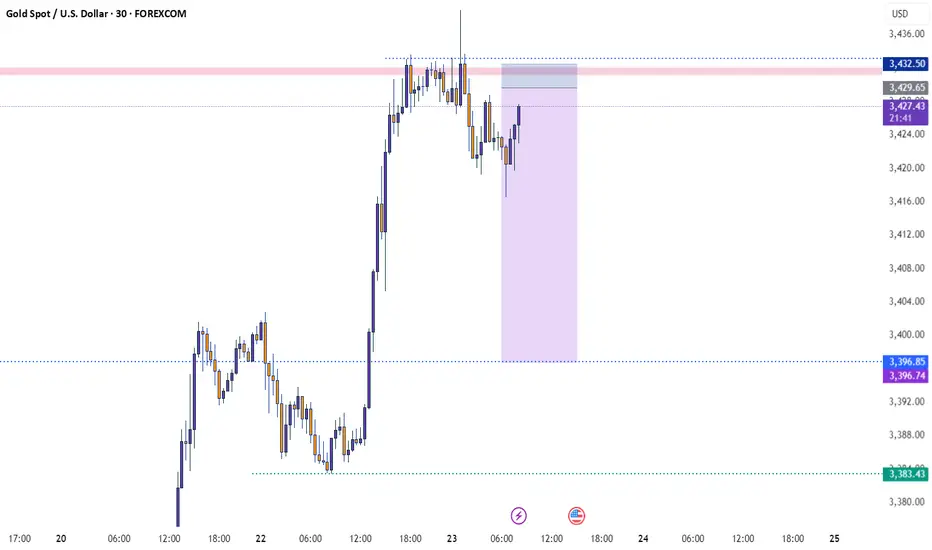
GOLD 30min Buy Setup (High Risk - High Reward)📍 TVC:GOLD 30min Buy Setup – MJTrading View
After an extended bearish leg, price has tapped into a strong support zone that previously acted as a launchpad. Also touching the main Uptrend...
We now see initial signs of absorption with potential reversal setup forming just above the ascending trendline.
🔹 Entry Zone: 3344–3346
🔹 SL: Below 3335 (under structure & wick base)
🔹 TP1: 3355
🔹 TP2: 3365
🔹 TP4: 3385+ (if momentum sustains)
🔸 RR: Up to 1:4 depending on target selected
🧠 Context:
– Still inside broader bullish structure (macro HL)
– Support zone coincides with rising trendline
– Potential for bullish reaccumulation after sharp drop
– Volume spike near zone suggests active buyers
Stay sharp and manage your risk please...
See the below Idea for full concept:
"Support isn't just a level — it’s a battlefield. If buyers win, they don’t look back."
#MJTrading #Gold #BuySetup #PriceAction #SmartMoney #ChartDesigner #ReversalSetup #MarketStructure
Psychology Always Matters: