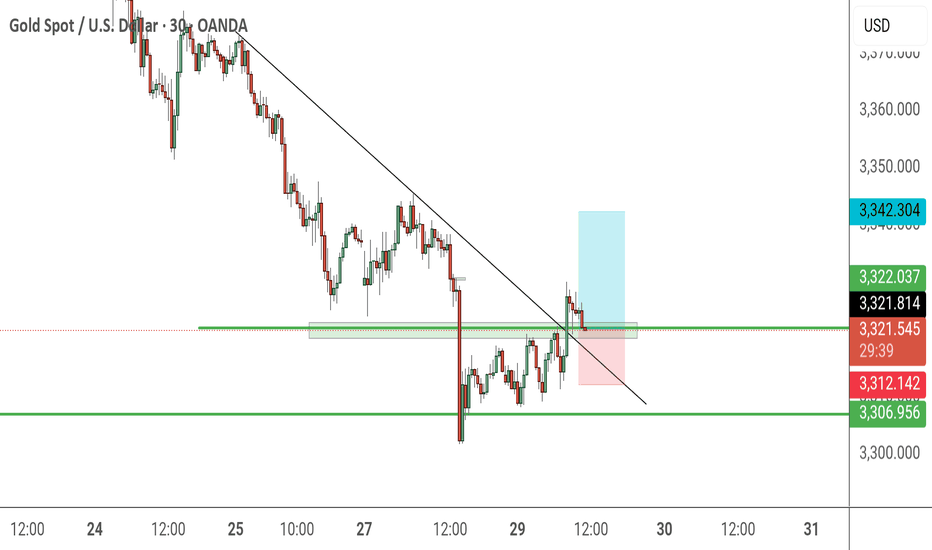
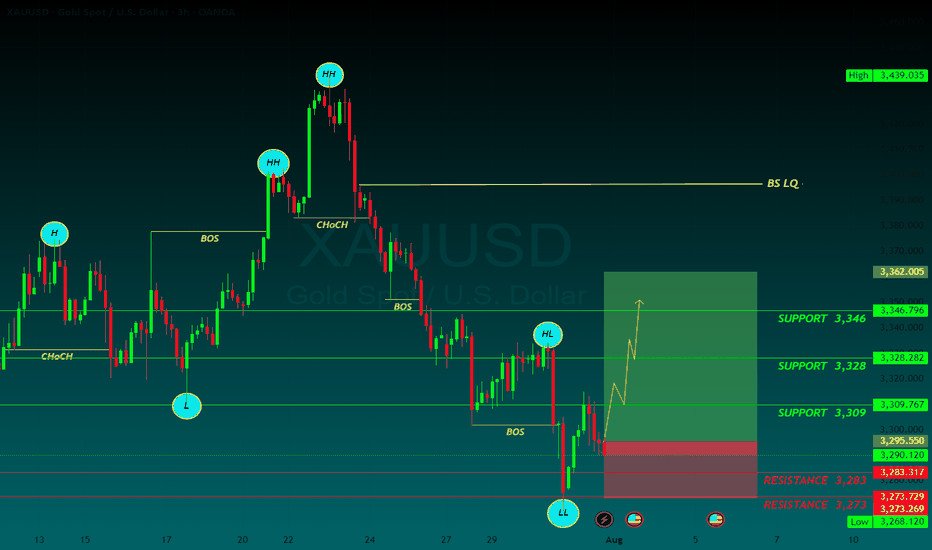
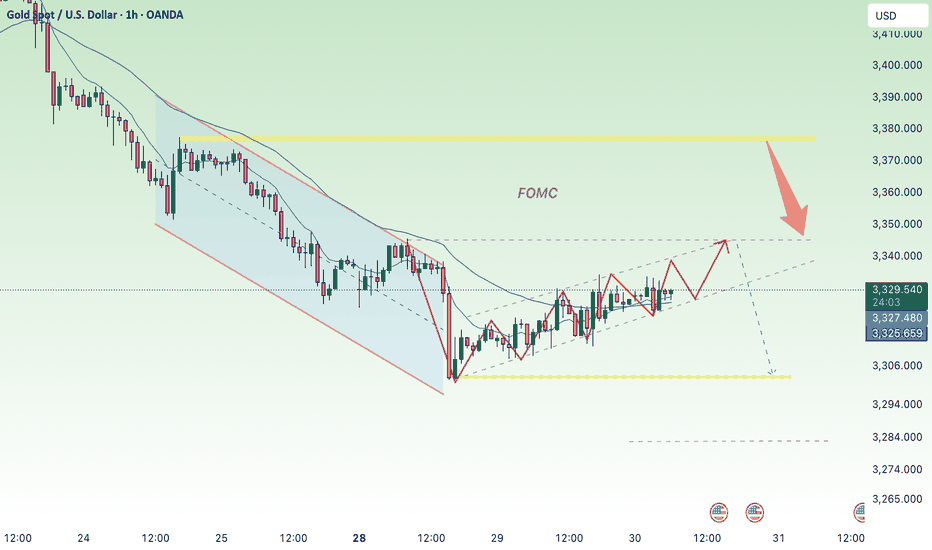
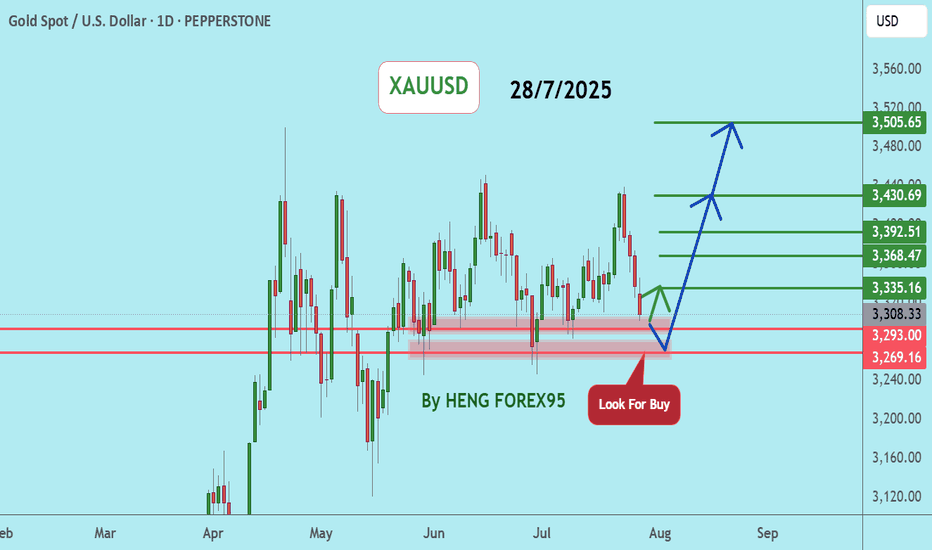
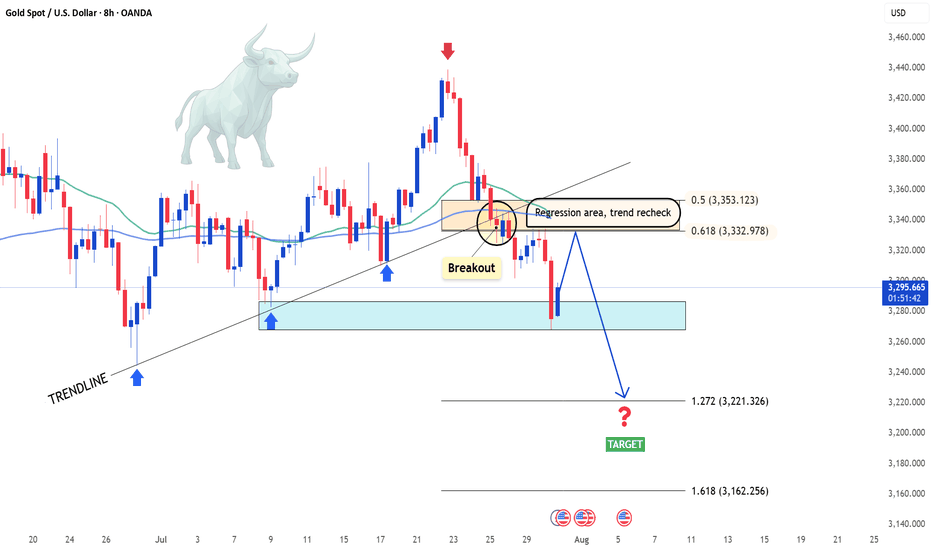
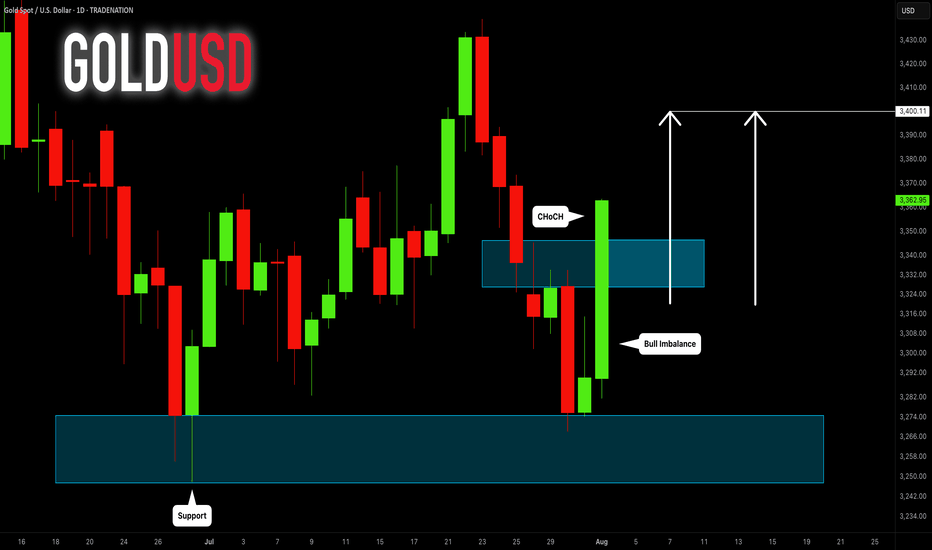
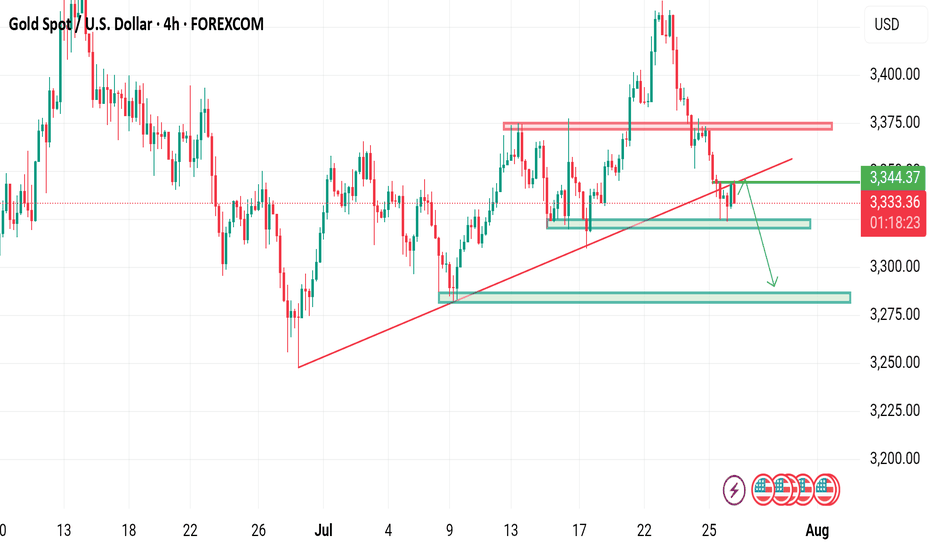
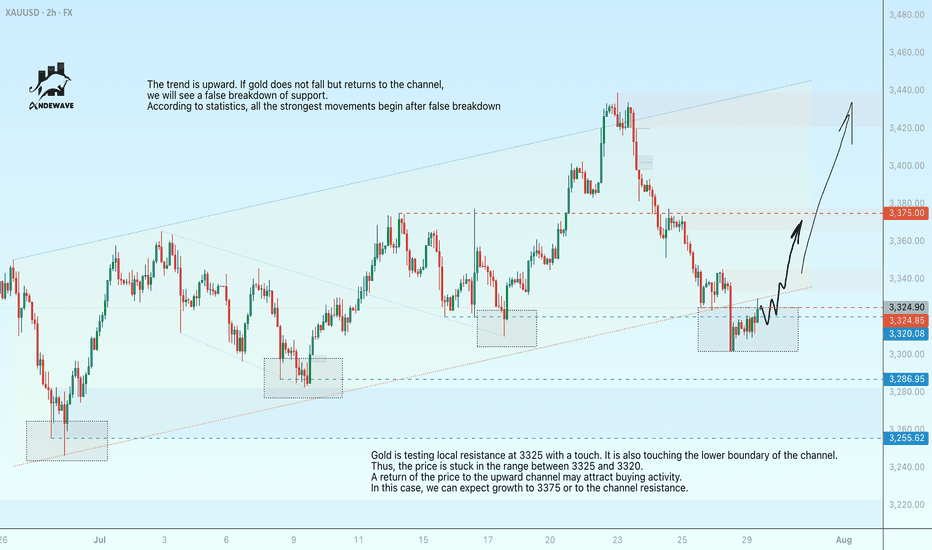
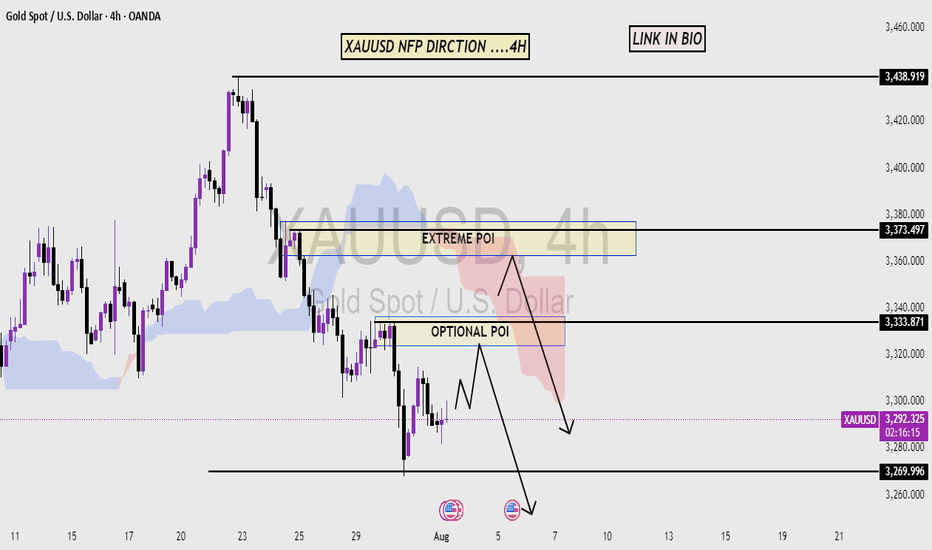
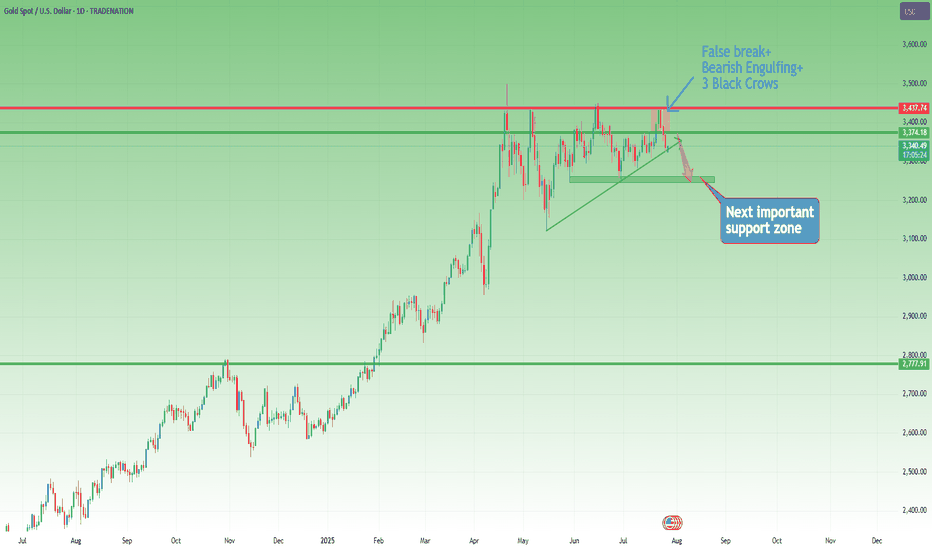
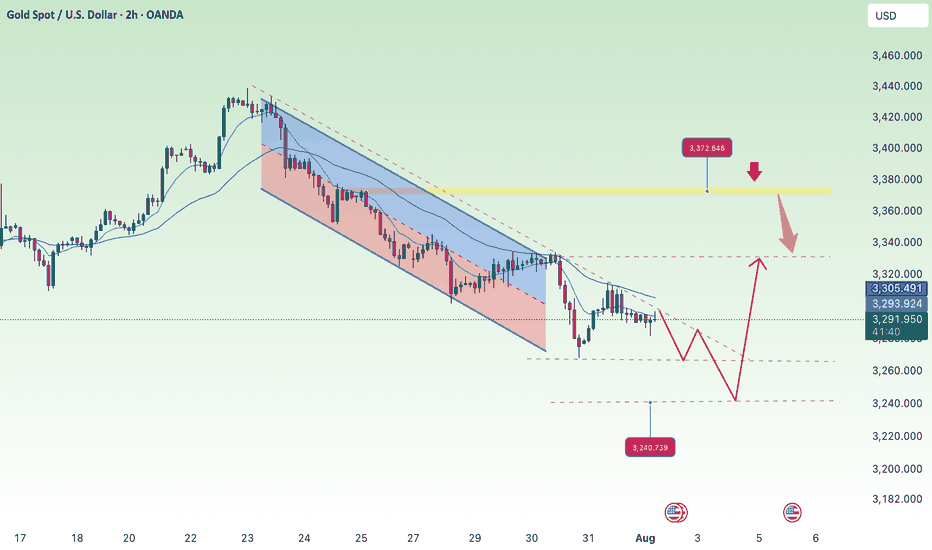
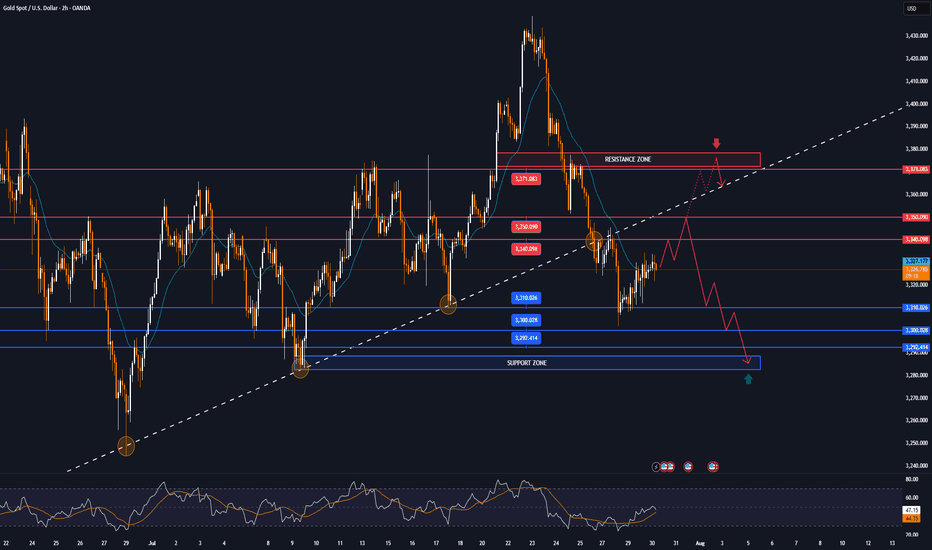
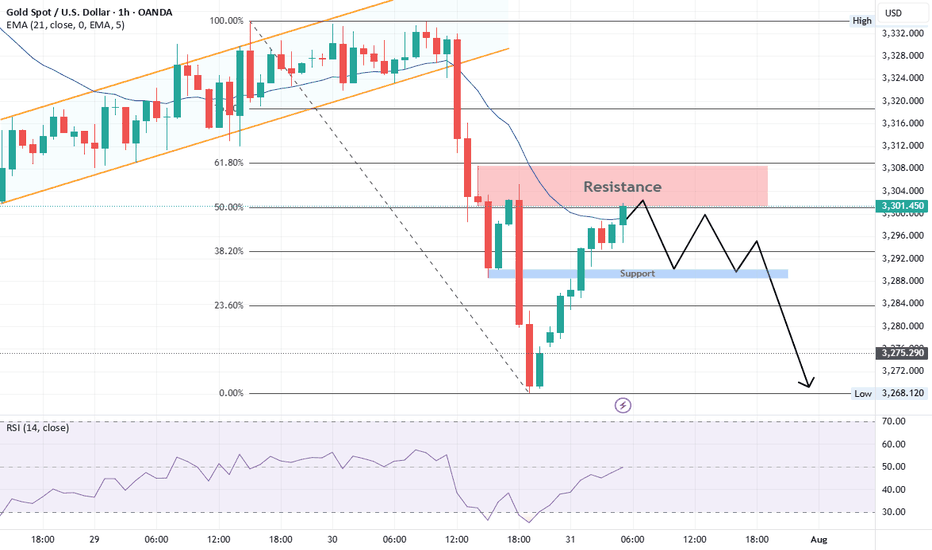
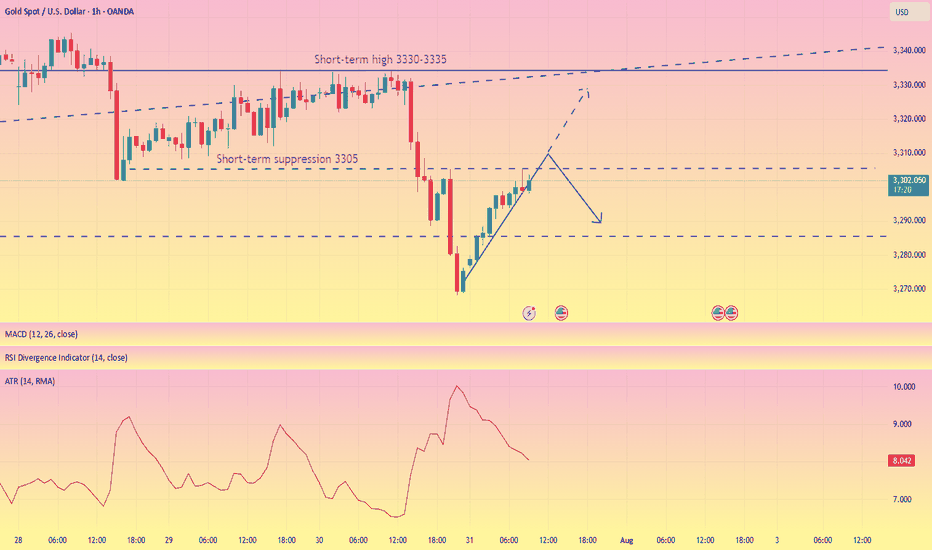
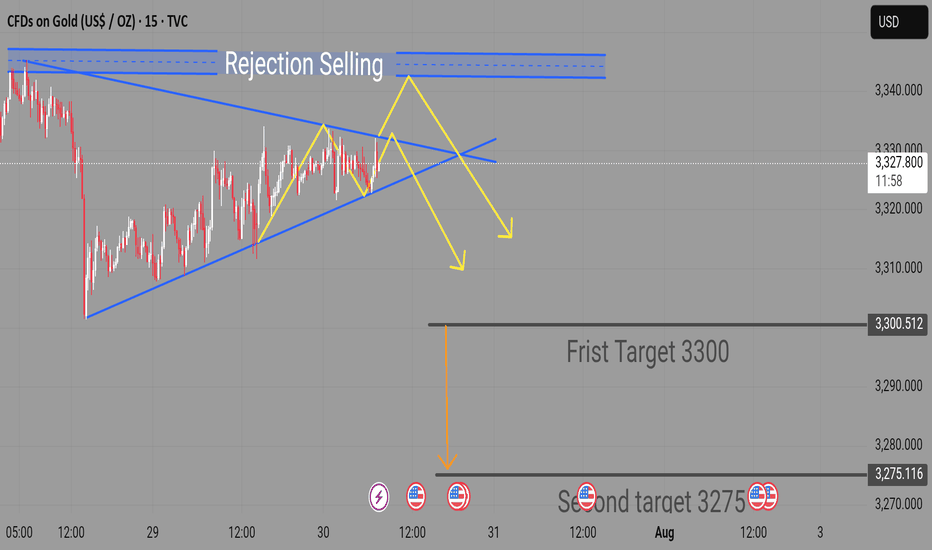
The Fed’s decision may guide the direction of gold
💡Message Strategy
Gold prices fell more than 1% as traders locked in profits after hitting an 8-week high, with attention turning to the Fed's policy decision and diplomatic signals from Iran. The move puts gold on track to form a bearish closing price reversal pattern, suggesting further consolidation if no new safe-haven demand emerges.
Safe-haven demand stagnates as Israel-Iran tensions ease
Geopolitical risks from the ongoing Israel-Iran conflict have been one of the key drivers of gold's recent gains. However, as reports emerged that Iran was willing to restart nuclear talks through an Arab intermediary, market reaction became muted.
These developments led to a more than 3% drop in crude oil prices and eased inflation concerns. Despite the continued tensions in the Middle East, the change still limited further gains for gold. U.S. Treasury yields were almost flat on the day, reflecting a decline in the market's urgent demand for traditional safe-haven assets.
A weaker dollar failed to support gold's gains
The U.S. dollar index (DXY) fell to 97.685, just above last week's multi-year low. Bearish sentiment persists, and new short positions may curb any rebound.
Gold's failure to rise despite a weaker dollar indicates overall hesitation in the market. Analysts pointed out that the lack of safe-haven inflows into the dollar and U.S. Treasuries highlights that traders are more focused on upcoming central bank guidance than geopolitical factors.
Fed outlook will dominate short-term price action
Traders are now awaiting the Fed’s decision on Wednesday, with expectations that interest rates will remain unchanged, but forward guidance will be key.
Gold could face new pressure if Fed Chairman Powell turns hawkish or suggests that interest rates will remain high for a long time. Any signs of policy normalization could boost the dollar and weaken gold’s appeal. However, a dovish tone or concerns about the persistence of inflation could strengthen support for gold near technical key levels.
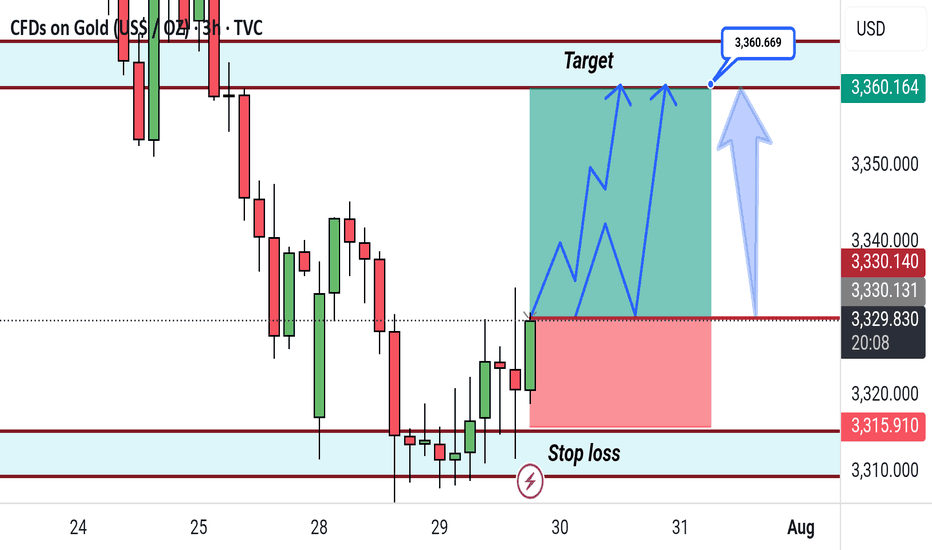
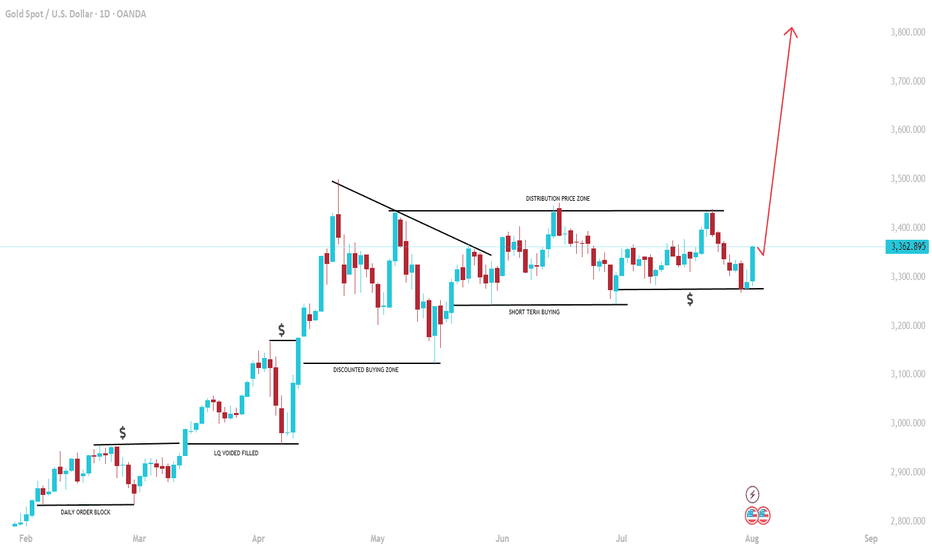
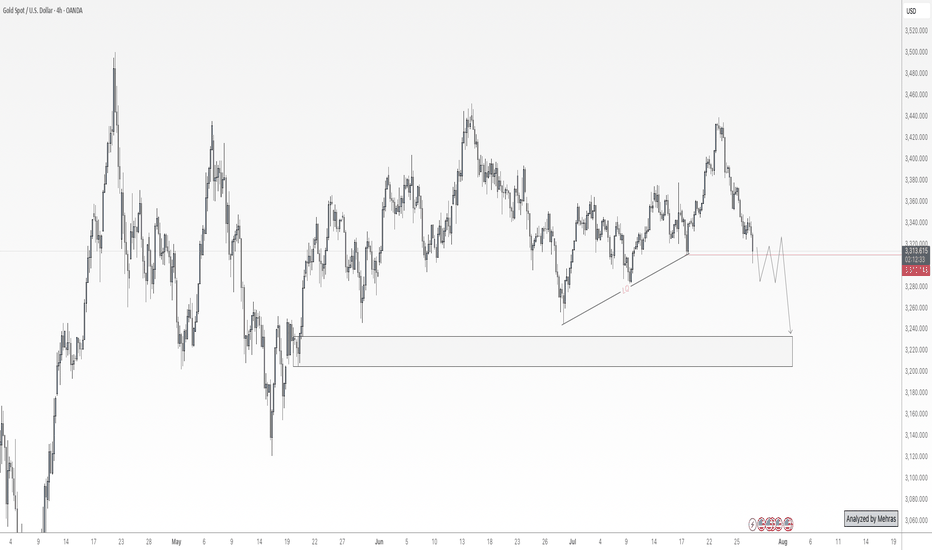
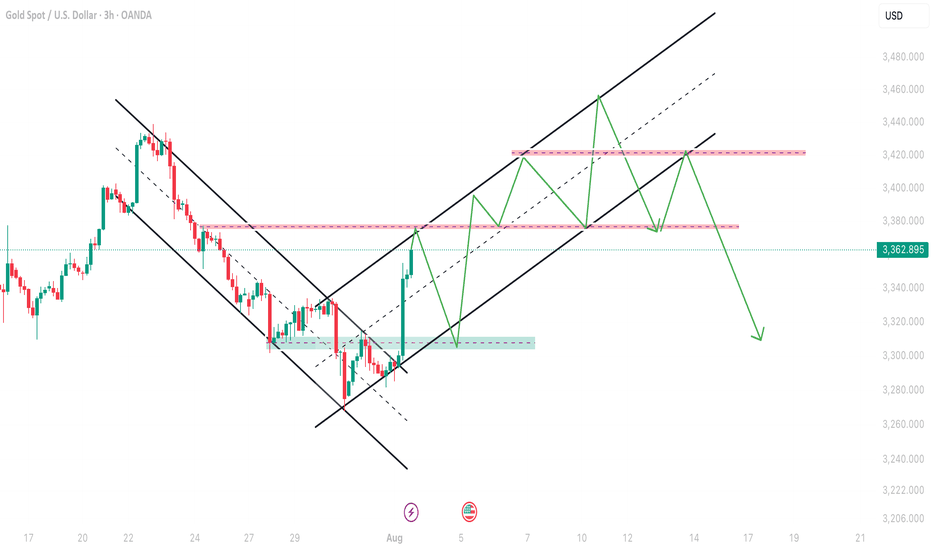
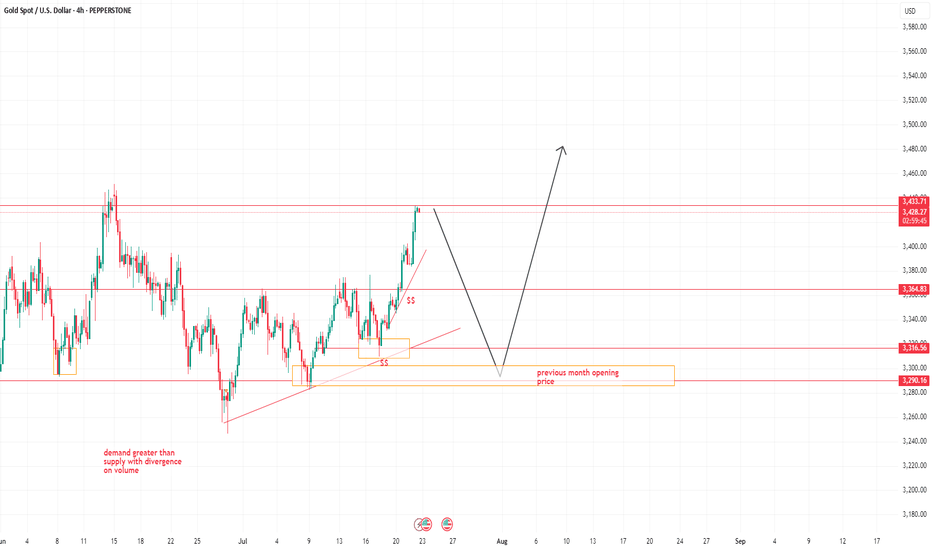
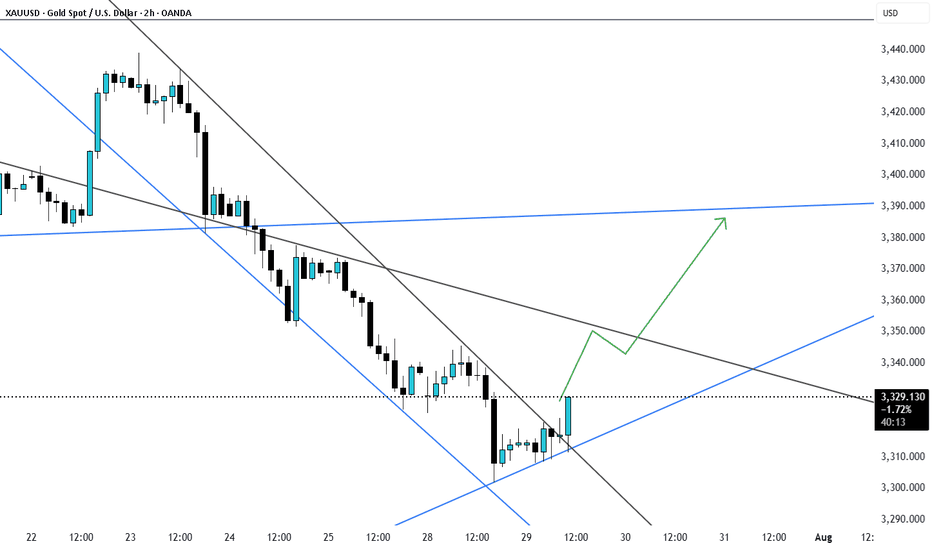
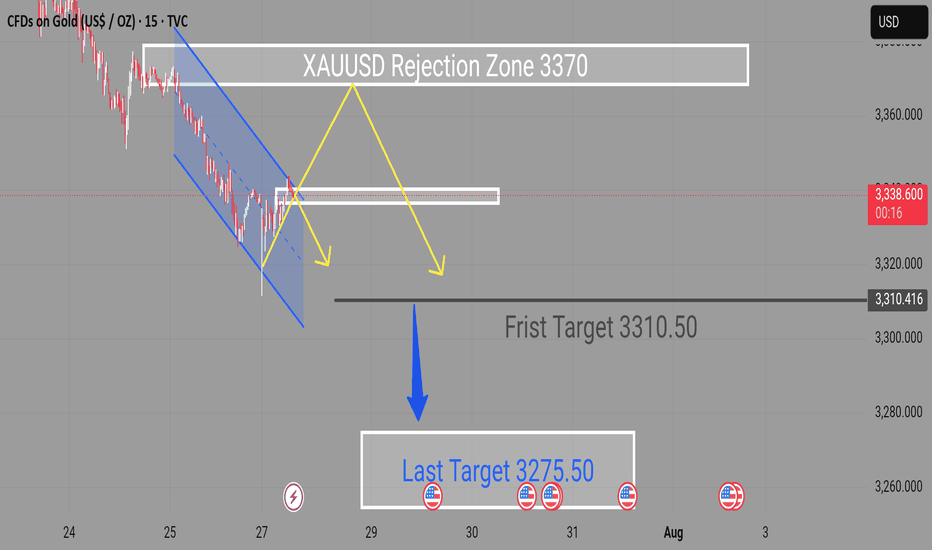
Gold price forecast: If the $3310 range support is effective, the bullish trend remains
📊Technical aspects
From a technical perspective, gold is testing a key support area. A drop to around $3,380 could trigger new buying; if this level is lost, it will further test the $3,350 support level.
On the upside, resistance is close to $3,450, and if bullish momentum resumes, the all-time high of $3,500.20 is still possible.
For now, the forecast maintains a cautiously bullish tone, provided that the $3,310 support level remains solid and the Fed avoids turning hawkish.
💰 Strategy Package
Long Position:3375-3380
Short Position:3410-3420
GOLDCFD trade ideas
XAUUSD Sniper Plan – June 18, 2025Hey GoldMinds! 💛
After a messy reaction to today's Retail Sales miss, Gold continues to coil inside a premium range. With FOMC projections, rate statement, Powell’s press conference, and Unemployment Claims lined up next — volatility is far from over. Here’s our refined tactical plan 👇
🌍 Macro & Geopolitical Context
• US Retail Sales disappointed — signaling cracks in consumer demand, potentially weighing on the USD.
• Unemployment Claims up next — job market weakness could add pressure on USD if claims increase.
• FOMC day: Expect massive liquidity sweeps during economic projections, rate decision, and Powell’s press conference.
• Geopolitical tensions persist — no ceasefire in Middle East conflicts (Israel–Iran), and Russia–Ukraine remains unstable. Safe haven bids may still support gold on dips.
🧭 Bias: Tactical Neutral → Bearish
• Price remains capped under 3415–3445 supply
• EMAs are showing indecision: H1 trapped between EMA 5–21, H4 leaning weakly bullish
• RSI on most TFs is neutral → market waiting for event catalyst
• Structure suggests bull trap risk if 3415 holds
🔑 Key Sniper Zones
🔻 Sell Zones
1️⃣ 3405 – 3415
→ H1-H4 OB + FVG + sweep confluence
→ Premium liquidity pocket — ideal trap for reactive sellers
→ Watch M15 for rejection confirmation
2️⃣ 3430 – 3445
→ Upper inducement + clean OB + imbalance
→ Only valid if price spikes irrationally post-FOMC
→ Stronger reversal setup likely here
🟡 Pullback Monitor Zone
3390 – 3398
→ No trade zone — watch for signs of rejection or continuation
→ Could act as short-term resistance before deeper moves
🟢 Buy Zones
1️⃣ 3365 – 3380
→ Bounce zone with clean confluence: FVG, OB, previous HL
→ Best used for reactive entries after wick flushes
→ Key pivot zone with HL structure
→ OB + FVG combo, ideal for tactical long bounces with M15/M30 confirmation
2️⃣ 3335 – 3345
→ Deeper structure retracement zone
→ Contains H4 OB, imbalance + golden Fibo pocket
→ Most reactive buy zone post-event volatility
🧠 Battle Plan Recap
• If price fails to break 3415, we prepare for further bearish continuation
• Bounces expected at 3365–3380 — confirmation needed
• Final long setup lives at 3335–3345 — cleanest buy zone if FOMC triggers selloff
• 3390–3398 is not for entries — only reaction monitoring
• FOMC + Claims = high risk day → trade only sniper zones
✨ Final Notes
Volatility creates traps. Structure gives clarity.
We don’t predict — we react to the third move.
👇 Found this valuable? Hit the 🚀, follow for more sniper plans, and comment your bias!
Let’s trade like pros, not guessers — GoldFxMinds 🧠✨
Gold prices will rise to $4,000 in 2025!Gold may face tailwinds due to the current negative geopolitical developments around the world. Gold has risen sharply this year, up more than 20% and has repeatedly hit historical highs. With the influence of wars and geopolitical factors around the world, gold may rise even higher in the current context. I personally think that gold will rise to a price of $4,000 this year!
At the same time, Bank of America is one of the institutions that is particularly bullish on the future of gold. In a report shared last week, the bank's experts said that gold may reach $4,000 per ounce in the next 12 months.
Bank of America pointed out that as interest rates fluctuate and the US dollar weakens, investors continue to flock to safe-haven assets, and the rebound may continue. The bank also said that despite the rise in gold prices, investors are still underinvested in gold.
"We estimate that investors have allocated 3.5% of their portfolios to gold... which is still below the historical high in 2011," Bank of America assessed, suggesting that more capital from individual investors may be invested while the rebound continues.
Likewise, while central banks have clearly increased their investments in gold in recent years, the bank's report noted that the proportion of gold they hold is close to 18%, below the all-time high during the Bretton Woods era in the 1970s.
Nevertheless, according to the European Central Bank (ECB), gold is currently the second-largest reserve asset held by central banks, second only to the U.S. dollar.
Another key driver may come from geopolitical developments, including the recent outbreak of the Israel-Iran conflict. After the first round of bombing, gold futures rose to $3,440, approaching its record price of $3,500. Oil price futures also rose due to the impact of the escalating conflict.
Previously, JPMorgan Chase had envisioned a path for gold to reach $6,000, which included shifting 0.5% of U.S. foreign exchange assets to gold.
So friends who regard gold as a long-term investment, the current volatility is nothing, it is a good time to start!
DeGRAM | GOLD kept the rising channel📊 Technical Analysis
● Price rejected the channel roof near 3 435 again, carving a small evening-star and slipping back under the May trend-median 3 370 — a repeat of April/May fades.
● Bearish RSI divergence plus a break of the micro up-sloper (last three sessions) tips for a rotation toward the lower rail/3 295 support; loss of that opens the April pivot at 3 225.
💡 Fundamental Analysis
● Sticky US retail-sales and hawkish Fed comments keep 2-yr yields near 4.8 %, firming the DXY, while CFTC data show specs cutting longs for a second week — limiting bid depth.
✨ Summary
Sell rallies 3 410-3 430; sustained trade below 3 366 targets 3 295, stretch 3 225. Short view void on an H4 close above 3 450.
-------------------
Share your opinion in the comments and support the idea with a like. Thanks for your support!
Adjusted down 3385 at the beginning of the week⭐️GOLDEN INFORMATION:
Gold prices (XAU/USD) climbed toward $3,445 during the early Asian session on Monday, marking their highest level in over a month as mounting tensions in the Middle East and growing expectations of a Federal Reserve rate cut bolstered demand for safe-haven assets.
Despite stronger-than-expected US economic data on Friday, investors remained focused on geopolitical risks. The University of Michigan’s Consumer Sentiment Index for June jumped to 60.5, well above the consensus forecast of 53.5 and May’s reading of 52.2. However, markets largely shrugged off the data.
Instead, attention turned to the escalating conflict in the Middle East, where Israel’s recent strike on Iran has intensified fears of broader regional instability. In response, Iranian authorities warned they would “respond firmly to any adventurism,” reinforcing gold’s appeal amid global uncertainty.
⭐️Personal comments NOVA:
At the beginning of the week, gold prices adjusted slightly down, returning to the liquidity zone of 3385, before continuing the uptrend.
⭐️SET UP GOLD PRICE:
🔥SELL GOLD zone: 3462- 3464 SL 3469
TP1: $3450
TP2: $3440
TP3: $3430
🔥BUY GOLD zone: $3390-$3388 SL $3383
TP1: $3400
TP2: $3410
TP3: $3422
⭐️Technical analysis:
Based on technical indicators EMA 34, EMA89 and support resistance areas to set up a reasonable SELL order.
⭐️NOTE:
Note: Nova wishes traders to manage their capital well
- take the number of lots that match your capital
- Takeprofit equal to 4-6% of capital account
- Stoplose equal to 2-3% of capital account
June 19 XAUUSD Setup — FOMC Aftershock or Bull Trap? Hey traders 👋
After yesterday’s FOMC fireworks and a weak reaction to initial retail sales data, gold broke structure into 3363 and is now floating below key resistance. Price is compressing under the previous H1 lower high, and liquidity continues to build on both sides — perfect conditions for engineered spikes.
Let’s break it down clearly.
🌍 Macro & Sentiment
Yesterday’s FOMC left rates unchanged, but Fed tone leaned hawkish.
Retail Sales and Unemployment Claims disappointed — slight downside pressure on the dollar.
Geopolitical front remains tense: no ceasefire in Gaza, Iran-Israel rhetoric escalates, and Russia-Ukraine conflict is ongoing.
Liquidity is king — and gold is being boxed for the next big move.
📉 Bias & Structure
Daily: Compression after FOMC, lower high remains in control.
H4: Bearish break below 3380, EMA21 hovering above price.
H1: Trendline structure broken, EMA5/21 forming bearish cross, RSI below 50.
Fibo: H1 drawn from 3452 to 3363 — key golden zone at 3405–3415.
🎯 Bias: Tactical Bearish under 3415 — looking for short-term bounces or premium traps to sell.
🧠 Sniper Zones
🔻 Sell Zones
1️⃣ 3405 – 3415
→ Key golden zone + EMA21 + FVG
→ Monitor M15/M5 rejection for continuation sells
2️⃣ 3435 – 3445
→ Premium OB trap zone
→ If price spikes irrationally, this becomes the extreme reversal area
🔺 Buy Zones
1️⃣ 3365 – 3380
→ Golden buy zone — real fib confluence
→ Already tapped today, but any clean retest may offer reactive bounce trades
2️⃣ 3335 – 3345
→ Extreme flush zone — only valid if deep dump occurs
→ Watch for exhaustion and M15 reversal confirmation
🔻 Emergency Buy Zone:
3305 – 3292
🧠 Why this zone?
✅ H4 untested Order Block + FVG (June 11 candle).
✅ 78.6% Fibonacci retracement (H1 swing from 3452 → 3363).
✅ RSI likely to print oversold.
✅ Deep discount structure — potential final inducement for reversal.
🔔 Important:
This is a backup zone, not for blind entries.
It only becomes active if 3335 breaks with conviction (full candle body close + volume).
Look for M15/M5 confirmation (divergence + price action signal) before engaging.
🔄 Flip Zone
3390 – 3398
→ Volume zone from FOMC + OB test
→ If reclaimed cleanly, may flip intraday bias short-term
📌 Battle Notes
Gold tapped 3363 today, reacting mildly.
If price retraces toward 3405–3415, I’ll watch for shorts — but no early entries.
Below 3365, watch for another bounce or setup around 3345.
Flip zone remains indecisive until confirmed with volume.
🧭 Plan Recap
→ Bearish under 3415
→ Pullback into 3405–3415 = short setup
→ Retest 3365–3380 = bounce watch
→ Flush into 3335 = reversal zone
→ 3435+ = irrational spike trap
🧠 Stay sniper. Wait for price to come to your zones — and execute only on confirmed reactions.
—
🚀 If this helped bring clarity, tap that 🚀, leave your bias in the comments, and hit FOLLOW for real structure-based trading.
🟨 Disclosure: I am part of TradeNation's Influencer program and receive a monthly fee for using their TradingView charts in my analyses and educational articles.
— GoldFxMinds 🧠✨
Gold Breaks $3400 – Targets $3500 Amid Tensions (READ)By analyzing the gold chart on the lower timeframe, we can see that today, following Israel's missile and airstrike attacks on Iran, gold experienced a sharp rally. As anticipated last night, gold finally managed to break through the strong $3400 resistance, surging over 600 pips to reach $3447.
Currently, gold is trading around $3438, and given the escalation in geopolitical tensions, I expect further upside movement.
The next potential targets are $3449, $3469, and possibly $3500.
⚠️ Due to ongoing conflict and extreme volatility, it's advised to avoid trading or proceed only with minimal risk exposure.
Please support me with your likes and comments to motivate me to share more analysis with you and share your opinion about the possible trend of this chart with me !
Best Regards , Arman Shaban
GOLD
The Federal Reserve is likely to interpret the June 2025 University of Michigan (UoM) consumer sentiment and inflation expectations data as mixed but cautiously encouraging, with implications for monetary policy:
Key Data Points
Consumer Sentiment: 60.5 (vs. 53.5 forecast, prior 52.2) – a sharp rebound to the highest level since mid-2023.
What is UoM consumer sentiment? The University of Michigan Consumer Sentiment Index (MCSI), often referred to as UoM Consumer Sentiment, is a widely followed monthly survey that measures how optimistic or pessimistic American consumers feel about the overall economy and their financial situation.
Key Details:
Purpose: It measures consumer attitudes toward current and future economic conditions, including personal finances, business conditions, and purchasing intentions. Since consumer spending accounts for about 68% of the U.S. economy, the index is a valuable leading indicator of economic activity.
Methodology: The University of Michigan conducts telephone and web surveys of a representative sample of U.S. households (around 500–1000 respondents), asking about their financial health, short-term and long-term economic outlook, and expectations for inflation and interest rates.
Components:
Current Conditions Index — consumers’ assessment of the present economic situation.
Consumer Expectations Index — consumers’ outlook for the economy over the next 6–12 months.
Release Schedule: Preliminary data is released mid-month, with a final report at month-end.
Significance:
Reflects consumer confidence and spending intentions.
Helps forecast economic growth and inflation trends.
Influences financial markets and policy decisions.
Summary
The UoM Consumer Sentiment Index is a key measure of how confident consumers feel about the economy, which in turn signals their likely spending behavior and economic outlook. Higher sentiment typically suggests stronger consumer spending and economic growth, while lower sentiment indicates caution and potential economic slowdown.
1-Year Inflation Expectations: 5.1% (vs. 6.6% prior) – a significant decline, nearing pre-tariff levels.
Fed Interpretation
Improved Consumer Sentiment:
The jump to 60.5 signals renewed optimism about the economy, likely driven by reduced trade tensions (e.g., tariff pauses) and stable labor markets. This aligns with recent upward revisions to April and May sentiment data.
The Fed will view this as a sign of economic resilience, reducing the urgency for near-term rate cuts to stimulate growth.
Sharply Lower Inflation Expectations:
The drop to 5.1% (from 6.6%) aligns with the New York Fed’s May 2025 survey showing declining inflation expectations across all horizons.
This suggests consumers are growing more confident that the Fed’s policies (and tariff adjustments) are curbing price pressures, easing fears of a wage-price spiral.
Policy Implications:
Dovish Tilt Supported: Lower inflation expectations reduce the risk of entrenched price pressures, giving the Fed flexibility to cut rates later in 2025 if growth slows.
No Immediate Cuts Likely: Strong sentiment and a resilient labor market (unemployment at 4.2%) justify maintaining rates at 4.25–4.50% in July.
Focus on Tariff Risks: The Fed will remain cautious about potential inflation rebounds from Trump’s tariffs, which could add 1.5% to prices by late 2025.
Market Reactions
DXY (Dollar Index): Likely to dip modestly as lower inflation expectations boost rate-cut bets, but sentiment-driven growth optimism may limit losses. Key support at 96.891 weekly floor will be watched.
Bonds: 10-year yields may edge lower (toward 4.00%) on reduced inflation fears, though strong sentiment could cap declines.
Equities: Stocks (especially consumer-discretionary sectors) may rally on the improved economic outlook.
Conclusion
The Fed will likely view this data as validating its cautious stance: inflation expectations are cooling, but strong sentiment and labor markets argue against premature easing. A September rate cut remains the base case, contingent on continued disinflation and no tariff-driven price spikes.
(2)The Federal Reserve will interpret —Core PPI m/m: 0.1% (vs. 0.3% forecast, prior -0.2%), PPI m/m: 0.1% (vs. 0.2% forecast, prior -0.2%), and Unemployment Claims: 248K (vs. 242K forecast, prior 248K)—as further evidence of a cooling but not collapsing labor market and subdued inflation pressures.
Fed’s Likely Interpretation
1. Producer Price Index (PPI)
what is PPI? PPI stands for Producer Price Index. It is an economic indicator that measures the average change over time in the selling prices received by domestic producers for their output. Essentially, it tracks inflation at the wholesale or producer level, reflecting how prices for goods and services change before they reach consumers.
Key points about PPI:
Published monthly by the U.S. Bureau of Labor Statistics (BLS).
Measures price changes from the perspective of producers/sellers, unlike the Consumer Price Index (CPI), which measures prices from the consumer’s viewpoint.
Includes thousands of indexes across industries and product categories, covering goods and some services.
Used to forecast inflation trends and as a tool for contract escalations and economic analysis.
Often considered a leading indicator of consumer inflation since producer prices tend to influence retail prices over time.
In summary, the PPI helps gauge inflation pressures early in the production process before they
Inflation Remains Subdued: Both headline and core PPI came in below expectations, confirming that producer-side inflation pressures remain mild. This follows a period of outright declines, indicating no broad-based resurgence in input costs.
Tariff Pass-Through Still Limited: While the Fed is alert to potential tariff-driven inflation later in 2025, current PPI data shows businesses are not yet passing higher costs on to consumers in a meaningful way.
2. Unemployment Claims
Labor Market Softening: Initial jobless claims held at 248K, above expectations and at an eight-month high. The four-week moving average also rose, and continuing claims increased to 1.956 million, marking the third consecutive weekly rise. This signals a gradual loosening of the labor market, with more people remaining unemployed for longer periods.
No Immediate Crisis, But Trend Is Clear: The persistently high claims numbers are moving beyond seasonal noise and indicate a structural shift toward weaker hiring.
3. Policy Implications
Supports Dovish Shift: The combination of softer producer inflation and a weakening labor market strengthens the case for the Fed to consider rate cuts later in 2025.
No Immediate Rate Cut: The Fed is expected to keep rates unchanged at its June meeting, but this data increases the likelihood of a cut by September, especially if upcoming CPI and labor data confirm these trends.
Cautious Messaging: The Fed will remain cautious due to the risk of tariff-related inflation later in the year, but current data gives them more flexibility to pivot if growth and employment weaken further.
Conclusion
The Fed will see this data as validating a cautious, data-dependent approach: inflation is contained, and the labor market is softening. While no immediate rate cut is expected, the probability of a cut by September has increased, especially if disinflation and labor market weakness persist.
(3)The Federal Reserve will likely interpret the May 2025 CPI data as signs of moderating inflation but with persistent underlying pressures, leading to a cautious but patient policy stance:
What is cpi??? The Consumer Price Index (CPI) is a key economic indicator that measures the average change over time in the prices paid by consumers for a representative basket of goods and services. It reflects inflation as experienced by consumers in their day-to-day living expenses.
Key Points about CPI:
What it Measures: The CPI tracks price changes for a broad range of items including food and beverages, housing, apparel, transportation, medical care, recreation, education and communication, and other goods and services.
Data Collection: The Bureau of Labor Statistics (BLS) collects about 80,000 price quotes monthly from retail stores, service establishments, rental units, and doctors' offices.
Purpose: It is widely used to monitor inflation, adjust income payments like Social Security, and guide monetary policy decisions by central banks.
Calculation: CPI is a weighted average of prices, reflecting consumer spending patterns, and is updated periodically to account for changes in consumption habits.
Inflation Indicator: The annual percentage change in CPI is a common measure of inflation, indicating how much prices have increased or decreased over a year.
Summary
CPI provides a snapshot of how much prices for everyday goods and services are rising or falling, helping policymakers, businesses, and consumers understand inflation trends and make informed decisions.
The headline CPI rose 0.1% month-over-month, less than the 0.2% expected and down from April’s 0.2% increase, indicating a slowdown in price growth.
The year-over-year CPI increased 2.4%, slightly above April’s 2.3%, but still close to the Fed’s 2% target, showing inflation is near but not fully anchored.
The core CPI (excluding food and energy) rose 0.1% MoM, below the 0.3% forecast and April’s 0.2%, suggesting easing price pressures in most sectors except shelter and some services.
Shelter costs rose 0.3% in May and remain a key driver of inflation, while energy prices declined 1.0%, helping to temper headline inflation.
The Fed will note that tariffs imposed by the Trump administration have not yet significantly pushed up consumer prices, but remain a risk factor that could elevate inflation later in 2025.
Labor market data remain resilient, with unemployment steady at 4.2% and moderate job growth, supporting economic strength but complicating the Fed’s inflation fight.
Policy Implications:
The Fed is expected to hold interest rates steady at 4.25–4.50% in its upcoming June meeting, maintaining a "wait-and-see" approach to assess how tariffs and inflation evolve.
Markets have limited expectations of a rate cut this month but the price in a ~75% chance of a cut by September, contingent on further inflation easing and labor market developments.
The Fed will remain cautious about premature easing given inflation’s stickiness in services and potential tariff pass-through, but the data support a gradual path toward rate cuts later in 2025 if disinflation continues.
In summary: The Fed will see May’s CPI data as encouraging but not definitive evidence of inflation control, justifying a cautious hold on rates in June while preparing markets for possible easing later this year if inflation and labor data continue to improve.
(4)The Federal Reserve will interpret the May 2025 labor market data—Non-Farm Employment Change of 139K (above the 126K forecast), Unemployment Rate steady at 4.2%, and Average Hourly Earnings up 0.4% MoM (above the 0.3% forecast)—as evidence of a resilient but slowing labor market, which supports a cautious approach to monetary policy.
Detailed Interpretation:
Employment Growth Slightly Above Expectations
The addition of 139,000 jobs, exceeding the forecast of 126,000, indicates that job creation continues.
Growth is uneven across sectors, with healthcare and leisure showing strength while government and trade-related sectors have seen declines, reflecting ongoing structural adjustments and policy uncertainties.
Unchanged Unemployment Rate at 4.2%
The stable unemployment rate suggests that the labor market remains relatively tight, consistent with "maximum employment" goals.
However, underlying data show some signs of weakening, such as rising initial jobless claims in late May, which the Fed will monitor closely.
Wage Growth Accelerates Slightly
Average hourly earnings rose by 0.4% MoM, above expectations, signaling persistent wage pressures that can feed into inflation.
Year-over-year wage growth ticked up to 3.9%, reinforcing concerns about labor cost-driven inflation.
Overall Fed View
The Fed sees the labor market as a relative bright spot amid broader economic uncertainties, including trade tensions and slowing GDP growth.
The data suggest the economy is slowing but not collapsing, allowing the Fed to maintain a cautious, data-dependent stance.
Given persistent wage growth and resilient employment, the Fed is likely to hold interest rates steady at the upcoming meetings but remains open to cuts later in 2025 if labor market softness intensifies and inflation continues to moderate.
Conclusion
The Fed will likely interpret this labor market report as supporting a steady policy stance in the near term, balancing ongoing inflation concerns from wage growth against signs of slowing employment gains. Rate cuts remain on the table for later in 2025, contingent on further labor market weakening and sustained inflation declines..
Summary of the three economic data leads the rate hold for now, but cut likely any time soon on the data approach.
#gold #dollar
Gold Eyes New All-Time High as Bullish Trend StrengthensGold continues to push higher in a powerful uptrend, approaching a fresh all-time high with strong bullish momentum. Technical indicators and market structure remain supportive of further upside, with a key Fibonacci extension target at $4,144 now coming into focus.
Gold has maintained a robust weekly bullish trend, characterized by a clear sequence of higher highs and higher lows. Price action remains technically strong across all timeframes, and with price now pressing against previous all-time highs, the next move could either be a temporary consolidation or an explosive breakout into new territory.
Key Technical Points
- Trend Structure Remains Intact: Higher highs and higher lows dominate all major timeframes.
- Moving Averages in Full Bullish Alignment: All key moving averages remain beneath price
action, acting as dynamic support.
- Point of Control Reclaims: Previous consolidations at volume highs have led to continued
breakouts.
- Fibonacci Extension Target at $4,144: This level represents the next major technical upside
target if momentum persists.
From a market structure standpoint, gold is in a textbook uptrend. There have been no breakdowns of prior swing lows, and each move higher has been followed by a constructive consolidation or higher low formation. This consistency reinforces the overall strength of the bullish trend.
All major moving averages (MAs) — whether short-term (21 EMA), medium-term (50 SMA), or long-term (200 EMA) — are stacked beneath current price across all key timeframes. This configuration confirms strong trend alignment and dynamic support, giving buyers further confidence to hold or add on dips.
One of the most bullish technical characteristics has been the repeated reclaiming of key volume zones, particularly the point of control (POC) within high-volume nodes. Price has consistently consolidated around these zones before breaking higher, indicating strong accumulation and controlled trend continuation.
Additional Context: Fibonacci Target and Price Path:
A Fibonacci extension measured from the recent swing low to the swing high projects a technical upside target of $4,144. This is a natural continuation level based on prior market rhythm and trend extension. If gold breaks its all-time high with conviction, this extension becomes the next likely area for price to reach, assuming bullish momentum continues.
What to Expect in the Coming Price Action:
As gold approaches its all-time high, two key scenarios are in play: a minor pullback for a new higher low, or an impulsive breakout toward the $4,144 Fibonacci target. Given the strength in structure and momentum, the path of least resistance remains to the upside — but traders should monitor lower timeframes for confirmation.
Accumulate around 3400, Keep interest rate today⭐️GOLDEN INFORMATION:
Gold prices slipped below the $3,400 threshold on Tuesday, weighed down by renewed strength in the US Dollar (USD), despite a worsening global risk sentiment. The resilience of the greenback limited gains in the safe-haven asset, though mounting tensions between Israel and Iran continue to offer underlying support. At the time of writing, XAU/USD is trading at $3,380, down 0.05%.
Although risk appetite remains subdued, gold has struggled to rally, as the US Dollar regains ground. The US Dollar Index (DXY), which measures the currency against a basket of six major peers, climbed 0.46% to 98.58.
Meanwhile, geopolitical tensions intensified after US President Donald Trump abruptly departed the G7 summit in Canada on Monday in response to unfolding events in the Middle East. In a stark warning posted to his social platform, he urged, “Everyone should immediately evacuate Tehran,” signaling a sharp escalation in the conflict that began last Friday.
⭐️Personal comments NOVA:
Gold price is moving in accumulation zone below 3400 - 3365. Break and return above 3400, continue to accumulate.
⭐️SET UP GOLD PRICE:
🔥SELL GOLD zone: 3437- 3439 SL 3444
TP1: $3425
TP2: $3410
TP3: $3395
🔥BUY GOLD zone: $3338-$3340 SL $3333
TP1: $3346
TP2: $3355
TP3: $3370
⭐️Technical analysis:
Based on technical indicators EMA 34, EMA89 and support resistance areas to set up a reasonable BUY order.
⭐️NOTE:
Note: Nova wishes traders to manage their capital well
- take the number of lots that match your capital
- Takeprofit equal to 4-6% of capital account
- Stoplose equal to 2-3% of capital account
Beyond the Headlines - Gold Outlook June 16-20, 2025Beyond the Headlines: Gold's Ascent Amidst Global Shifts & Key Technicals 🌐🚀
Everything about the last week can be found here:
OANDA:XAUUSD 💰📈
We all know what's going on, I believe. Israel struck Iran 💥, and this conflict will likely take a bit before things cool down. 🥶
---
## Geopolitical News Landscape 🌍📰
### Israel / Iran
Since June 12, Israel launched "Operation Rising Lion," targeting Iranian nuclear sites like Natanz and Esfahan – over 128 killed, Iran claims. 🇮🇷 retaliated with missile and drone strikes on Haifa and Tel Aviv, killing at least 10. 🚀
**Outlook:** 🔥 Tensions are spiraling. Without urgent mediation, full-scale regional war remains a real risk. 💣
### India / Pakistan
Since the May ceasefire, few clashes have occurred. However, both navies increased readiness, signaling potential escalation at sea. 🚢
**Outlook:** ⚖️ Peace is fragile. A strategic dialogue is key to avoiding a renewed border or maritime conflict. 🙏
### Gaza Conflict
Between June 7–15, Israeli strikes killed at least 41 Palestinians, including 8 near an aid center in Rafah. Over 55,000 total deaths, and famine is looming. 💔
**Outlook:** 🆘 Gaza remains a humanitarian catastrophe. Global pressure for access and a ceasefire must intensify. 🕊️
### Russia / Ukraine
June 13–15: Russia returned the bodies of 1,200 Ukrainian soldiers in a rare POW swap gesture. 🤝 Fighting remains intense in Sumy and Toretsk; Russia hit a major oil refinery. 🏭
**Outlook:** 🕊️ While symbolic moves continue, no peace is in sight – battlefield outcomes will shape diplomacy. ⚔️
### U.S. - China Trade War
The U.S. hiked tariffs to 55% on key Chinese goods. 🇺🇸🇨🇳 responded with 10% on U.S. imports. Talks yielded a partial truce, but military-use rare earths remain unresolved. 💻
**Outlook:** 🔧 Tech remains the battleground. Without progress on critical materials, the trade war may deepen. 📉
### Global Trade War
The OECD revised global growth downward due to rising tariffs from the U.S. targeting 🇨🇳, 🇲🇽, 🇨🇦. Global trade volume is expected to shrink by 0.2–1.5%. 📉
**Outlook:** ⛓️ Supply chain disruption is spreading. Global trade will stay under pressure without coordinated policy. 🌍➡️🌍
### Trump vs. Powell
Trump labeled Powell a "numbskull" for not cutting rates, suggesting he might "force something" if re-elected. 🗳️ The Fed maintains policy independence ahead of a critical June decision. 🏛️
**Outlook:** ⚔️ Political pressure on the Fed is mounting. Expect more friction as the election cycle heats up. 🔥
### U.S. Inflation
CPI rose 2.4% YoY in May (from 2.3%); Core CPI held steady at 2.8%. Monthly growth was modest at 0.1%. Key rises were seen in healthcare and vehicle prices. 🚗🏥
**Outlook:** Inflation is stable but sticky. 🚦 The Fed will likely hold rates steady until clearer disinflation signals appear. 📊
---
## Technical View 📐📈
### Market Structure:
Gold shows a clear **bullish market structure** with higher highs and higher lows. ⬆️ Recent price action suggests we're in a strong uptrend with institutional buying pressure. 🏦
### Key Levels:
* The chart shows a significant low around the **$3,245 area** (marked as "Low") which could act as a key institutional support level. 💪
* The current high near **$3,446** represents a potential institutional resistance zone. 🛑
* Look for potential **order blocks** around the **$3,380-$3,400 range** where price consolidated before the recent breakout. 🧱
### Fair Value Gaps (FVG):
There appear to be several gaps in the price action during volatile moves, particularly during strong rally phases. These could act as future support/resistance areas. 📉📈
### Gann Analysis:
The price movement shows strong adherence to Gann principles:
* The rally from the low follows a steep angle, suggesting strong momentum. 🚀
* Key Gann angles would place support around the **$3,300-$3,320 zone**. 📐
* The current price near **$3,436** is testing natural resistance levels based on Gann square calculations. 📏
### Fibonacci Levels:
From the significant swing low to the current high:
* 23.6% retracement: ~$3,395 📉
* 38.2% retracement: ~$3,370 📉
* 50% retracement: ~$3,345 📉
* 61.8% retracement: ~$3,320 📉
The golden ratio levels suggest key support on any pullback would be around the **$3,370-$3,345 zone**. ✨
### Institutional Levels:
* **Weekly/Monthly Levels:** The **$3,400** and **$3,450** areas appear to be significant institutional levels based on round numbers and previous price action. 🏦💰
* **Smart Money:** The accumulation pattern before the breakout suggests institutional participation. 🧠💡
### Cycle Timing:
Based on the timeframe (appears to be 30-minute bars from May 26-June 15):
* We're seeing approximately **3-week cycles** in the major moves. 🗓️
* The current rally phase appears to be in its mature stage. 🌳
* The next potential cycle turn could be approaching, suggesting caution for new longs at current levels. ⚠️
---
### Trading Considerations:
* Watch for rejection at current levels near **$3,446**. 📉
* Key support confluence around **$3,370-$3,345** for potential re-entry. 🎯
* Volume and momentum divergences would be critical for timing any reversal. 📊🔄
Other indicators tend to show bullish scenario enhancements. 🚀
Gold has formed a ** Standard Bullish Flag pattern ** over a time from early April till today. 🚩🐂
Also, the structure of a ** reverse Head & Shoulders ** is existing and has broken the neckline! 🔄🗣️
Another indicator is an existing "** Ascending Bull Flag **." ⬆️🚩
Please take the time to let me know what you think about this. 💬
-------------------------------------------------------------------------
This is just my personal market idea and not financial advice! 📢 Trading gold and other financial instruments carries risks – only invest what you can afford to lose. Always do your own analysis, use solid risk management, and trade responsibly.
Good luck and safe trading! 🚀📊
Gold could go to 3600A retest of 3435 does not lead to a pullback or reversal. The price is consolidating near the level, which indicates to us that the buyers are stronger in the moment. The fall of the dollar may support gold, leading to an overall rise not only to 3500 but also to 3600
Scenario: in the Pacific or Asian session, gold may try to break the 3435 resistance. Consolidation above this level will lead to growth and a retest of 3495 from which a small pullback (a logical reaction to the resistance level) may occur before continuing to grow in the medium term.
Gold is on a riseHi traders,
Last week gold went exactly as I've said in my previous outlook.
After price came into the bullish 4H FVG it started the next impulse wave 3 (purple) up.
So next week we could see a small correcton down and more upside.
Let's see what price does and react.
Trade idea: Wait for a small correction down on a lower timeframe to finish and trade longs again.
If you want to learn more about trading FVG's & liquidity sweeps with wave analysis, please make sure to follow me.
This shared post is only my point of view on what could be the next move in this pair based on my technical analysis.
Don't be emotional, just trade your plan!
Eduwave
#XAUUSD[GOLD]:At Critical Level, Bullish Swing Is Very LikelyHey There Everyone,
So, gold prices took a bit of a dip, hitting 3250 gold. But guess what? They bounced back like a rubber ball and reached 3332! And here’s the exciting part: they broke through that pesky bearish trend line. This means they’re probably going to retest that line to confirm the trend.
Right now, it looks like they’re at a potential retest point, and that’s where things could get really interesting. If strong bullish volume comes in, the price could skyrocket! There are three possible targets here: 3332, 3362, and 3420.
Now, here’s something important to keep in mind: next week, there are some big news and events coming up that could totally shake things up in the gold market. And let’s not forget about price manipulation. If someone tries to mess with the price, it could drop back to 3250 and then reverse course. So, it’s crucial to have backup plans in case of any unexpected twists.
The US dollar is also going to be all over the place due to upcoming news, which could disrupt the gold market and other currencies. So, it’s best to trade cautiously today and next week. The price can be a bit unpredictable, so take your time to do your own analysis and assess your risk before making any moves.
Good luck and trade safely! We wish you all the best in your trading journey!
Cheers,
Team Setupsfx_
Gold’s in a Trap — And That’s Exactly Why You Should Be CarefulGold is stuck in a tight sideways range. It’s been bouncing between $3,370–$3,380 for two days now. Everyone sees it. Every trader watching gold knows this level acted as support — and judging by the candle shadows, buyers are getting aggressive here.
So if you're purely technical — yeah, looks like a solid buy right now.
But here’s the twist…
___________________________________________________________
I’m not buying.
And I’ll tell you why — because it's too obvious.
When something screams "buy" from every chart and every textbook, that’s when you pause and ask yourself:
“Am I about to walk into a classic setup… or actually catch a real move?”
Because history shows us — these textbook setups often play out like this:
Motivation → Encouragement → Payback. (See Chart 2)
It goes like this:
Price breaks a visible high or low (Motivation)
Traders jump in and get some pips(Encouragement)
Then — brutal reversal (Payback)
Only then will everything get off the ground, and it will be fast, so that the "unnecessary" passengers who were "dropped off" should not have time to return to this train. So why are they "unwanted"? Well, here's one possible answer: because retail tends to hold losing trades too long , but gets spooked early on winners. We’re wired that way.
So what happens when everyone starts booking profits after a small bounce?
You get limit sell orders piling up , slowing momentum — sometimes even flipping the trend.
And then what do big players do?
Then come back in — buying at higher levels, averaging their positions. Not the best case scenario....
Key Takeaway:
______________________
Here’s my advice — especially if you’re in this game long-term:
1. Avoid those super obvious setups everyone else is jumping into.
2. Instead of asking, "Why should I open a trade now?"
Try asking: "Why shouldn’t I open a trade now?"
p.s.
If you liked this kind of deep-dive — follow along. We don’t just read charts. We read the market behind them.
Conclusion:
_________________________
📍 Gold is testing a key zone — but don’t let the crowd pull you in.
🧠 The first quick impulse is often a trap
📈 Stay sharp, stay ahead.
Gold within known rangeTechnical analysis: Descending Channel on Hourly 4 chart was discontinued as there was an attempt on the same chart to develop Ascending Channel and extend the Intra-day’s relief rally above #3,402.80 benchmark. My action plan remains intact as I will continue operating with Scalp Sell and Buying orders as long as #3,362.80 - #3,402.80 zone holds (so far it hasn't been crossed again to the upside or downside) and reversal towards #3,417.80 Resistance in extension if #3,402.80 benchmark gets invalidated. Consider the Lower High’s Upper zone test on the Daily chart’s scale, while Hourly 4 chart turned Bearish on my key indicators sessions ago. As expected, yesterday's session Daily candle closed below the #3,395.80 Resistance, widely above both of the Daily chart’s MA’s, turning flat for the session (isolated within Neutral rectangle however). That is a strong indication that the market is attempting to Price the Bottom here (temporary or not), which just so happens to be a Lower High's Lower zone within Daily chart’s Ascending Channel. It is no surprise that today's Hourly 4 chart’s candle is attempting to engage Bearish sequence so far and since its on Bearish Technicals (invalidated Ascending Channel), I consider it the most optimal re-Buy entry for a Short-term recovery back towards #3,288.80 - #3,392.80 Resistance belt or above (representing last week’s High’s).
My position: Even though I mentioned remaining on sidelines, I used #3,388.80 - #3,392.80 as an excellent re-Buy zone and closed my set of Scalping orders within #3,393.80 - #3,398.80 and remained off for the session. It is indeed clash of Bearish Technicals and War news (Fundamentally Bullish) as I will keep my Trading activity to minimum, protecting my capital for now.
Golden opportunity comes again!Gold fluctuated all day yesterday, and finally did not break the range we gave. Today we continue to focus on the strong support range of 3365-3360, because this position is also the important key support we gave yesterday. Today we continue to look for opportunities to go long when we step back. As long as the strong support position below is not broken, there will be hope for the bulls to make a comeback.
From the current analysis of gold trends, gold continues to focus on the short-term support near 3375-3370 below, and the important support is around 3365-3360. The short-term focus is on the short-term suppression near 3400-3415 above. The operation is temporarily based on the range. There is a high probability that the short-term fluctuations will continue. Wait patiently for the key points to enter the market.
Gold operation strategy: Go long when gold steps back to 3375-3370, and cover long positions when it steps back to 3365-3360. The target is around 3380-3390-3400.
If you still lack direction in gold trading, you might as well try to follow my pace. The strategy is open and transparent, and the execution logic is clear and definite, which may bring new breakthroughs to your trading. The real value does not rely on verbal promises, but is verified by the market and time.
XAUUSD H4 Outlook – CHoCH Confirmed & Discount Pullback in Motio👋 Hey traders!
Here’s your fresh H4 XAUUSD Outlook for June 9, 2025 — real-time structure, sniper zones, and bias clarity, right where price is sitting. Let’s dive in 👇
📍 Bias: Bearish short-term → clean CHoCH & liquidity sweep, targeting discount retracement
🔹 1. 🔍 H4 Structure Summary
CHoCH (Lower) confirmed after recent LH at 3384.
Price failed to reclaim supply → now trading back below the 3350 level.
Multiple internal CHoCHs + bearish OB at 3368 showing clear short-term rejection.
Market is shifting from a bullish continuation into a retracement leg.
🔹 2. 🧭 Key H4 Structure Zones
Zone Type Price Range Structure Notes
🔼 Supply Zone (Flip Trap) 3360 – 3384 Clean CHoCH, FVG, + OB rejection area — major sell trigger
🔽 Mid-Demand Range 3272 – 3252 Retest OB + FVG cluster, ideal reaction zone for possible bounce
🔽 Deep Discount Zone 3174 – 3145 Last major accumulation + bullish origin block
🔹 3. 📐 Price Action Flow
Previous HH → LH → CHoCH confirms internal structure break.
Liquidity swept above LH at 3384, trapping late bulls.
Now targeting equilibrium zone around 3260–3280 as next H4 liquidity base.
🔹 4. 📊 EMA Alignment (5/21/50/100/200)
EMA5 and EMA21 are starting to cross down.
Price has lost momentum above EMA50 → retracement expected into EMA100/200 territory (sub-3280).
Full bullish EMA stack remains — but this is a controlled correction inside trend.
🔹 5. 🧠 RSI + Momentum View
RSI has dropped below 50 → bearish control short-term.
Momentum flow fading after multiple rejection wicks from premium zones.
📌 Scenarios
🔽 Retracement Flow in Progress
Price likely heading to 3272–3252 demand block for reaction
If this zone fails → we open door to 3174–3145 clean swing zone
🔼 Invalidation
Bullish pressure only regains control on break + hold above 3384
Until then: favor selling the supply + letting price reach discount
✅ GoldFxMinds Final Note
We’ve officially shifted into retracement mode on H4. The game now is to either:
Sell retests into supply, or
Wait for clean confirmations at demand for new longs
Let price come to your zone. No emotion — just structure.
💬 Drop your chart view below or ask if you’re unsure where to position next.
Locked in for next move,
— GoldFxMinds 💡
GOLD/USD Bullish Breakout PotentialGOLD/USD Bullish Breakout Potential 🚀📈
🔍 Chart Analysis (June 15, 2025):
The GOLD/USD price action shows strong bullish momentum after a successful breakout above the previous resistance zone (now turned support) around $3,400. This level had previously acted as a key resistance multiple times (evidenced by the price rejection in early June), but has now been flipped into a support zone. The chart highlights two major elements:
📌 Key Highlights:
✅ Support Zone:
The $3,390–$3,410 range is now a confirmed support area after price broke above and retested it. This zone was previously tested multiple times (marked by arrows) and is expected to act as a launchpad for further upside.
🎯 Target Point:
The projected bullish target lies in the $3,610–$3,640 range. This level has been highlighted as a potential area where price might face resistance again.
📈 Bullish Projection:
A bullish continuation is expected if the price remains above the $3,400 level. The chart suggests a possible pullback to support before continuation towards the target zone.
⚠️ Technical Outlook:
As long as price holds above support, the bias remains bullish.
A drop below $3,390 would invalidate this bullish scenario and call for reassessment.
Conservative entry may wait for a confirmed bounce from support.
🔮 Summary:
Bullish bias is active for GOLD/USD with a short-term target around $3,620. Watch the $3,400 support closely for confirmation of the upward momentum.
Expect gold to break 3400 for 3430 post-FedIn recent years, after the U.S. economy was hit by a round of high inflation, inflation data has gradually shown signs of easing 📉. Logically, the weakening inflation pressure should have paved the way for the Federal Reserve (Fed) to cut interest rates, but surprisingly, the Fed has chosen to remain on the sidelines and maintain its high-interest-rate policy ⚖️. The Fed's decision to keep rates high has had a significant impact on gold prices and the U.S. dollar 💱. First, high interest rates typically push up the U.S. dollar exchange rate, thereby dampening gold demand 💰↓.
Gold's price movement this week deviated from market news or expectations 📉≠📢. Driven by geopolitical conflicts, gold rallied on Friday 📈, and the momentum continued to simmer over the weekend, leading to a gap-up opening on Monday followed by a steady decline 📉. On the hourly timeframe, the low points are gradually shifting downward, with 3,400 becoming a short-term resistance level 📊. Although gold fell from 3,452, it is clearly oscillating around 3,380 🔄
I think the Fed's interest rate decision this time may cause gold to directly break through 3400 and reach around 3430 🌟📈
⚡️⚡️⚡️ XAUUSD ⚡️⚡️⚡️
🚀 Buy@ 3380 - 3385
🚀 TP 3400 - 3430
Accurate signals are updated every day 📈 If you encounter any problems during trading, these signals can serve as your reliable guide 🧭 Feel free to refer to them! I sincerely hope they'll be of great help to you 🌟 👇
Gold Supported by Central Bank Demand Despite Global UncertaintyGold Prices Likely Supported by Central Bank Demand
Gold prices are expected to find continued support from strong central bank buying. Since the start of the Ukraine war, average annual central bank gold purchases have doubled from 500 to 1,000 tons.
The primary drivers remain gold’s role as a crisis hedge, portfolio diversifier, and store of value.
While de-dollarization is not an explicit motivation, many central banks anticipate a gradual decline in the U.S. dollar’s share of global reserves.
Technical Outlook:
Gold remains in bullish territory as long as it trades above 3365. This supports a move toward 3403, and if the price stabilizes above that level, the uptrend may extend toward 3430 and 3448.
A break below 3364 would invalidate the bullish structure and shift momentum downward, with potential targets at 3347 and 3322.
Key Levels:
• Resistance: 3403 / 3430 / 3448
• Support: 3365 / 3347 / 3322
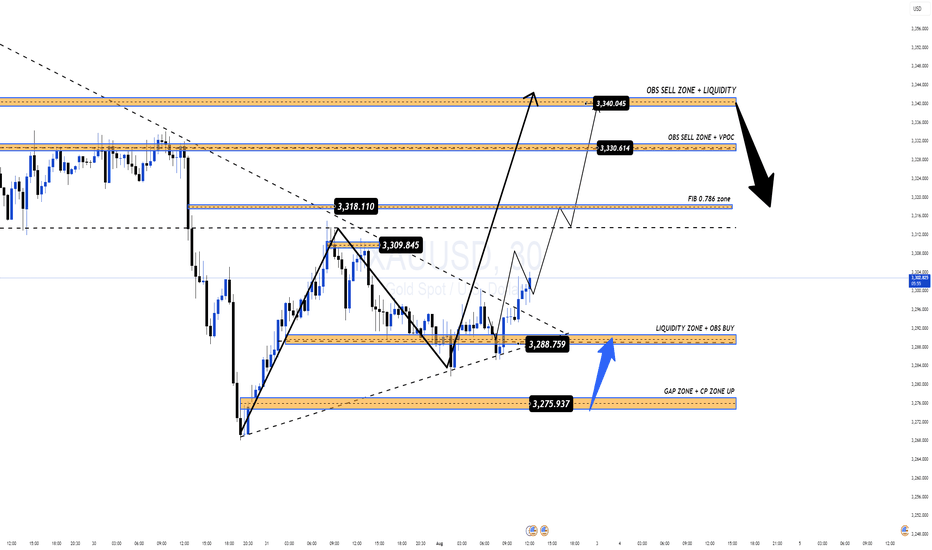
XAUUSD:[GOLD]: First Drop And Then Reverse! Comment Your Views! Gold touched $3350 but was rejected at that level, dropping around 3288. The price shows some minor support at this region, which we’re currently monitoring. If it breaks through, it could touch our buying zone, reversing the trend. You can set three targets based on your own analysis and bias. Please use accurate risk management while trading.
If you’d like to contribute, here are a few ways you can assist us:
- Like our ideas
- Comment on our ideas
- Share our ideas
Team Setupsfx_🚀❤️