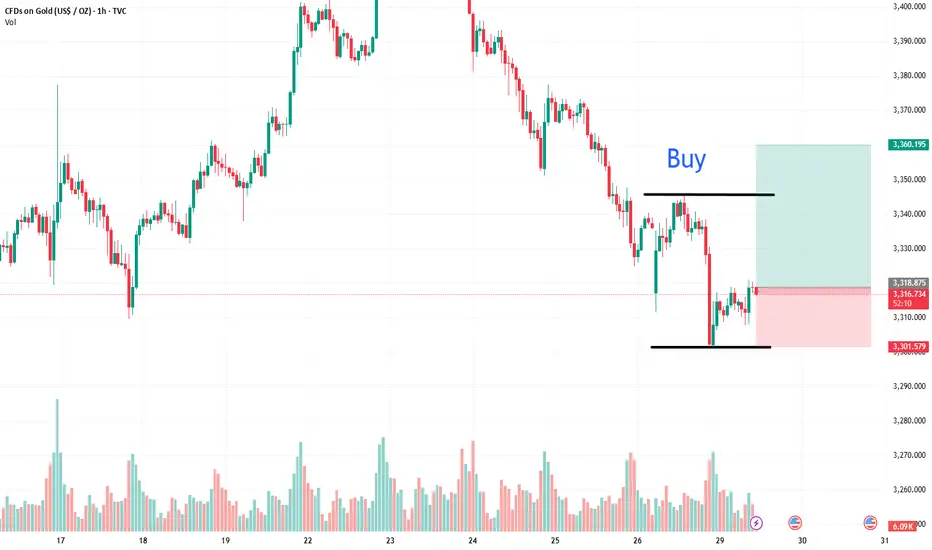
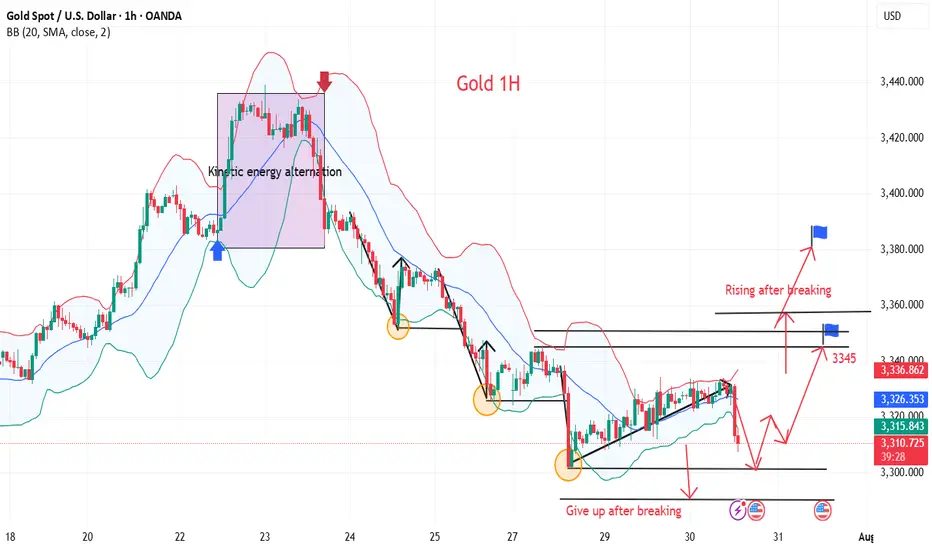
7.29 Gold 1-hour bottom signal appearsIn the short term, we see the daily line as the range of 3301-3345, and the current price is showing a volatile rebound, so we have to buy on dips. Then 3306-08 is the long point, but the price has risen in the morning, so the long position should be around 3310-12 in advance. If it falls below 3301 during the day, it will continue to test the 3292-3282 line downward. Similarly, if it breaks above 3345 during the day, it will continue to test 3372 upward and show a rebound trend in the next few days.
GOLDCFD trade ideas
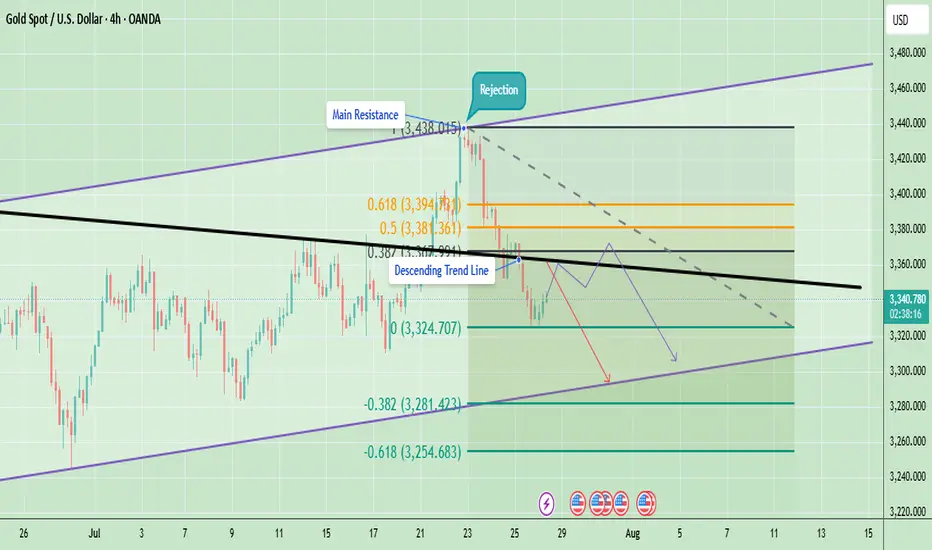
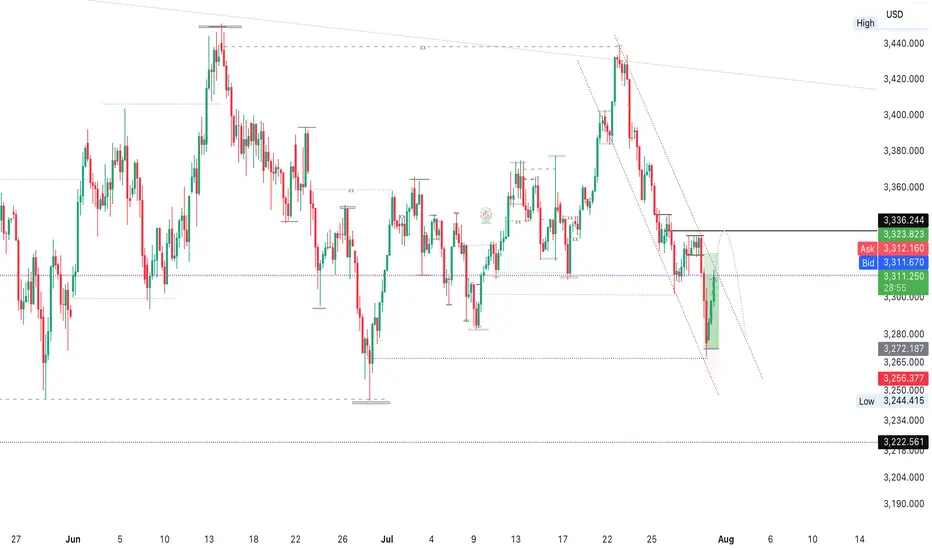
Technical Analysis - Gold Rejected at ResistanceGold is currently trading around $3,341 after facing a strong rejection from the $3,438 resistance area. This rejection coincided with the upper boundary of the trend channel and the main resistance zone, which also aligns with the Fibonacci 0.5–0.618 retracement levels. After the rejection, price fell below the descending trendline, indicating that short-term sellers have taken control.
On the downside, the immediate support sits at $3,324, which has acted as a short-term bounce level. A break below this could push gold lower toward $3,281 and potentially $3,254, which are key Fibonacci extension support levels. On the upside, the immediate hurdle is at $3,355–$3,360 (descending trendline). A breakout above this area will be critical for any bullish recovery attempt toward $3,381–$3,394 and eventually $3,420–$3,438.
At the moment, the short-term trend remains bearish because gold is trading below the descending resistance and showing lower highs. However, as long as gold holds above the $3,254 support zone, the medium-term structure remains neutral to bullish, giving bulls a chance if momentum shifts again.
Last week candle is pin bar bearish candle which is showing bearish momentum at the moment. The candle shows rejection near $3,400–$3,450, aligning with the triangle’s upper resistance trendline. If gold cannot reclaim and hold above last week’s high, price may drift lower to retest support zones around $3,248–$3,150 before another breakout attempt.
Note
Please risk management in trading is a Key so use your money accordingly. If you like the idea then please like and boost. Thank you and Good Luck!
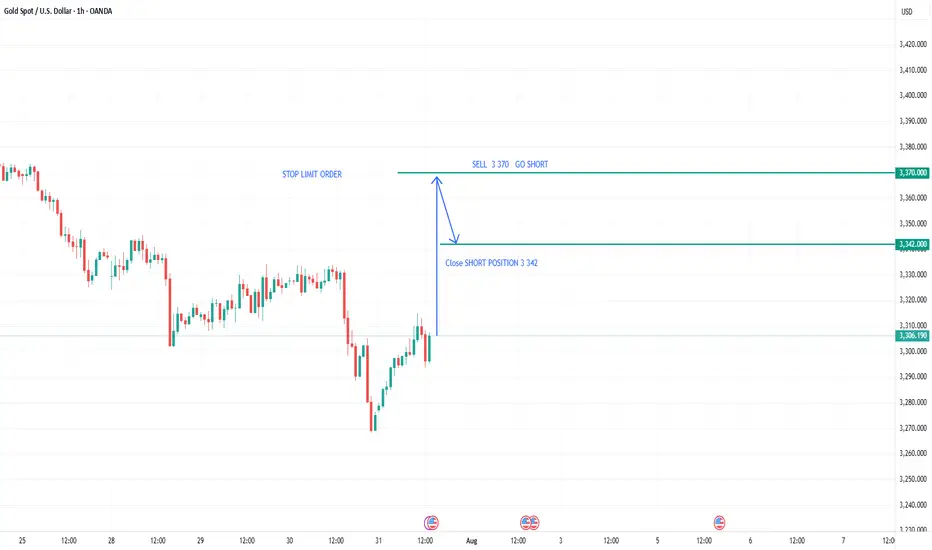
My plan for GoldShould we plan for a 600 pip profit on gold this week? I suggest you check the chart after withdrawing the liquidity shown.

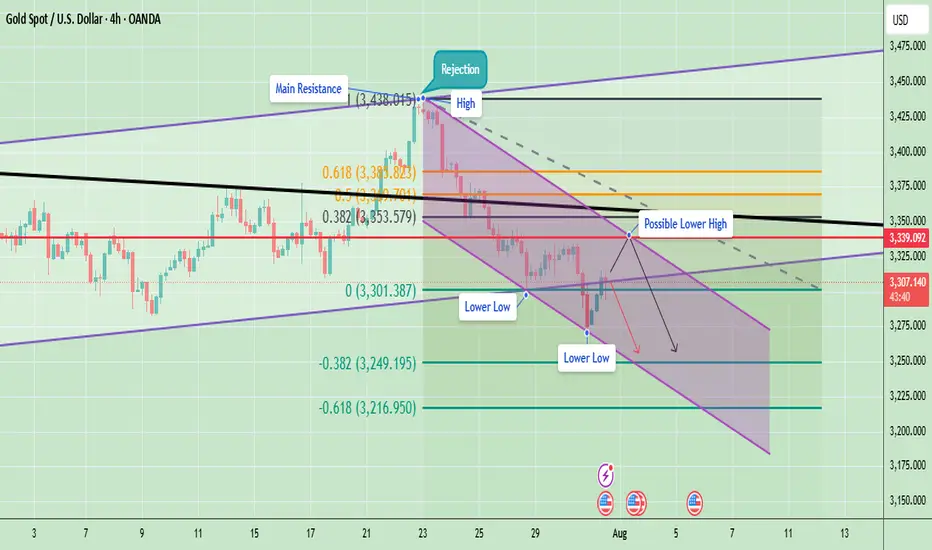
Gold Struggles at Resistance – Indicates Lower Lows AheadGold has been in a clear downtrend after facing a strong rejection around the 3,438 level (main resistance zone). Price is currently moving within a descending channel, confirming the formation of lower highs and lower lows – a classic bearish market structure.
Currently, Gold is trading near 3,306, facing resistance at 3,339 (marked as a possible lower high). If price fails to break above this level and sustain, there is a strong probability of continuation towards 3,249 and even 3,216.
Key Technical Highlights
- Immediate Resistance: 3,339 – 3,353
- Support Levels: 3,301 (short-term), 3,249, and 3,216
A rejection near 3,339 can lead to another leg down targeting 3,249 and 3,216. However, a strong breakout above 3,339–3,353 could temporarily shift momentum towards 3,394.
Note
Please risk management in trading is a Key so use your money accordingly. If you like the idea then please like and boost. Thank you and Good Luck!
GOLD Continuation and ReversalIt still needs one more fall
Sell from 3348 to 3312
Buy from 3312 to 3392
GG

The idea of shorting on rallies below 3315 remains unchanged.Gold remains generally weak, with multiple rebounds showing signs of fatigue. The upward moving average continues to suppress prices, indicating that the bearish trend remains intact, and the short-term market outlook remains bearish. Trading strategies remain bearish today, with a key focus on the 3300-3315 area, a key short-term resistance zone. If the market rebounds before the US market opens and approaches this area, or if a clear topping signal appears near this range, consider entering a short position. Today will see the release of the non-farm payroll data, which may influence the market's trajectory. We recommend prioritizing short-term trading before the release, and reconsidering the market's direction based on market feedback after the release. Structurally, gold continues to exhibit a volatile downward trend, with lower highs and lower lows. Today's low is expected to be lower than yesterday's. Short-term short positions are focused on 3285-3280, with a break below this level potentially allowing for further declines. Please carefully time your entry, strictly implement risk management, and avoid emotional trading.
XAUUSD ANNASIS OUTLOOK BULLISH 1/8/2025 XAUUSD – Trade in Progress
Long from $3,295 – targetting $3,355 / $3,365
+600+ pips potential on extended breakout
Bulls gaining strength above $3,300
Holding with confidence – structure supports it
#XAUUSD #GoldTrade #LiveSetup #TargetPending

60MIN trade Fibonacci extension trade. Return to Objective Point(1,00) after reaching Expanded Objective Point (1,618)
Impact of the Non-Farm Payrolls? Latest Analysis.Information Summary:
Most traders are turning their attention to the crucial US labor market report, which is being closely watched as the market actively searches for new clues regarding the timing of the next interest rate cut this year.
The July non-farm payrolls report will be released at 8:30 AM US time. US non-farm payrolls increased by 110,000 in July, seasonally adjusted, lower than the 147,000 increase in June. The US unemployment rate is expected to rise from 4.1% to 4.2% in July.
If the non-farm payrolls figure falls below 100,000 and the unemployment rate rises, it could signal a weakening job market, undermining the Fed's rekindled hawkish outlook and dampening the dollar's upward momentum. In this scenario, gold prices could re-cross the 3,400 mark. However, if the non-farm payrolls unexpectedly exceed 150,000, it could support the dollar's continued rise and hurt gold. Strong US employment data could rule out two rate cuts from the Fed this year.
Market Analysis:
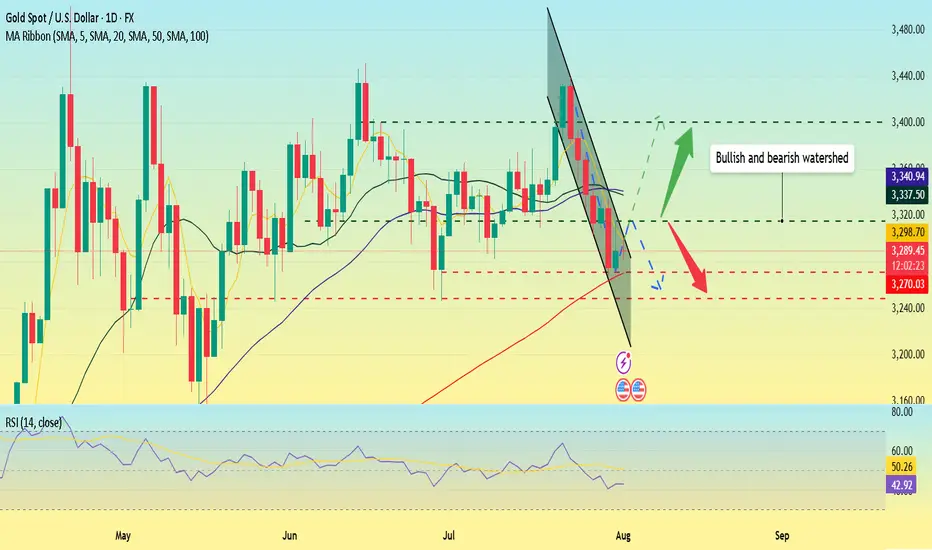
Quaid believes that the current moving average crossover is trending downward, and downward momentum is still in play. The RSI remains at 42.7, hovering below the midline, indicating that gold's downward trend remains intact. The 20-day moving average fell below the 50-day moving average on Wednesday, confirming the bearish momentum.
Therefore, if gold closes below the key support level of the 100-day moving average at $3,270 on a weekly basis, a new downtrend could begin, potentially leading to a drop towards the June 30 low of $3,248.
Quaid believes that the current bull-bear watershed needs to focus on around 3315, which is the previous intensive trading area and is also the first resistance position for short-term upward movement.
On the last trading day of Super Data Week, Quaid hopes that everyone has gained something and has a happy weekend; I wish you all good luck.
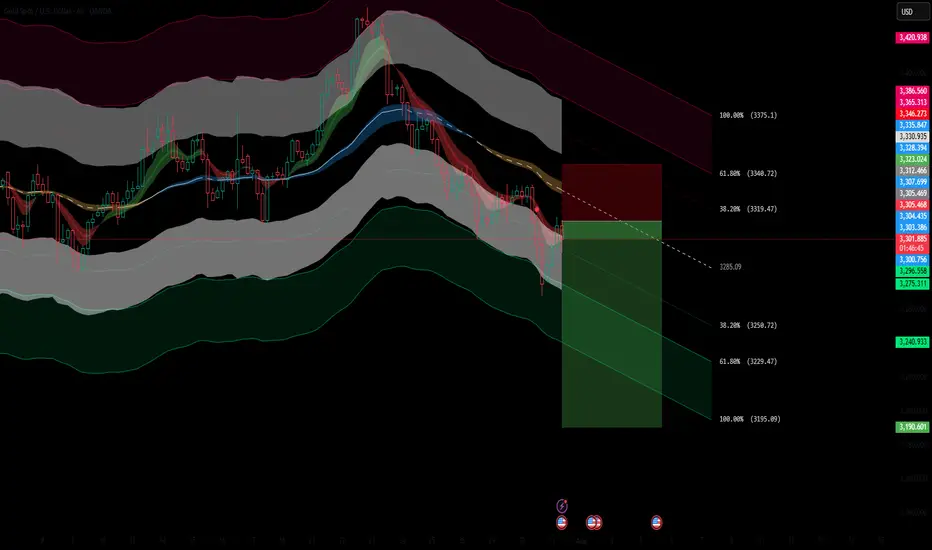
XAUUSD 4H AnalysisGold is currently in a clear downtrend after failing to hold above the mid-channel. Price is retracing into a potential short zone with confluence from the moving average bands.
Fibonacci Retracement: Price is reacting near the 38.2% level (3,318).
Downside Fibonacci Targets:
1️⃣ 3,249.36 (38.2%)
2️⃣ 3,228.11 (61.8%)
3️⃣ 3,193.73 (100%)
As long as the price stays below the red resistance zone, the bearish momentum is likely to continue toward the lower Fibonacci targets. A break above 3,339 would invalidate the short setup.
XAUUSD – Weak recovery, selling pressure still dominatesHello everyone! What do you think – is it time to buy or sell gold?
After clearly breaking the ascending trendline late last week, gold made a slight rebound from the 3,325 zone. However, in my view, this bounce was relatively weak and mostly technical in nature.
Currently, price is retesting a key confluence area around 3,345–3,355, which includes the previous trendline and a nearby resistance zone.
If we see a clear rejection candle form at this level, there's a high chance the price may reverse and continue its downward trend. The short-term target I’m watching is 3,300 USD – and if that level doesn’t hold, we could see stronger reactions near 3,283.
According to the VRVP indicator, volume is concentrated around lower price levels, suggesting that liquidity is still sitting near previous lows. Structurally, the market continues to form lower highs and lower lows, and with the EMA sloping downward, my primary bias remains to SELL on rallies within the trend.
The golden direction in the volatile trend
💡Message Strategy
The market is currently in a wait-and-see phase ahead of major fundamental events. With the Federal Reserve's interest rate decision and key data such as second-quarter GDP and the core PCE price index set to be released, traders are generally cautious. Gold has stabilized slightly after a series of declines, but a meaningful reversal has yet to materialize. The divergence between bulls and bears is intensifying, and the market is on the verge of a breakout. This week's gold market is driven by uncertainty surrounding macroeconomic expectations and the Fed's monetary policy.
After four consecutive trading days of gains, the US dollar index has slowed its gains, temporarily retreating to around 99. Traders are still betting on a September Fed rate cut, with the market placing a 64% probability on a September rate cut. However, this week's release of Q2 GDP and the core PCE price index data will significantly impact this outlook.
If GDP and inflation data are weak, this will reinforce market expectations of easing and potentially attract renewed buying for gold. Conversely, strong data could dampen expectations of a rate cut, supporting a stronger dollar and putting pressure on gold.
Furthermore, the Federal Reserve is about to hold its interest rate meeting. While it's almost certain that interest rates will remain unchanged, Powell's speech will be a key focus for the market. Any signals regarding internal disagreements, adjustments to the inflation path, or adjustments to the policy framework could trigger significant market volatility. From a global perspective, geopolitical risks have been relatively stable recently, providing no sudden support for gold.
📊Technical aspects
Gold is showing signs of a short-term rebound, but the technical structure still indicates a weak rebound, with no confirmed trend reversal. A break above 3350 would be considered a temporary stabilization, while a break below 3300 would reopen the downside. Current market sentiment is in a "wait for a signal" phase.
Gold currently has limited downward space, and data factors are accelerating this week. Gold is likely to undergo a long-short conversion, so our trading strategy uses a small stop loss to counter the larger space for gold's shape conversion.
💰Strategy Package
Long Position:3290-3305,SL:3280,Target: 3340-3360
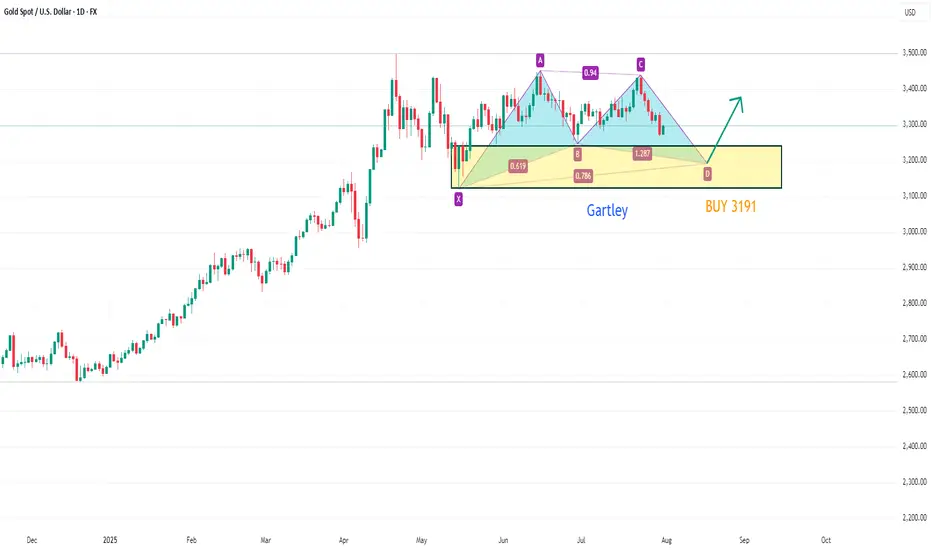
XAUUSD eyes potential Gartley patternOn the daily chart, XAUUSD has retreated from its highs, and short-term bears have the upper hand. Currently, we can pay attention to the area below 3191, which is a potential buy level for a bullish Gartley pattern and is within the previous demand zone.
XAUUSD - market structureXAUUSD - market structure, XAUUSD - market structure , use risk and trade managment, this is not FULL analysis

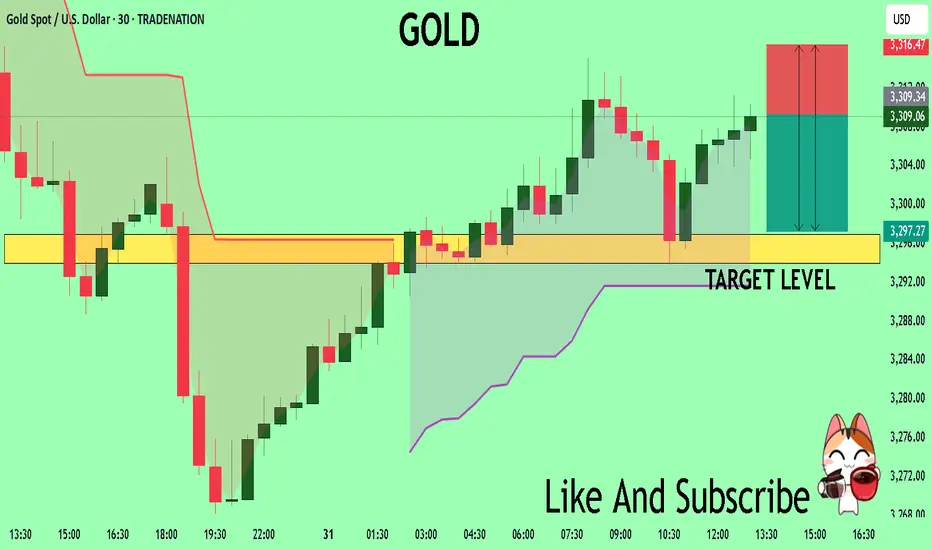
GOLD Buyers In Panic! SELL!
My dear friends,
Please, find my technical outlook for GOLD below:
The instrument tests an important psychological level 3309.2
Technical Indicators: Supper Trend gives a precise Bearish signal, while Pivot Point HL predicts price changes and potential reversals in the market.
Target - 3296.9
Recommended Stop Loss - 3316.4
About Used Indicators:
Super-trend indicator is more useful in trending markets where there are clear uptrends and downtrends in price.
Disclosure: I am part of Trade Nation's Influencer program and receive a monthly fee for using their TradingView charts in my analysis.
———————————
WISH YOU ALL LUCK
XAUUSD Intraday Technical Analysis – Bullish Breakout SetupGold (XAUUSD) is showing signs of bullish recovery after a sharp sell-off, with current price action around 3305.86 USD hinting at a potential breakout on the 1-hour timeframe.
- Technical Overview
Price structure: After a steep decline, gold formed a base near the 3284–3299 zone and is now climbing back, with a potential inverse head-and-shoulders formation taking shape.
EMA cluster: Price is approaching the confluence of the EMA 50, EMA 100, and EMA 200, currently acting as dynamic resistance around 3309–3323. A break above these levels may confirm bullish strength.
Fibonacci retracement: The bounce appears from the 0.874 extension, indicating the end of the previous bearish leg.
Volume analysis: Increasing bullish volume supports the idea of a potential breakout.
- Key Levels to Watch
Zone Type
Price Level (USD)
Remarks
Immediate Resistance: 3,309 – 3,323 - Major test zone; overlaps with EMA 50/100
Major Resistance : 3,337 – 3,340 - Previous high; if broken confirms bullish continuation
Support Zone: 3,299 – 3,302 - Intraday support turned demand zone
Critical Support: 3,284 – 3,285 - Recent swing low; invalidates bullish view if broken
- Intraday Strategy Suggestion
Scenario 1 – Bullish Breakout
Entry: Buy on breakout and retest of 3,309–3,323
SL: Below 3,299
TP1: 3,337
TP2: 3,355
- Confirmation by strong bullish candle closing above EMA cluster and above resistance zone.
Scenario 2 – Buy on Pullback
Entry: Buy limit at 3,300–3,302
SL: Below 3,284
TP1: 3,323
TP2: 3,337
- Look for RSI divergence or bullish engulfing candle at support for higher conviction.
- Final Note
The bulls are attempting to reclaim momentum after a major correction. If gold can sustain above the 3,309 resistance and hold the 3,300 base, a short-term bullish reversal could materialize.

Gold’s Liquidity Hunt Eyes on Bullish FVG Reaction!Gold Analysis – NY Session Outlook
During the New York session, gold created equal highs near recent swing highs, indicating that upside liquidity remains uncollected. Currently, the market is pulling back, targeting liquidity resting below the trendline, along with internal liquidity levels beneath.
If gold continues to move downward and taps into the marked bullish Fair Value Gap (FVG), monitor that zone for any signs of bullish confirmation. If confirmed, there is potential for a further upward move toward the equal highs and beyond, aiming for external liquidity.
Always Do Your Own Research (DYOR).

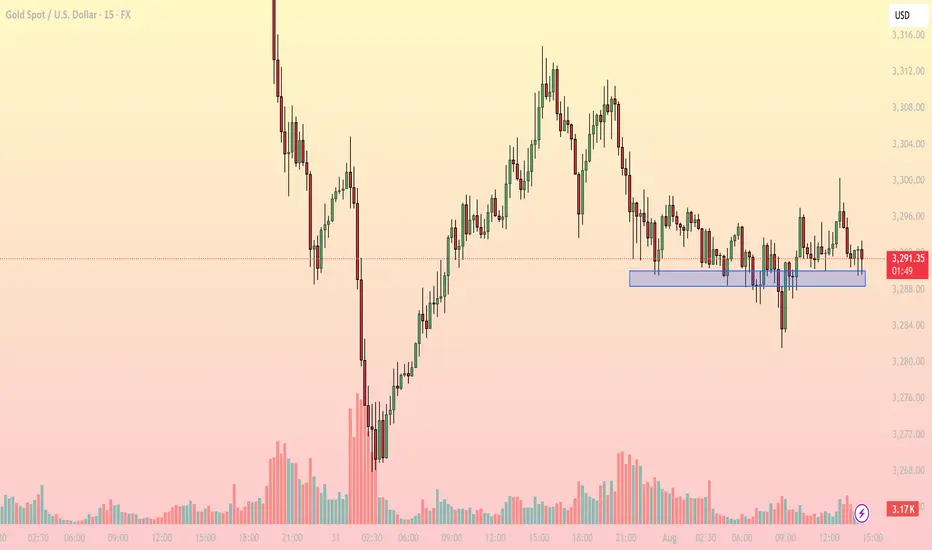
Gold consolidates near key support – What's next for?1. Market Overview
On the 15-minute chart, XAUUSD is trading around 3,290–3,292 USD, hovering just above a critical intraday support zone at 3,287–3,289 USD (highlighted in blue). This area has repeatedly provided a bounce in recent sessions, indicating persistent buying interest.
The current price action reflects sideways movement within a narrow range (3,287–3,296 USD), and notably, declining volatility, as shown by reduced candle range and trading volume.
2. Technical Breakdown
EMA: Price is moving around the EMA20 and EMA50, reflecting indecision and lack of directional momentum.
RSI (inferred): Likely hovering near the neutral 50–55 zone, confirming a balanced market.
Trendline: A descending series of lower highs from the 3,312 peak suggests bearish pressure, though buyers still defend key support.
Fibonacci: The 3,287 USD zone aligns with the 61.8% Fibonacci retracement level, reinforcing its strength as a bounce area.
3. Key Levels to Watch
3,287–3,289: Support - Repeated reactions here – key demand zone
3,296: Immediate resistance - Needs breakout to confirm bullish move
3,302: Next resistance - Breakout target – short-term top
3,275: Deeper support - Retest level if support breaks
4. Trading Strategy Scenarios
🔹 Scenario 1 – Long setup at support
Entry: 3,287–3,289 (wait for bullish reaction like pin bar or engulfing)
Stop Loss: Below 3,284
TP1: 3,296 | TP2: 3,302
🔹 Scenario 2 – Short setup on breakdown
Entry: Below 3,284 (after clear bearish candle close)
Stop Loss: 3,288
TP1: 3,275 | TP2: 3,268
5. Conclusion
Gold is in a tug-of-war at a sensitive support zone. Whether bulls defend or bears break below will set the tone for the rest of the session. Focus on price reaction around 3,287 to determine direction – avoid blind predictions.
Make sure to follow for more live strategies as the New York session unfolds – and save this post if you find it helpful!
What’s your view on this support zone? Let’s discuss below!
Gold Market Eyes Daily Demand Zones at 3270–3315Gold market aligns with daily candle formation, seeking to mitigate substantial demand zones between 3270 and 3315. This area may provide the necessary liquidity for a potential bullish reaction, pending confirmation. follow for more insights , comment and boost idea
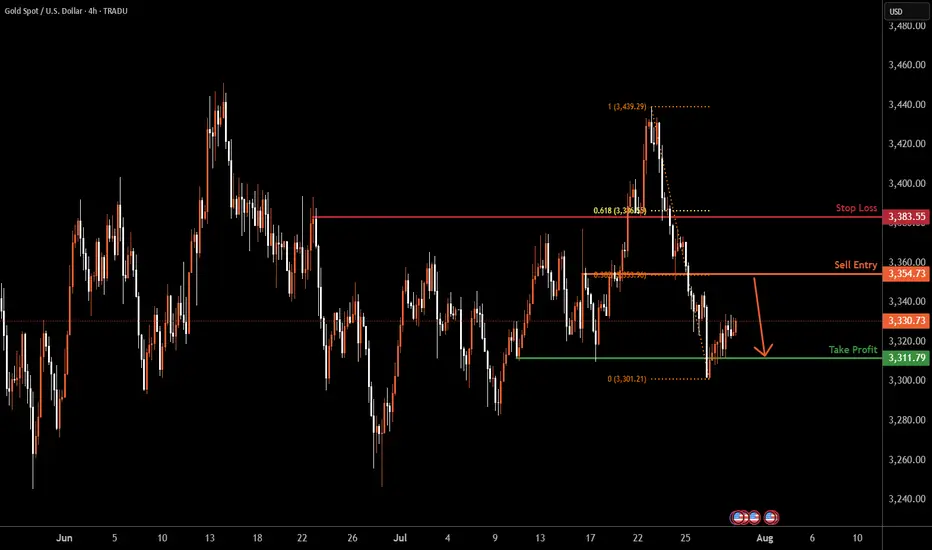
XAUUSD H4 | Heading into pullback resistanceBased on the H4 chart analysis, the price is rising towards the sell entry, which is a pullback resistance that lines up with the 38.2% Fibonacci retracement and could drop to the take profit.
Sell entry is at 3,354.73, which is a pullback resistance that aligns with the 38.2% Fibonacci retracement.
Stop loss is at 3,383.55, which is a pullback resistance that is slightly below the 61.8% Fibonacci retracement.
Take profit is at 3,311.79, which is a multi-swing low support.
High Risk Investment Warning
Trading Forex/CFDs on margin carries a high level of risk and may not be suitable for all investors. Leverage can work against you.
Stratos Markets Limited (tradu.com ):
CFDs are complex instruments and come with a high risk of losing money rapidly due to leverage. 65% of retail investor accounts lose money when trading CFDs with this provider. You should consider whether you understand how CFDs work and whether you can afford to take the high risk of losing your money.
Stratos Europe Ltd (tradu.com ):
CFDs are complex instruments and come with a high risk of losing money rapidly due to leverage. 66% of retail investor accounts lose money when trading CFDs with this provider. You should consider whether you understand how CFDs work and whether you can afford to take the high risk of losing your money.
Stratos Global LLC (tradu.com ):
Losses can exceed deposits.
Please be advised that the information presented on TradingView is provided to Tradu (‘Company’, ‘we’) by a third-party provider (‘TFA Global Pte Ltd’). Please be reminded that you are solely responsible for the trading decisions on your account. There is a very high degree of risk involved in trading. Any information and/or content is intended entirely for research, educational and informational purposes only and does not constitute investment or consultation advice or investment strategy. The information is not tailored to the investment needs of any specific person and therefore does not involve a consideration of any of the investment objectives, financial situation or needs of any viewer that may receive it. Kindly also note that past performance is not a reliable indicator of future results. Actual results may differ materially from those anticipated in forward-looking or past performance statements. We assume no liability as to the accuracy or completeness of any of the information and/or content provided herein and the Company cannot be held responsible for any omission, mistake nor for any loss or damage including without limitation to any loss of profit which may arise from reliance on any information supplied by TFA Global Pte Ltd.
The speaker(s) is neither an employee, agent nor representative of Tradu and is therefore acting independently. The opinions given are their own, constitute general market commentary, and do not constitute the opinion or advice of Tradu or any form of personal or investment advice. Tradu neither endorses nor guarantees offerings of third-party speakers, nor is Tradu responsible for the content, veracity or opinions of third-party speakers, presenters or participants.
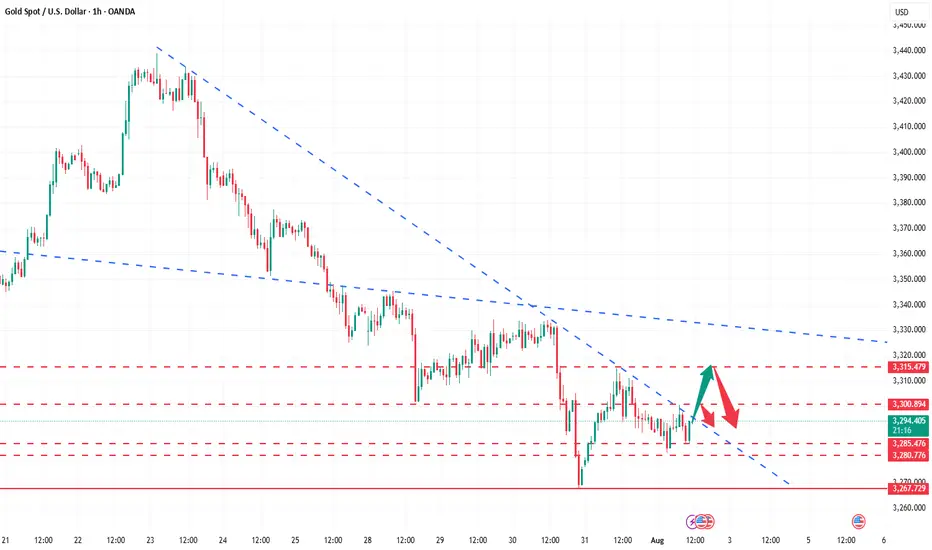
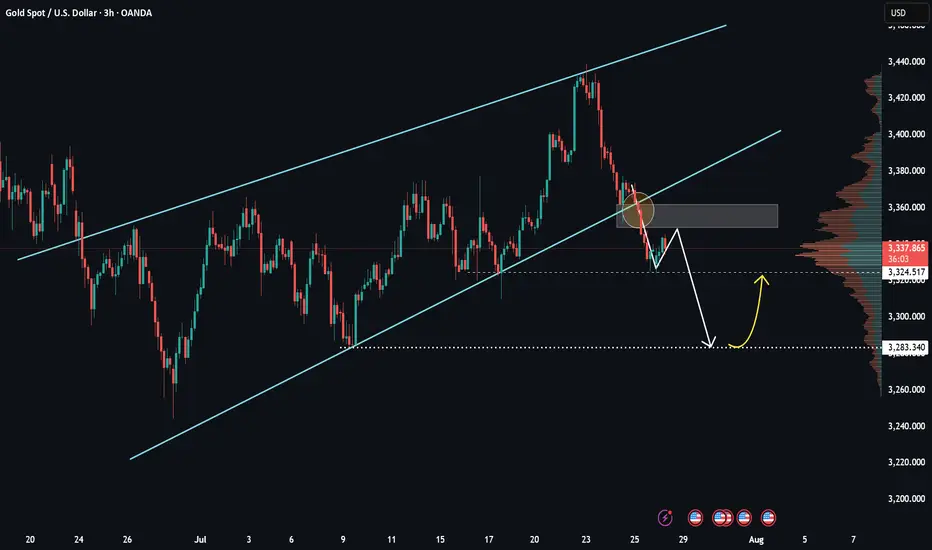
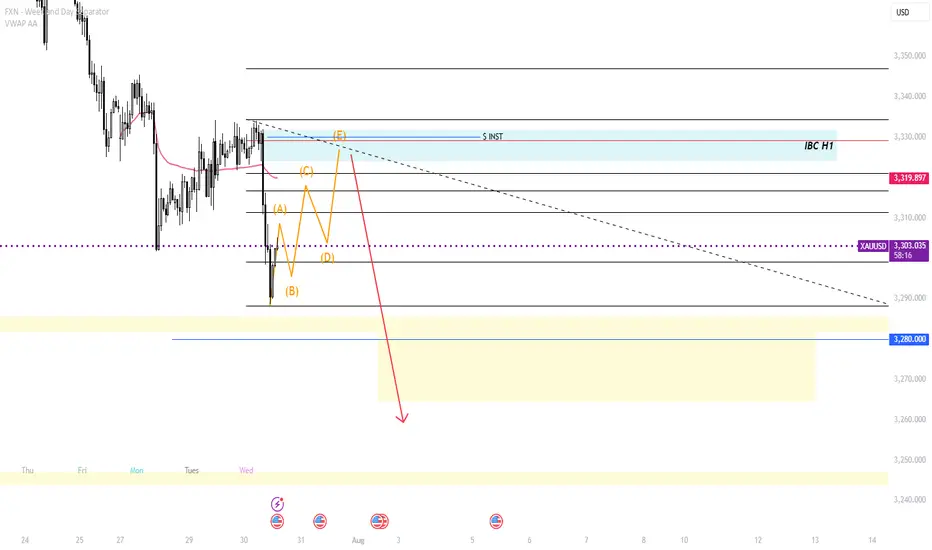
GOLD: Bottoming Out or Just the Calm Before the Storm? – GOLD: Bottoming Out or Just the Calm Before the Storm?
Gold has dropped nearly $50 over the last 4 sessions, showing clear bearish momentum. But is this just a liquidity grab before a reversal — or are we simply pausing before another leg down?
🔍 Market Context:
Recent US–EU defence and trade agreements may have weakened gold’s short-term appeal as a safe haven.
The US dollar and equities have both gained on strong macroeconomic data, redirecting capital flows away from metals.
Overall market sentiment has tilted risk-on, putting additional pressure on gold prices.
📊 Technical Overview (12H Chart):
Price has broken below the 3342 key support zone and rejected the retest — turning it into short-term resistance.
Current range sits between:
Sell-side liquidity zone: 3301–3292
Major demand/FVG zone: 3272–3270
Above price:
Resistance at 3342, and a broader sell zone at 3370–3388 (OB + FVG + Fib 0.5–0.618)
🔧 Trade Plan (Reaction-Based — Not Predictive):
🟢 Scenario 1 – Buy (Scalp Reaction)
Entry: 3292 – 3290
Stop Loss: 3285
Targets: 3296 → 3300 → 3305 → 3310 → 3315 → 3320 → 3325 → 3330
📍 Intraday bounce play from a high-liquidity zone
🟢 Scenario 2 – Buy (Deeper Reversal Swing)
Entry: 3272 – 3270
Stop Loss: 3265
Targets: 3276 → 3280 → 3284 → 3288 → 3292 → 3294 → 3300 → Trail
📍 Potential mid-term bottom setup if liquidity is fully swept
🔴 Scenario 3 – Sell (Short-Term Rejection)
Entry: 3340 – 3342
Stop Loss: 3346
Targets: 3335 → 3330 → 3325 → 3320 → 3310
📍 Clean rejection setup if price fails to reclaim key resistance
🔴 Scenario 4 – Sell (Higher Supply Zone)
Entry: 3370 – 3372
Stop Loss: 3376
Targets: 3365 → 3360 → 3355 → 3350 → 3345 → 3340 → 3330 → 3320
⚠️ Higher risk; only valid with strong confirmation
⚠️ Risk Notes:
Be mindful of fakeouts around London and NY opens, as liquidity sweeps are common.
Wait for price to enter your zone, then react — don’t anticipate.
Strict risk management is key in a volatile environment like this.
🧭 I’ll continue monitoring how price reacts around these zones.
If this kind of structured planning resonates with your approach,
feel free to stay connected — or share your perspective in the comments.

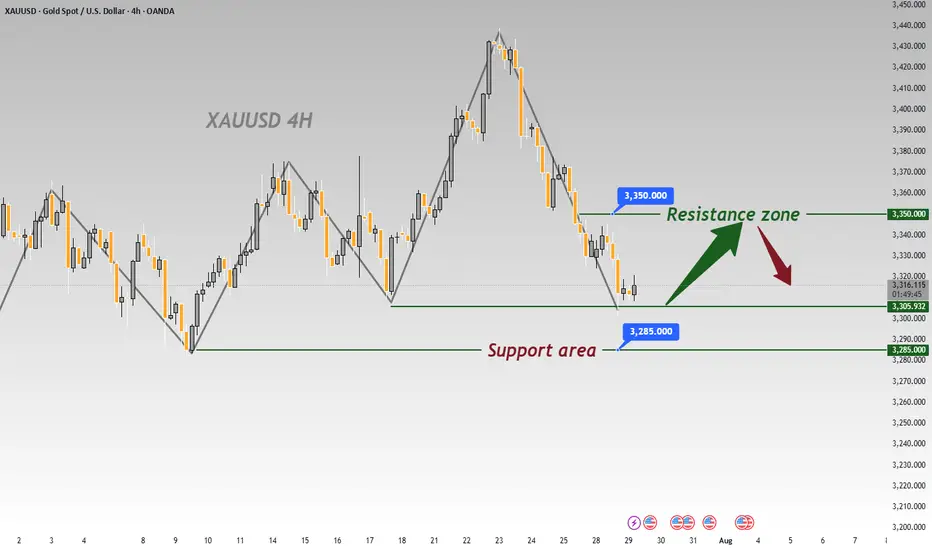
Gold: This Week's Analysis & StrategyThis week, the fluctuations have clearly moderated📉. Focus on a strategy of buying at lows and selling at highs as much as possible📈. Currently, the resistance around 3350 is prominent🚧, and 3300 acts as support below🛡️. If the decline continues, it may reach around 3285👇
We successfully took short positions last week 📉, and this week I recommend going long at lower levels 📈. Over the long term, gold remains in a bull market 🐂, but it will not repeat the frenzy seen in April; instead, it will maintain a steady upward pace ⬆️.
Market expectations for Fed rate cuts have been volatile so far this year 📊. At the start of the year, as Trump-related developments unfolded, market optimism faded 😐. Meanwhile, the de-dollarization trend fueled growing expectations of Fed rate cuts 💹. By early April, Trump’s reciprocal tariff measures—far more aggressive than expected—roiled global financial markets 🌍, triggering a surge in concerns about a U.S. recession ⚠️. Markets thus anticipated that the Fed would cut rates quickly to shore up the economy, with expectations for rate cuts within the year once exceeding 100 basis points 📉. However, shortly after, Trump announced a 90-day extension of the reciprocal tariffs, easing market pessimism 😌 and driving a strong rebound in U.S. stocks 📈. At this point, markets began worrying that his tariff policies could spark an inflation rebound 🔥, leading to a steady decline in rate cut expectations—currently, expectations for rate cuts this year have dropped to fewer than two 🔄.
Risk Warning ⚠️
Event Sensitivity: Outcomes of China-U.S. trade talks 🤝, the Fed’s statements , and nonfarm payroll data 📊 may trigger one-sided volatility. Positions should be adjusted promptly to avoid risks 🛡️
⚡️⚡️⚡️ XAUUSD ⚡️⚡️⚡️
🚀 Buy@ 3300 -3310
🚀 TP 3320 - 3330 - 3340
🚀 Sell@ 3350 -3340
🚀 TP 3330 - 3320 - 3310
Daily updates bring you precise trading signals 📊 When you hit a snag in trading, these signals stand as your trustworthy compass 🧭 Don’t hesitate to take a look—sincerely hoping they’ll be a huge help to you 🌟 👇