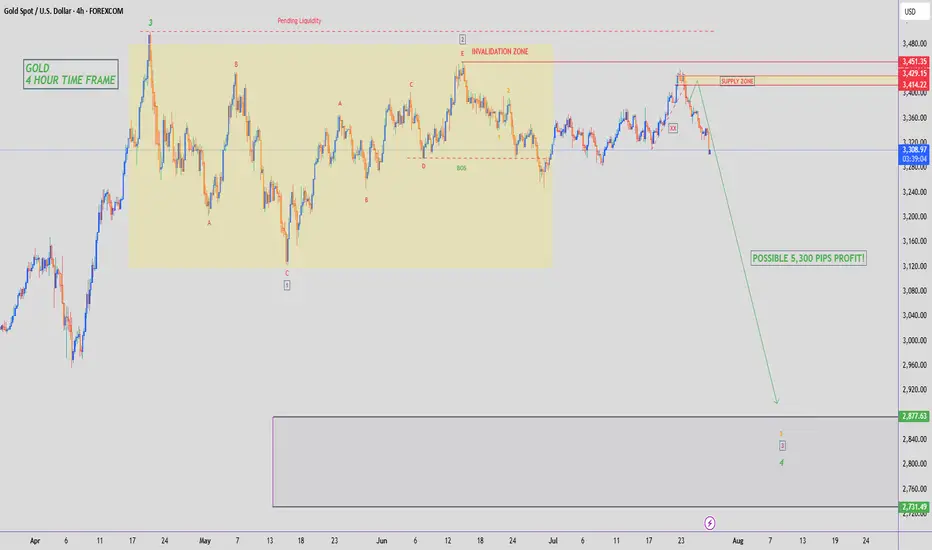
Gold prices are about to rebound?Gold prices are about to rebound?
Just on Saturday, Trump patted Powell on the shoulder, and those who understand understand.
Cut interest rates quickly!!!
Next week will usher in three major news, and global analysts regard next week as a life-or-death moment that determines the future direction of gold prices.
1: Will the Fed cut interest rates in September?
2: How will the tariff war on August 1 evolve?
3: Major non-agricultural data
The trend of gold prices next week is unpredictable, and every day is accompanied by the impact of policy news.
Volatility will become more and more stimulating.
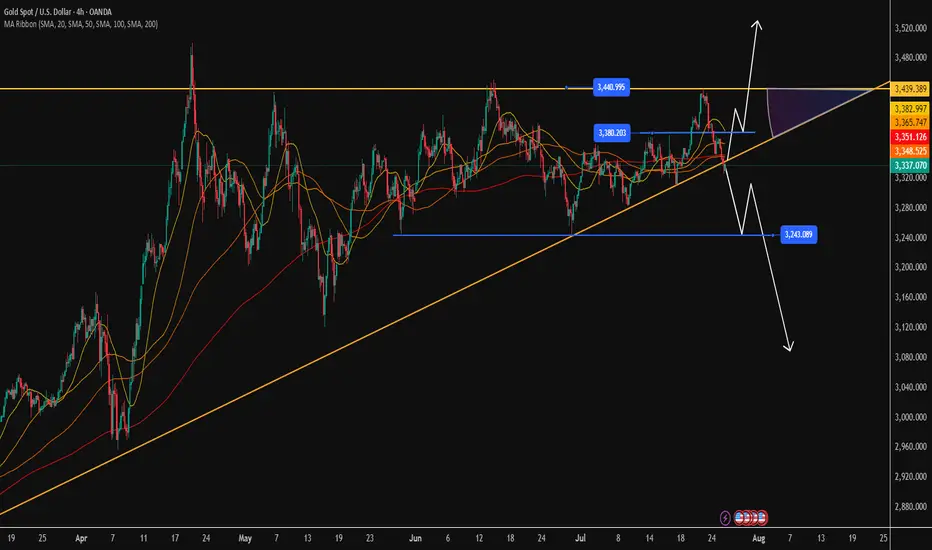
Technical aspect: Gold prices have completed the correction, and I think the bulls are about to counterattack.
As shown in Figure 4h
3330 is an important support level
3440 is a key top area
3360-3380 is a key middle pressure level
We will continue to adopt a low-price long strategy on Monday
Target: 3365-3380-3400-3440-3500+
I firmly believe that next week will be the beginning of a big bull market. Even if it is not, this should be the last chance for bulls to get off the train.
Short-term: $3380-3400 (this week's high resistance).
Medium-term: If it breaks through $3400, it will open the channel to $3500.
Gold operation strategy
Aggressive investors: Buy at the low point of the $3300-3330 range, with a target price of $3380.
Conservative investors: Wait for a breakthrough of $3360 before chasing more, and set the stop loss below 3300.
Conclusion: Gold prices are expected to rebound next week, and the expectation of a rate cut by the Federal Reserve is the core driving force.
Investors are advised to pay attention to non-agricultural data and geopolitical situation, and seize the opportunity to layout at low levels.
GOLDCFD trade ideas
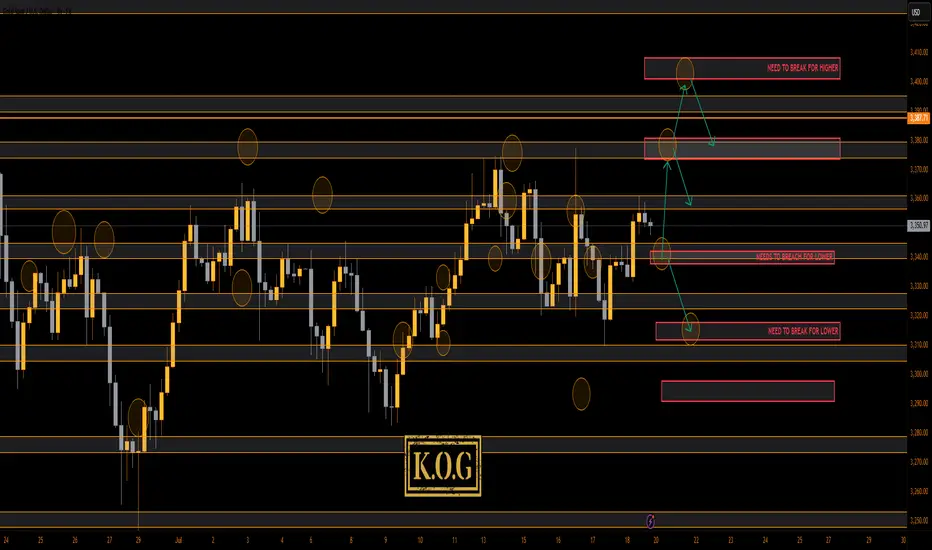
THE KOG REPORT THE KOG REPORT:
In last week’s KOG Report we said we would be looking for a price to attempt the higher level red box sitting around the 3370-75 region and if not breached, we felt an opportunity to short would be available from that region. We said if that failed and the move commenced, we would be looking at a complete correction of the move back down into the 3330-35 region, where we would then monitor price again in anticipation of a long from there or the extension level of 3310 which was also a red box short target (move complete). As you can see from the above, not only did we get that higher red box, we rejected, completed the move downside and then our traders managed to get that long trade all the way back up into the Excalibur target, red box targets and the hotspots shared in Camelot.
A decent week again, not only on Gold but also the numerous other pairs we trade, share targets on and analyse.
So, what can we expect in the week ahead?
For this week we can expect more ranging price action, but due to the previous range from last week being so tight, it looks like we’ll see a breakout coming in the latter part of the week unless there is news to bring us unexpected volume.
We have the key level below 3335-40 support and above that resistance and a red box sitting at 3375-80. This is the region that needs to watched for the break, and if broken we should hit the range high again at 3400-10. However, if rejected, we could again see this dip to attack that lower order region 3310-6 before attempting to recover.
Last week we wanted to see that curveball and although we did see some aggressive price action, I think we will see something extreme for this week. It’s that lower level 3310-6 that is a key region for bulls, if broken we can see a complete flush in gold taking us down into the 3250’s before we start the summer run. That for us would be the ideal scenario going into the month end, but, we’ll play it how we see and as usual, we go level to level and update any changes as we go along.
KOG’s Bias for the week:
Bullish above 3340 with targets above 3355, 3361, 3368, 3372 and above that 3385
Bearish below 3340 with targets below 3335, 3330, 3322, 3316, 3310 and below that 3304
RED BOX TARGETS:
Break above 3350 for 3355, 3361, 3367, 3375 and 3390 in extension of the move
Break below 3340 for 3335, 3330, 3320, 3310 and 3306 in extension of the move
Please do support us by hitting the like button, leaving a comment, and giving us a follow. We’ve been doing this for a long time now providing traders with in-depth free analysis on Gold, so your likes and comments are very much appreciated.
As always, trade safe.
KOG
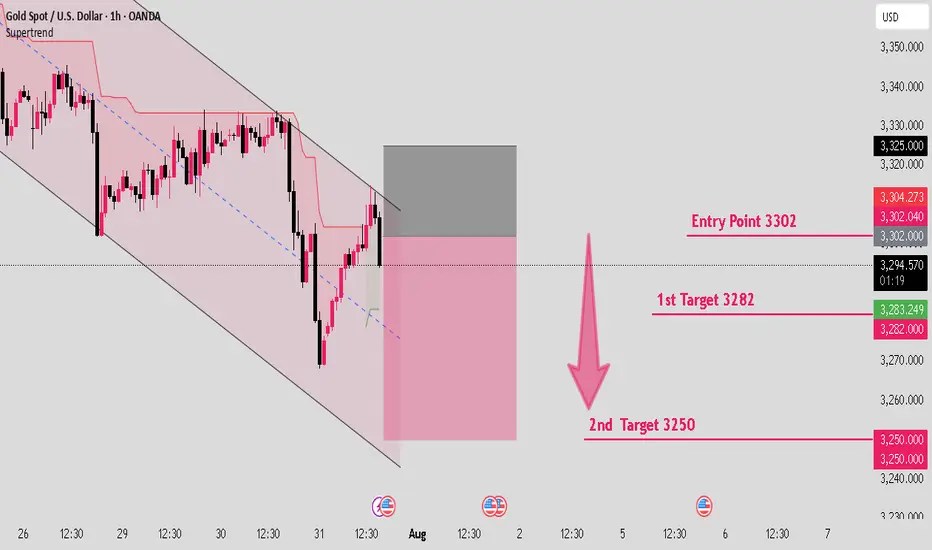
Gold channel Aka RangeJust Lookingg at this weeks price action I think gold will continue to trend in this range

Gold is creating a downward structure in parallel channel.Hello IGT FOLLOWERS
Here is my gold overview, According to me gold will fall because it is continously working in a downward parallel channel.. Bearish momentum visible on lower timeframes (1H-4H) • Price Structure: Recently rejected from $3,320-$3,325 resistance zone Forming lower highs and lower lows- suggesting short-term downtrend continuation..
Key points :
Entry point : 3302
1st Target : 3282
2nd Target : 3250
Follow me for more latest updates and signals
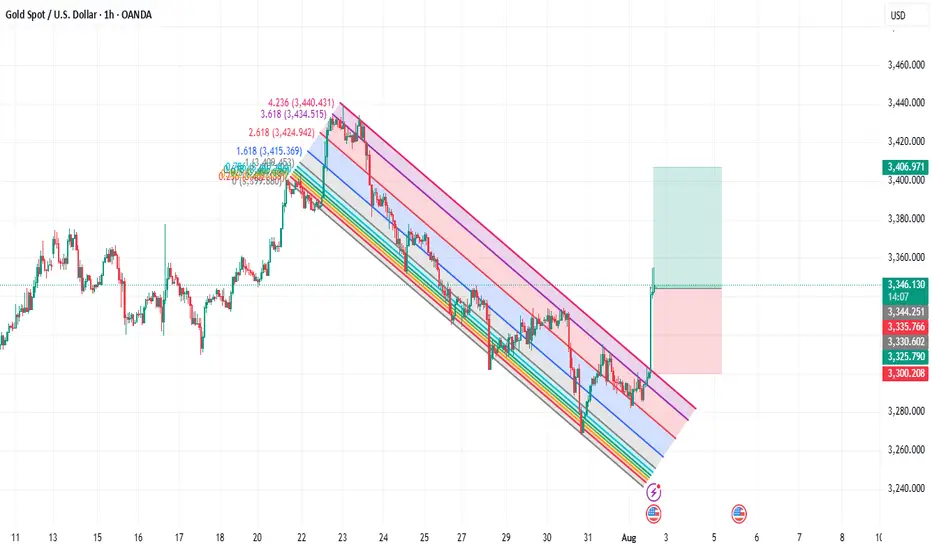
Daily XAUUSD Outlook — Riding the Fed Wave (July 28, 2025)Hey Gold Hunters! 🌟
Today feels like the calm before a storm—ADP whispers tomorrow, the Fed speaks Wednesday, and gold is inching toward its next big move. Let’s weave the macro pulse into our Smart‑Money map, highlight the five real zones, then plot our sniper‑perfect entries. No fluff—just the human beat of the market.
1️⃣ Macro Pulse & Market Mood
US Dollar: Bullish tilt as markets price in another hawkish Fed pause.
Tomorrow (Tue): ADP jobs print could spark an early swing.
Wed PM: FOMC Statement & Powell’s press conference—biggest catalyst this week.
Thu/Fri: Core PCE, Unemployment Claims, then Friday’s NFP + ISM Manufacturing.
Gold is caught in suspense: a squeeze here (into supply) or a slide there (into demand) will come fast once the Fed drops its hint.
🧭 Bias: Neutral‑bearish—looking for lower highs under the 3,345–3,375 supply zone, with a preference to short rallies into that band until price convincingly breaks and holds above 3,375. Once we see a clean weekly‑style close above that level, we’ll flip to neutral‑bullish.
2️⃣ Five Breathing Zones (Top → Bottom)
🛑 Zone 1 “Sky Trap” (3,380 – 3,415)
The final airspace above our daily EMAs (10/50) where stops are hunted. Fib ext’s 127%–161.8% and an unfilled Fair‑Value Gap live here. Any spike that ends in a long upper wick or bearish engulf = short‑trap.
(let price fall clear of this zone before the next)
⚔️ Zone 2 “Premium Supply” (3,345 – 3,375)
The two‑week high order block, hugged by EMA50 and Fib 61.8%. Friday’s rejection candle was born here. Watch for bearish PA after a retest—your core sell zone.
(space down to next)
🌊 Zone 3 “First Demand Cove” (3,290 – 3,320)
Where mid‑June’s buyers piled in: June consolidation OB, filled FVG, and Fib 38.2–50% confluence. SMA100 sits below for extra gravity. A clean drop and bullish reaction here = sniper‑long trigger.
(gap to deep zone)
🚀 Zone 4 “Deep Pullback Bay” (3,240 – 3,270)
Hidden Fair‑Value Gap, BOS origin, and weekly EMA21 converge. If Zone 3 breaks, this is your deep‑dip reload—hunt that D1 reversal wick.
(last space)
🛡️ Zone 5 “Macro Reset Block” (3,000 – 3,140)
The root of 2024’s CHoCH, EMA200/SMA200 cluster, and 78.6–88.6% Fib retrace. Only if gold truly panics on a USD blitz—ultimate accumulation.
3️⃣ Sniper‑Perfect Scenarios
🔴 Short Setup
Where: A thrust into Zone 1 or 2 (3,345+).
Cue: Long upper wick → bearish engulf on D1/M30.
Edge: FVG fill + Fib confluence + RSI rollover.
🟢 Long Setup
Where: A dip into Zone 3 or, if swept, Zone 4.
Cue: Bullish pin‑bar or engulf + reclaim of EMA10/50.
Edge: June OB base + RSI bounce from ~50.
4️⃣ Your To‑Do List
Morning Watch: Does gold flirt with 3,375? Prep your shorts.
Mid‑Day Pull: A drop to 3,300? Hunt your longs.
Avoid: The gaps between zones—those are “no‑man’s land.”
News Trades: Let the daily candle close post‑Fed before committing.
💬 What’s your plan today? Comment below—let’s refine our edge!
👍 Enjoyed this map? Smash that Like & Follow for more pulse‑driven, zero‑fluff outlooks.
Disclosure: Chart powered by Trade Nation’s TradingView feed. I participate in their Influencer Program.
GoldFxMinds 💛

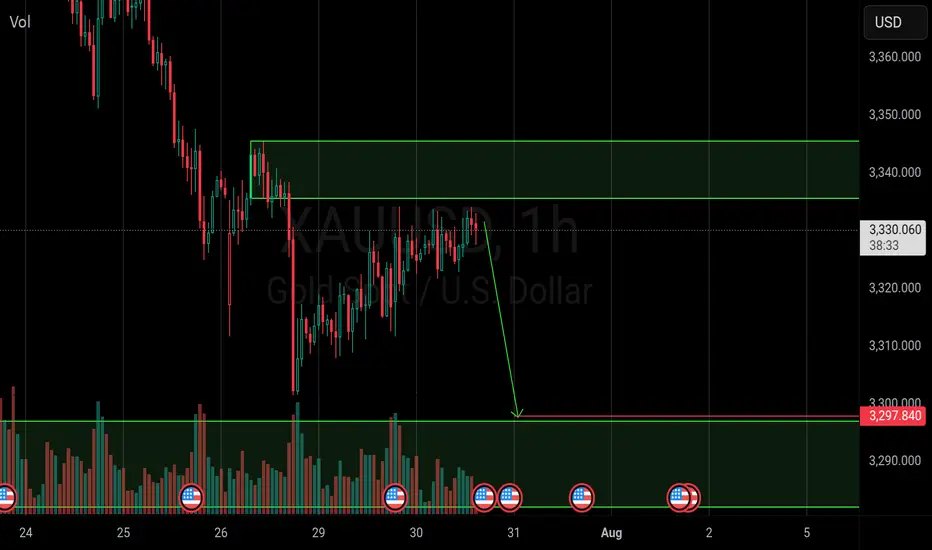
XAUUSD – Weak Rebound, Bearish Bias RemainsYesterday was a quiet and choppy day for Gold.
Although price managed to recover a small portion of last week’s 1400 pip drop, the rebound remains anemic — price barely reached the 23% Fibonacci retracement.
To make things worse for the bulls, the recovery from around $3300 is starting to take the shape of a bearish flag, a continuation pattern that typically signals further downside ahead.
📌 Resistance Zones to Watch:
- Initial resistance: $3345–3350
- Stronger resistance: $3370, a level already proven and well-defined
As long as the price is under those levels, I remain firmly bearish.
📈 Trading Plan:
I already have a short position open, and I'm still waiting to add more, preferably on a push into higher resistance, ideally above $3345.
No need to force entries — I’d rather scale in on strength, not weakness.
Once the correction is complete, I’m targeting:
- $3280 as the first support
- $3250 as a realistic downside objective
Conclusion:
The rebound lacks power. The structure favors the bears.
Still watching for better entries to add short, with eyes on 3280 and 3250 as likely targets.
Let’s stay patient and let the setup come to us. 🎯
Disclosure: I am part of TradeNation's Influencer program and receive a monthly fee for using their TradingView charts in my analyses and educational articles.

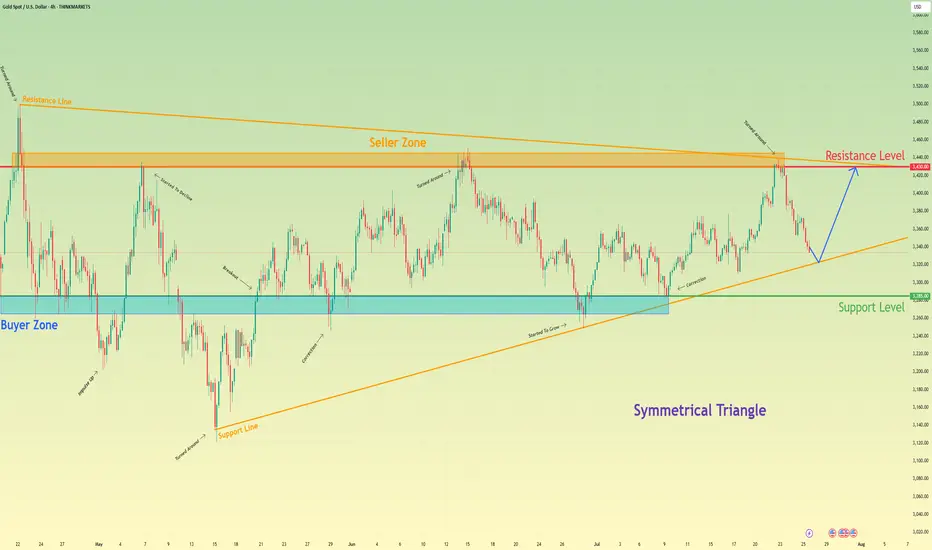
Gold will rebound from support line of triangle and rise to 3430Hello traders, I want share with you my opinion about Gold. Following a sequence of significant upward trends and the subsequent downward corrections that defined its range, gold has entered a broad market zone of consolidation. This battleground is clearly anchored by the historically significant buyer zone around 3285 and a formidable seller zone near 3430. Currently, the asset's price action is coiling and contracting within the confines of a large symmetrical triangle, a classic pattern that signifies a period of equilibrium and energy build-up before a potential high-volatility breakout. After a recent upward rebound was decisively rejected by the upper resistance line, the price is now in a corrective descent, heading towards the crucial ascending support line of the triangle. The primary working hypothesis is a long scenario, which is based on the expectation that this downward move will find strong buying interest on this key trendline, respecting the pattern's integrity. A confirmed and strong bounce from this level would signal another complete upward rotation within the triangle is underway. Therefore, the tp is logically and strategically set at the 3430 resistance level, as it not only aligns with the formation's upper boundary but also represents the major seller zone, a natural magnet for price on such a rebound. Please share this idea with your friends and click Boost 🚀
Disclaimer: As part of ThinkMarkets’ Influencer Program, I am sponsored to share and publish their charts in my analysis.
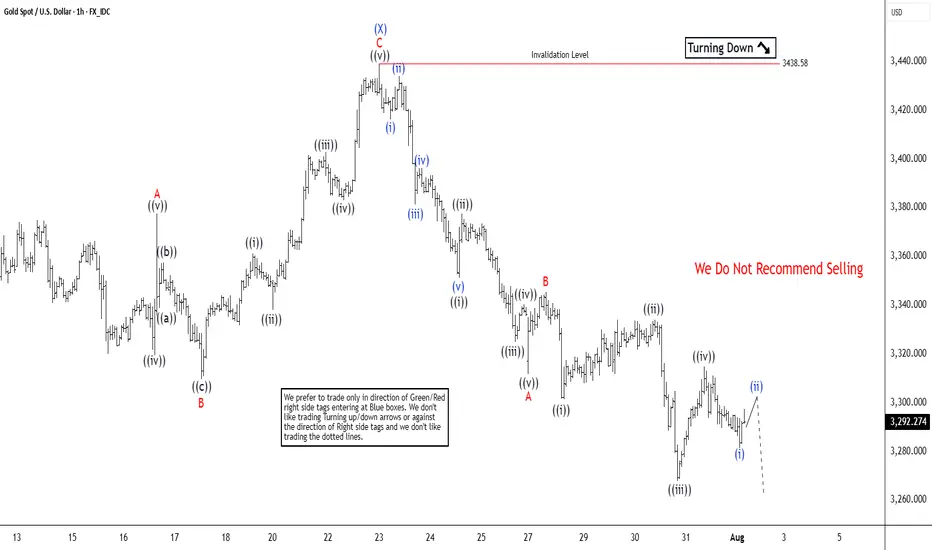
Elliott Wave Analysis Points to Gold (XAUUSD) Support Near 3320Gold (XAUUSD) appears poised for a double correction from its 16 June 2025 high. A double three consists of two corrective patterns, typically zigzags. From the June peak, wave (W) concluded at 3246.55, and wave (X) rallied to 3438.58, as shown on the 1-hour chart. Wave (Y) is now unfolding lower with internal subdivision as a zigzag. From wave (X), wave ((i)) ended at 3351.17, and wave ((ii)) peaked at 3377.45. Wave ((iii)) declined to 3324.80, followed by a wave ((iv)) rally to 3340.34. The final wave ((v)) completed at 3311.62, forming wave A in a higher degree. A corrective wave B rally reached 3345.35 before gold resumed its downward move.
Within wave C, wave ((i)) finished at 3301.47, and wave ((ii)) rallied to 3334.08. Wave ((iii)) dropped to 3267.94, with wave ((iv)) ending at 3314.85. Gold should continue lower in wave ((v)) to complete wave C. The potential target lies within the 100%–161.8% Fibonacci extension from the 16 June high. This projects a support zone between 3104 and 3230, where a three-wave rally is anticipated. Traders should monitor this area for potential reversal signals, as it may offer support for a corrective bounce.
The trend is clear, why do I choose to be firmly bullish on goldGold Trend Analysis: Yesterday, the gold market demonstrated strong upward momentum, opening near 3290 before falling slightly to a low of 3281 before fluctuating upward. Boosted by the non-farm payroll data, the gold market surged during the US trading session, reaching a single-day gain of 2.02%, reaching a high of 3363 and closing there. The daily chart formed a long bullish candlestick with a long lower shadow, forming a Morning Star pattern, reinforcing the bullish trend. From the perspective of the cycle structure, the daily level is clearly in the 5-wave upward stage, and the upward trend of the large cycle has not changed. At the indicator level, the daily MACD momentum column (the column below the zero axis) represents the short-selling momentum. Its "gradual shortening" means that the short-selling force is weakening and the downward momentum is gradually fading. It is a potential signal of stopping the decline or rebounding. KDJ is about to form a golden cross between 20-50, which is a signal that short-term bullish power is beginning to increase, and the overall trend is bullish.
The 4-hour level shows typical bullish characteristics: the moving average system is arranged in a bullish pattern, but there is a certain deviation between the short-term price and the moving average. The technical side needs to correct the deviation rate through a callback before continuing to rise. The short-term support below is focused on the line near 3330-3335. This position is both the relay support level in the previous rise and the intersection of the 4-hour moving averages MA10 and MA20, which has strong support strength; the short-term resistance above is focused on the line near 3370-3383. This area is a pressure-intensive area near the previous high point. If it can be effectively broken through, it will further open up upward space. A successful breakout would open up further upside potential. A breakout would further open up the 3400 mark.
For gold trading, the short-term strategy is to buy on dips. If the price pulls back to the 3330-3335 support level, consider entering a long position with a target of 3355-3365. If it reaches 3370-3380, consider a short-term short position with a target of 3350-3340.

Gold Slipping Lower — 3250 and 3200 in Sight!✅ Gold & DXY Update – Post-FOMC Price Action
Earlier today, before the U.S. interest rate decision, I released my outlook on both the Dollar Index and gold.
In that analysis, I highlighted the DXY’s readiness to move toward the key level of 100 — and as of now, price is actively testing that exact zone, just as expected.
As for gold, I repeatedly emphasized the visible weakness on the buy side. It was clear that there were very few remaining buy orders strong enough to hold price up in this region — and that’s exactly what played out. Price has started pushing lower, in line with our expectations.
Looking ahead, I believe the first target is 3250, followed by a deeper move toward the liquidity zone and the marked box around 3200, which could act as a key target area in the coming days.
🔁 This analysis will be updated whenever necessary.
Disclaimer: This is not financial advice. Just my personal opinion.

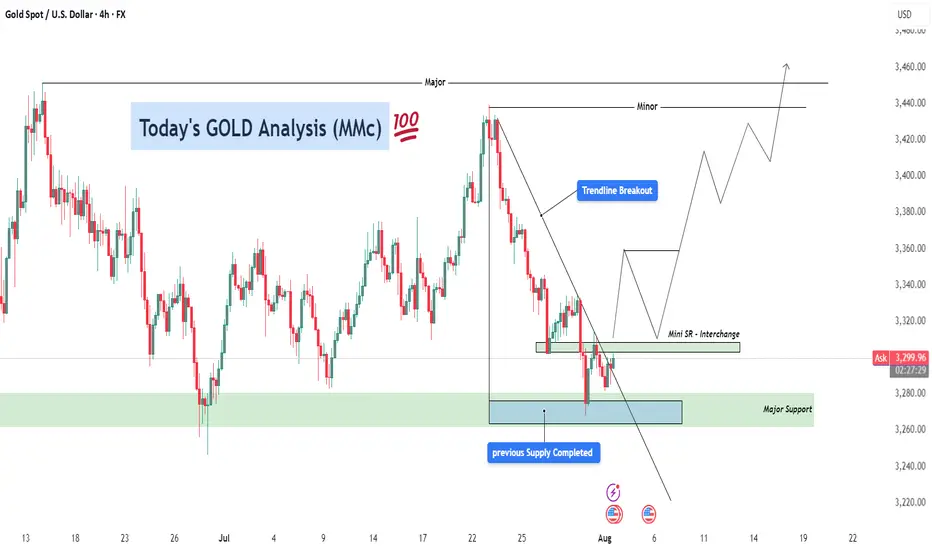
GOLD Analysis – Bullish Recovery Setup After Trendline Breakout ⚙️ Technical Structure Overview
This 4-hour chart of Gold (XAUUSD) illustrates a classic reversal setup developing after a significant correction. Price previously faced strong selling pressure from the 3,470+ zone and declined sharply. However, the recent price action suggests a shift in control from sellers to buyers, signaling a likely medium-term trend reversal or a bullish wave formation.
The key to this setup lies in three confluences:
Completion of a previous supply zone, which no longer holds influence.
Aggressive buyer activity from a major support zone.
A clean break above the descending trendline, which is a common signal that bearish momentum is losing strength.
🔑 Key Levels & Concepts Explained
🟢 1. Major Support Zone (3,260–3,280)
This zone has been tested multiple times and each time, buyers stepped in and prevented further downside. The most recent rejection from this area shows long wicks and bullish engulfing candles, indicating accumulation by institutional players. This is the foundational support that has held the entire corrective structure.
📉 2. Trendline Breakout
The descending trendline connecting swing highs has now been broken to the upside. This is a critical technical signal, especially on the 4H timeframe, as it suggests a potential trend reversal or at least a deep retracement in the opposite direction.
Trendline breakouts typically result in a retest of the trendline or a nearby support-turned-resistance zone (as is the case here with the Mini SR level).
It also implies that supply is weakening, and buyers are ready to push.
🧱 3. Mini Support/Resistance Interchange (~3,300–3,320)
This zone now plays the role of an interchange level—a previous minor resistance that could act as a support after the breakout. This level is crucial for intraday and swing traders because it can offer a low-risk long entry if price retests and confirms it with bullish momentum.
The chart projection suggests a bounce off this mini S/R, followed by successive higher highs and higher lows, forming a new bullish structure.
📈 Forecast Path & Trade Scenario
✅ Bullish Path (Preferred MMC Scenario)
Stage 1: Price retests the 3,300–3,320 zone (Mini S/R).
Stage 2: Buyers step in, leading to a bullish continuation.
Stage 3: Price targets the Minor Resistance (~3,440).
Stage 4: If momentum is sustained, it aims for Major Resistance (~3,470–3,480), completing a clean reversal formation.
This path reflects perfect bullish market structure—a breakout, followed by a retest and rally.
❌ Bearish Invalidation
If the price closes strongly below 3,260, the structure would be invalidated.
This would suggest that the support zone failed, possibly triggering deeper downside toward 3,220–3,200.
🧠 MMC Trader Mindset & Risk Considerations
Don’t Chase: Wait for a confirmed retest of the Mini S/R zone. Let the market come to your entry.
Entry Confirmation: Use candlestick signals like bullish engulfing, pin bars, or inside bars near the Mini S/R.
Volume Consideration: Volume should ideally rise on breakout legs and decline on pullbacks—this confirms healthy bullish structure.
Risk-Reward: With a stop below 3,260 and targets toward 3,470, the RR ratio favors long entries, especially after confirmation.
🔁 Summary Plan for Execution
Entry Zone: 3,300–3,320 (after bullish confirmation)
Stop Loss: Below 3,260 (structure break)
Take Profit 1: 3,440
Take Profit 2: 3,470–3,480
Risk-to-Reward: 1:2+ if planned carefully
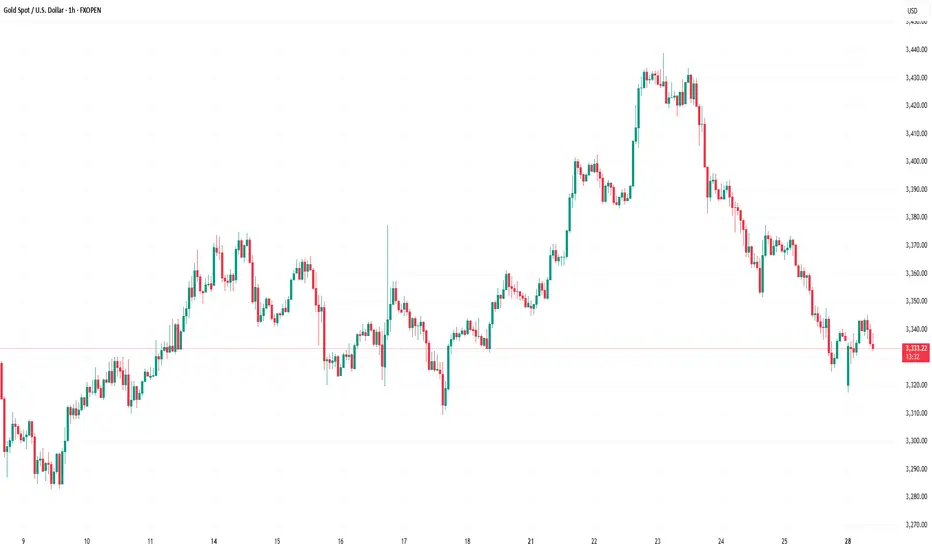
Market Analysis: Gold Prices Ease – Market Awaits Fresh CatalystMarket Analysis: Gold Prices Ease – Market Awaits Fresh Catalyst
Gold price started a fresh decline below $3,380.
Important Takeaways for Gold Price Analysis Today
- Gold price climbed higher toward the $3,430 zone before there was a sharp decline against the US Dollar.
- A key bearish trend line is forming with resistance near $3,350 on the hourly chart of gold at FXOpen.
Gold Price Technical Analysis
On the hourly chart of gold at FXOpen, the price climbed above the $3,380 resistance. The price even spiked above $3,400 before the bears appeared.
A high was formed near $3,432 before there was a fresh decline. There was a move below the $3,380 support level. The bears even pushed the price below the $3,350 support and the 50-hour simple moving average.
It tested the $3,325 zone. A low was formed near $3,325 and the price is now showing bearish signs. There was a minor recovery wave towards the 23.6% Fib retracement level of the downward move from the $3,433 swing high to the $3,325 low.
However, the bears are active below $3,342. Immediate resistance is near $3,350. There is also a key bearish trend line forming with resistance near $3,350.
The next major resistance is near the $3,380 zone. It is close to the 50% Fib retracement level of the downward move from the $3,433 swing high to the $3,325 low. The main resistance could be $3,410, above which the price could test $3,432. The next major resistance is $3,450.
An upside break above $3,450 could send the gold price towards $3,465. Any more gains may perhaps set the pace for an increase toward the $3,480 level.
Initial support on the downside is near the $3,325 level. The first major support is near the $3,310 level. If there is a downside break below it, the price might decline further. In the stated case, the price might drop towards the $3,265 support.
This article represents the opinion of the Companies operating under the FXOpen brand only. It is not to be construed as an offer, solicitation, or recommendation with respect to products and services provided by the Companies operating under the FXOpen brand, nor is it to be considered financial advice.
GOLD - SHORT TO $2,880 (UPDATE)Gold 'Sell Trade' running 1,130 PIPS in profit to start the week. I hope you are all taking advantage of this free analysis & profiting from Gold's downside. Amazing move to start the new week, with much more downside expected.
Drop me a message @XTBCAP for Account Management & Investment opportunities✅
Lingrid | GOLD Weekly Market Analysis: Strong Bullish ReboundOANDA:XAUUSD market has demonstrated resilience with a strong bullish rebound following the NFP, suggesting that institutional buyers are stepping in at critical support levels. The precious metal is now testing key resistance zones that will determine whether the recovery can gain sustainable momentum.
The chart reveals a compelling technical setup with gold bouncing strongly just above the June low support zone around $3,265. This rebound has pushed price back above the $3,330 level and is now approaching the critical $3,400 resistance area. The strong bullish rebound after the NFP release indicates that the selling pressure faded, with buyers emerging at attractive levels near the June lows.
The previous pullback phase has been contained within the broader ascending channel structure, maintaining the overall bullish framework. The triangle pattern breakout to the downside appears to have been a false move, with the current rebound suggesting that the correction may be complete. The ability to hold above the previous week low has preserved the medium-term uptrend structure.
Key levels to monitor include the immediate resistance at $3,400 and the previous support-turned-resistance at $3,330. A decisive break above $3,400 would likely trigger renewed bullish momentum toward the $3,440-$3,465 zone, while failure to sustain above $3,330 could see another test of the June low support. The strong rebound from critical support levels suggests that the broader bullish bias remains intact, with this correction potentially setting up for the next leg higher.
If this idea resonates with you or you have your own opinion, traders, hit the comments. I’m excited to read your thoughts!

Gold you now totaly buy trend for next 3 to 5 days Gold you now totaly buy trend for next 3 to 5 days
If you want learn more fell free contrect me .
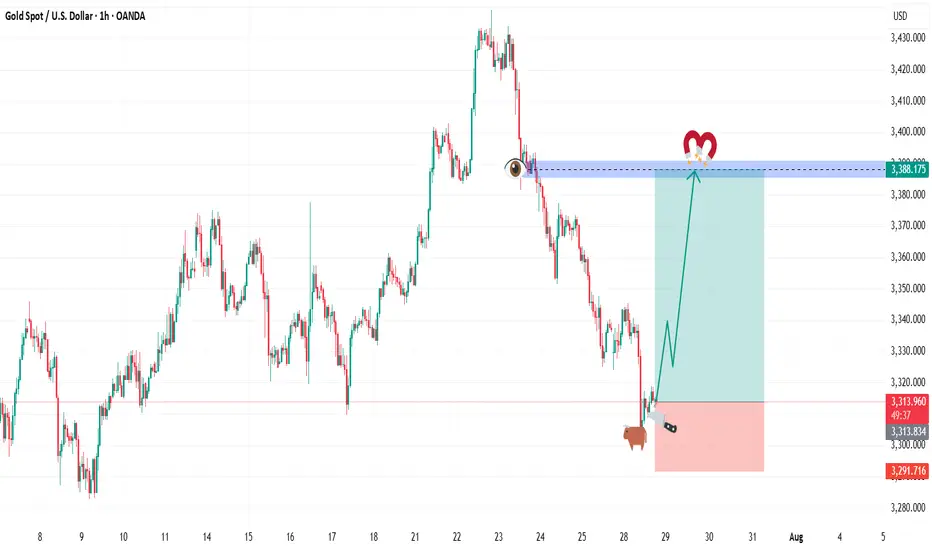
BUY GOLDIn todays session we are monitoring GOLD for buy opportunities. We have out entry at 3313.600 and stops below 3291 our target is at 3388.175 and higher. Use proper risk management. Cheers to you all.
GOLDGOLD needed a reaction from 3360 which is what market gave us, now we need some more upside before any correction.
Disclosure: We are part of Trade Nation's Influencer program and receive a monthly fee for using their TradingView charts in our analysis.
Gold weekly chart with both buy and sell entriesAnalysis of the Buy Entry: 2350/52
This level has been chosen as a potential long entry point due to a confluence of several technical factors.
Smart Money Concepts (SMC) - Discount Zone: The chart has a "Premium - Discount" range drawn over the recent downward price leg. The equilibrium (EQ) level is marked in the middle. According to SMC principles, traders look to buy assets at a "discount" (below the 50% EQ level) and sell at a "premium" (above the EQ level). Your buy entry at 2350/52 is located deep within the discount zone, making it an attractive price from this perspective.
Key Horizontal Support Level: The 2350 price is a significant psychological and technical level. Looking to the left of the chart, this area has previously acted as both support and resistance. By placing a buy order here, you are anticipating that this historical support level will hold again and cause price to bounce.
Potential Mean Reversion: At the point of entry, the price is significantly extended below the moving averages (the thin red, orange, and green lines). This can sometimes indicate an "oversold" condition in the short term, increasing the probability of a corrective bounce back up towards the moving averages (the "mean").
In summary, the buy entry is a calculated risk, betting on a bounce from a confluence of a deep discount price, a strong historical support level, and an oversold condition.
Analysis of the Sell Level: 2328
This level is critically important and likely serves two potential purposes: as a stop-loss for the buy trade, or as a trigger for a new short (sell) position.
Breakdown of Major Support: The chart highlights a significant support zone (the thick blue/grey box) roughly between 2330 and 2334. Your sell level at 2328 is placed just below this entire support structure and also below the most recent swing low. A price break below 2328 would signify a failure of this support, confirming that sellers are still in firm control.
Confirmation of Bearish Trend Continuation: In a downtrend, the price makes a series of lower highs and lower lows. A move down to 2328 would create a new lower low, reinforcing the bearish market structure and suggesting that the price is likely to continue much lower. This makes it an ideal place to exit a long position (cut losses) or to initiate a new short position to follow the dominant trend.
Order Flow and Volume Clues:
The note "Delta Volume?" next to this level suggests you are looking for confirmation from order flow data. A strong negative delta (more aggressive sellers than buyers) as the price breaks 2328 would provide strong confirmation for a short trade.
The label "LVN 2334.86" indicates a Low-Volume Node from a volume profile analysis. Price tends to move very quickly through these areas of low liquidity. By placing the sell level below the LVN and the support zone, you are anticipating an acceleration or a "flush" downwards once these key levels are breached.
In summary, the 2328 level is the invalidation point for the bullish "bounce" idea. If the price reaches this level, the reasons for buying are no longer valid, and the evidence strongly points towards a continuation of the downtrend.
Overall Strategy
The plan is to:
Enter a counter-trend long at 2350/52, anticipating a bounce from a strong support and discount zone.
Define risk by placing a stop-loss just below the key support structure at 2328.
Potentially use the 2328 level as a trigger to close the long and open a new short position to trade with the dominant bearish trend if the support level fails.

Risk Capacity: The Real Reason Traders Blow Accounts | Ep. 4In this pre-recorded video, I unpack one of the most overlooked reasons why traders blow their accounts over and over again, and it’s not about your system, strategy, or signal.
It’s about risk capacity, the internal threshold your nervous system can handle before fear, greed, or shutdown kicks in.
This is part of my ongoing series on YouTube “Rebuilding the Trader Within”, where I reflect on the emotional and psychological dimensions of trading that no indicator can fix.
If you've ever found yourself repeating the same mistakes, feeling stuck at the same equity level, or losing composure in high-stakes trades... this might be the pattern underneath it all.
I'm still learning too, and I’d love to hear your thoughts. Drop a comment — let’s grow together.
#RiskCapacity #TradingPsychology #TraderMindset #RebuildingTheTraderWithin #ForexMentorship #TraderGrowth #InnerWork #ForexPsychology

GOLD falls sharply, fundamental analysis and technical positionOANDA:XAUUSD fell sharply below the $3,300/oz price level as Chairman Jerome Powell did not signal any rate cuts at his next press conference on September 16-17. He only said that “no decision has been made on September” and that “more data will be evaluated in the coming months.” Economic data undermined the case for a rate cut, while geopolitical play remained a potential support.
The Fed and Interest Rates
The Federal Reserve kept interest rates unchanged for a fifth straight meeting on Wednesday, defying persistent pressure from President Donald Trump and White House officials.
However, two members of the central bank's board dissented, a rare move in three decades that underscored growing divisions within the central bank over the impact of Trump's tariff policies.
At the meeting, the Fed kept its benchmark federal funds rate in a range of 4.25% to 4.5%, in line with policy through 2025. Last fall, the Fed cut rates by a total of 100 basis points.
However, Federal Reserve Board Governors Christopher Waller and Michelle Bowman opposed cutting interest rates by another 25 basis points, marking the first time since Alan Greenspan in 1993 that two board members have opposed a majority resolution at a meeting.
At the press conference, Chairman Jerome Powell did not signal a rate cut at the next interest rate meeting on September 16-17, saying only that “no decision has been made about September” and that “more data will be evaluated in the coming months.” Powell also noted that despite Trump’s call for a sharp 3% rate cut to reduce interest costs on US debt and stimulate the housing market, the Fed will continue to monitor the longer-term impact of tariffs on the path of inflation and economic recovery.
Market expectations for a Fed rate cut in September fell to 47% in Powell's speech.
Economic data
ADP jobs data beats expectations and is bearish
US ADP payrolls jumped 104,000 in July, beating market expectations of 75,000 and marking the biggest gain since March. The data showed continued strength in the labor market, reinforcing the Federal Reserve’s stance on keeping interest rates high. Meanwhile, the preliminary estimate of annual GDP growth in the second quarter came in at 3% (2.4% expected), and the core personal consumption expenditures price index rose 2.5% year-on-year (2.3% expected), indicating both economic resilience and inflation stability, further weakening expectations for a rate cut.
Keep an eye on the ISM manufacturing PMI and non-farm payrolls data on August 1. If the jobs numbers continue to be strong, this could reinforce the Fed’s dovish stance.
Geopolitical and Policy Plays
News of a 90-day extension of the US-China tariff deal has eased some safe-haven demand, but Trump’s August 8 deadline for a new Russia-Ukraine deal, coupled with tensions in the Middle East, continue to provide potential support for gold.
Continued purchases by central banks (such as China and India) are a positive signal in the medium to long term, but are unlikely to offset short-term pressure from the Federal Reserve’s policies.
Technical outlook for OANDA:XAUUSD
On the daily chart, gold has been sold below the $3,300 level and now the $3,300 level has become the nearest resistance at present. For now, gold will be limited by the area of the 0.382% Fibonacci retracement with the original price point of $3,300, along with that it has formed a short-term downtrend with the price channel, the next target will be around $3,246 in the short term followed by the Fibonacci retracement level noted with readers in previous publications.
On the momentum front, the Relative Strength Index is operating below 50 and is far from the oversold zone (20-0), indicating that there is still plenty of room for downside ahead.
In addition, the gold trend will also be pressured by the EMA21, as long as gold remains below the EMA21, the current technical conditions continue to favor the downside.
For the day, the technical outlook for gold is bearish with notable positions listed as follows.
Support: 3,246 – 3,228 USD
Resistance: 3,300 USD
SELL XAUUSD PRICE 3345 - 3343⚡️
↠↠ Stop Loss 3349
→Take Profit 1 3337
↨
→Take Profit 2 3331
BUY XAUUSD PRICE 3240 - 3242⚡️
↠↠ Stop Loss 3236
→Take Profit 1 3248
↨
→Take Profit 2 3254

xauusd buybuy xauusd
XAUUSD
idea order block active with high volume here
and it back to test it
OANDA:XAUUSD
The US and Europe reached an agreement. Gold rebounded.At the current node, the EU and the US reached a tariff cooperation, 15% tariff + 600 billion US dollars for investment in the United States. The additional tariffs are considered a big deal, and the US has become the winner again this time.
Of course, this is a small negative for the current gold market.
From a multi-period analysis, the monthly chart price is still in a reverse K state. For the current situation, we need to pay attention to the gains and losses of the monthly highs and lows. The weekly chart shows that the price has continued to fluctuate at a high level recently. As time goes by, the weekly watershed is temporarily at 3320. After last week's high and fall, there is currently a further downward performance.
The four-hour chart shows that the price has continued to be suppressed after breaking through the four-hour support last Wednesday. The four-hour level resistance is currently around 3355, and the resistance level has moved up compared with the early Asian market. Therefore, we will pay attention to the pressure at this position in the future. If it fails to break through for a long time, it is likely to fall directly under pressure; pay attention to the support range of 3320-3310 below.

GOLD Is ready for a short fallGold is approaching an interesting level and i expect the fall begins soon to beloe marked demand zone