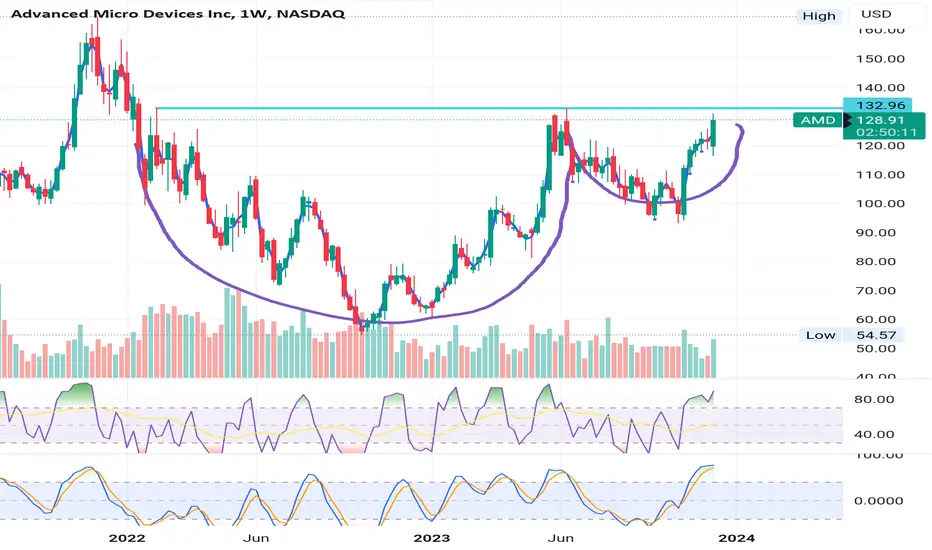
AMD long profit after Cup & Handle ?AMD long term profit ? A popular stock + Cup & Handle pattern + Above the average line 150 + Chip field is "HOT" + UP trend line.
Only an idea and not a recommendation for trading!
AMD trade ideas

Immediate short on AMD! Thank you as always for watching my analysis on AMD. Please feel free to like, share and comment this post! God bless you!

$AMD LONGNASDAQ:AMD - Breaking out from a multi-month falling wedge after holding the $100 support nicely which is a HUGE high timeframe support and psychological level. This breakout can lead us to previous ATH at around $150-$160 level in the next 2-3 months.
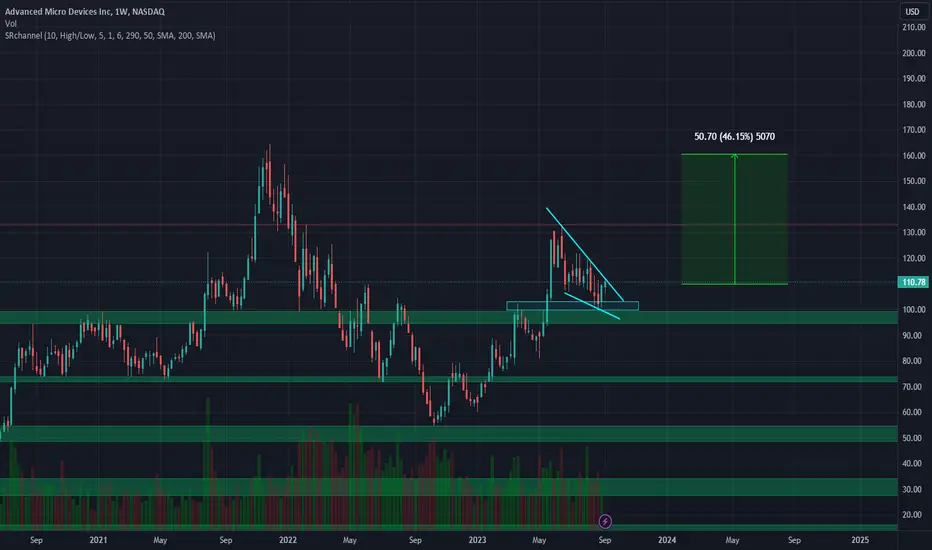
AMD LONGAccording to the visibility we have a cup and handle situation, a breakout and then back to check support, with the entry of buyers it will continue with the possibility of a profit of almost 60%.
Neither recommendation nor financial advice.
AMD Stock: Crucial Support Levels – Breakout or Rebound AMD Stock: Crucial Support Levels – Breakout or Rebound
Advanced Micro Devices (AMD) stock is at a crossroads, hovering around significant support levels. Investors are now closely monitoring for potential outcomes – a decisive breakthrough or a resilient bounce-back.
Support Levels in Focus:
AMD finds itself navigating critical support levels. Observing how it responds in this vicinity is important to gauging whether it's preparing for a significant directional shift.
Breakout Scenarios:
Should AMD breach these support levels, it could signal a compelling shift in market dynamics. Traders will scrutinize trading volumes and various technical indicators for confirmation, indicating a potential bearish trajectory.
Bounce-Back Potential:
Conversely, if AMD consolidates and gains support at the current levels, it may set the stage for a rebound. Positive market sentiment, solid fundamentals, or favorable news could spark renewed interest among investors, propelling the stock upward.
Watch carefully AMD navigates these crucial support levels.

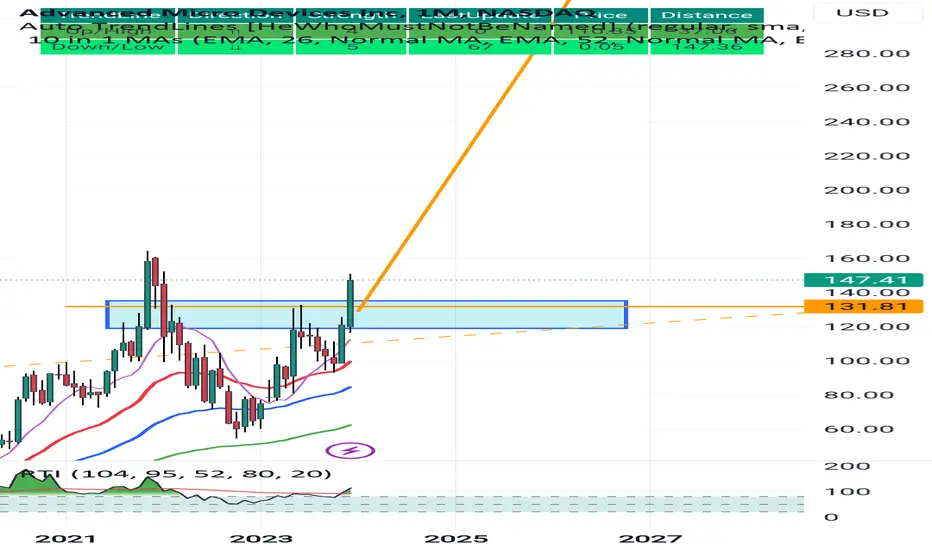
AMDAMD is bullish across weekly chart. It has broken above $130 resistance and currently pending shallow retrace to complete Wave 5 which would be a New ATH.
Bullish till end 2024.
AMD AnalysisPrice did not play out as analyzed last week, price went deeper into the bearish OB and is showing signs of bearishness right now. I'm expecting price to head towards the discount area of the PD array before continuing higher.
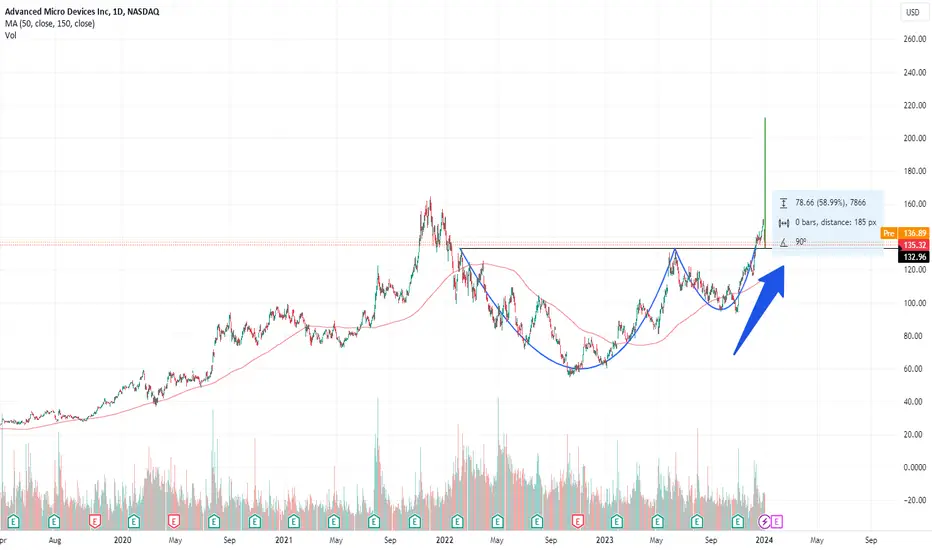
$150 early next year theoryIf this weekly isn't a cup and handle then i don't know what is.
If you're not in you could wait for $132.50 as an entry. Have your stop loss placed after that.
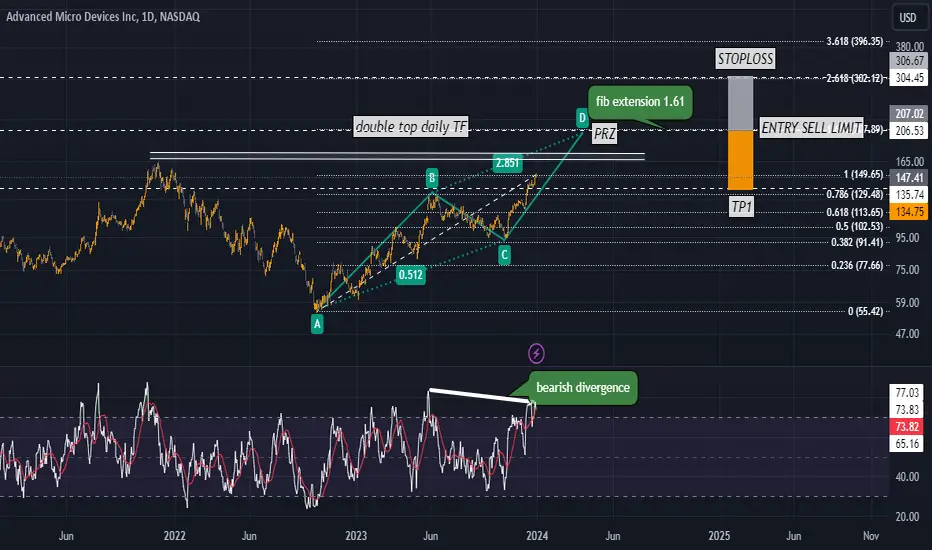
AMDbearish divergence
bearish AB=CD pattern
double top daily TF
potential reversal zone with fib extension
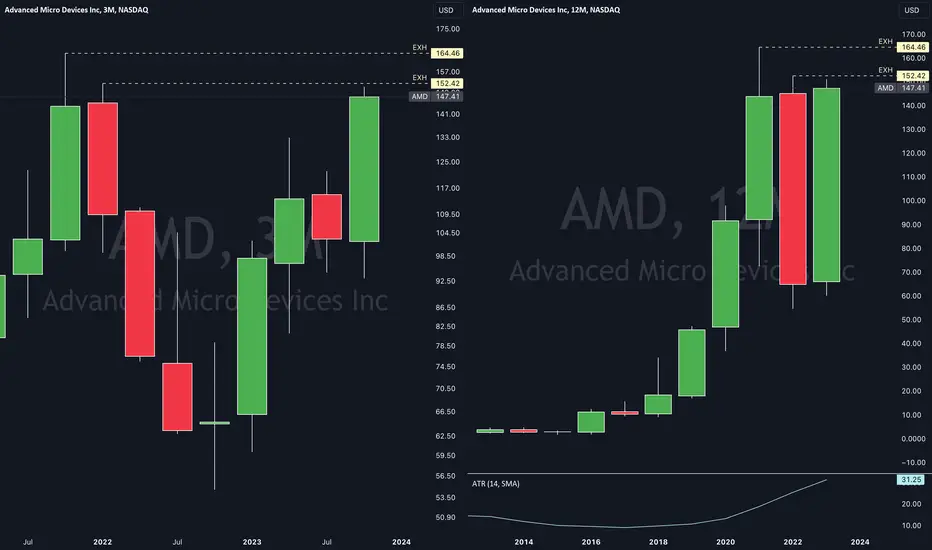
EOY review $AMD explosive move up, still inside year NASDAQ:AMD what a move, bright green year, but still inside year
outside quarter, inside year
extended? maybe, who knows, but....
always room for a further move up, especially given the highs of '22 and '21
both, not taken out yet....
let's see how semi conductors will move from here, in the A.I. era
Bonus PostingI wanted to post on AMD today as it recently made news for challenging NVDA's control over the market. Looking at the weekly chart, it appears clear to me we are coming to the end of this move up that started in July 2015. Thats over 8 years' worth of price action that is about to begin consolidation. The retrace could last as short as a couple years to a couple decades. Due to this being with-in a wave ((3)), I imagine it will be on the shorter side. This still means we will be in a corrective move downward for a couple years at minimum IMHO.
Check out how low I am predicting this thing can go. No, I don't think it will drop that low, but it is possible. Anyone who tells you different either doesn't believe EWT or doesn't understand it. I think it will drop to around $50 before it starts to rise again towards my next target that's over $1K. Do these numbers shock you? Me too, my first reaction is to say, "yea right, get real". However, I didn't make the rules, I just follow them. According to EWT, if the company continues to operate wisely, it's not a matter of if, but when.
Let's start with what is in front of us though. Right now, I am predicting price will move towards the area of the 0.786 @ $329.51. According to the structure, we just need a 5-wave move to create a new high for completion of ((1)). I haven't quite boiled down to the micros, but it appears we're in a microwave 3 of 5 to end ((1)) We're also already with-in the target box for this extended move up. Remember to look back at this when AMD starts to drop next year.

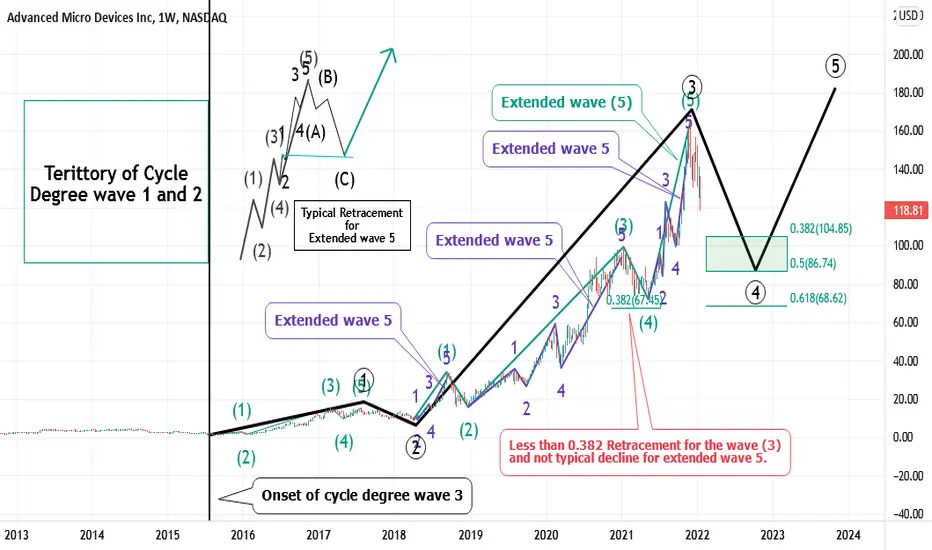
AMD, Worst Case Scenario and it still suggests making a new ATH!It seems madness to talk about making a new ATH these days with such a panic in the market due to FED's decision to raise the rates .Please follow the analysis to see if this is really a madness or just being realistic without caring to much about emotions , feelings and NEWS !.
What I am proposing here on the chart as wave count is what I can see as worst case scenario however, I welcome and embrace any more pessimistic wave count which anyone can suggest. So, If you have such a wave count please let me know and let us share our ideas.
I divided the chart into two sections with a vertical line to keep the chart clean and being focused on details of latest moves. I called the left side of the chart as territory of cycle degree wave 1 and 2 which means we are currently in cycle degree wave 3 started on 27th July 2015 at 1.61 USD.
Why I call this wave count as WORST CASE SCENARIO? Since, I considered a completed cycle with start point at 9.04 USD on 4th Apr 2018 and end point at ATH with extended wave 5s in all subdivisions ! As we know extended wave 5 is usual in commodity not stock market . What is common in stock market is extended wave 3 . I remarked extended wave 5s in different wave degrees on the chart. It is really a pessimistic wave count. Yet it is valid .
Considering this wave count as a true one , We are in primary degree correcting wave 4 (circled) and still there is one leg up to new ATH around 180 USD to make cycle degree wave 3 complete. Possible buy zone for this scenario is shown on the chart by green box. If this scenario happens , We will have a big correction at new ATH, Then another massive bull run and after that a big crash ! but, It is to soon to talk about.
In upper left corner of the right side of the chart , I showed a schematic drawing of an extended wave 5 with it's typical retracement. Typically, retracement of an extended wave 5 ends is top of wave 3 or wave 1 of 5. This guideline makes our suggested buy zone even stronger.
WORST CASE SCENARIO implies that we may have more optimistic scenario . Is there any? Of course there is . Since bodies of candles of current down going wave more than likely will enter to the territory of what labeled as wave 3 of (5) of circled 3 in daily time frame, we can consider wave cycle started at 72.5 USD on 13th May 2021 to be completed at ATH on 30th Nov 2021 with extended wave 5 .( There is alternative wave count which also considers this cycle a completed one but makes no difference in terms of price target in broader view). Also , extended minor degree wave 5 for intermediate degree wave (1) can be acceptable since both retracement and correcting pattern satisfies extended wave 5 pattern (See schematic drawing once more ).
But , What about extended wave 5 of (3) starting at 36.75 on 18th Mar 2021 and ending at 99.23 at on 11th Jan 2021? Neither amount of retracement nor the correcting pattern confirms this to be extended wave 5 !. If so, It can be considered as wave 3 of a different cycle with last up going wave (from 72.5 to ATH) being extended wave 5 of same degree and up going wave from 27.43 to 59.27 being wave 1 of same degree. In even more optimistic wave count this can be wave 1 of a new starting smaller degree up going wave cycle ! Try not to be confused ! All of these means that we may have more optimistic scenario with more up going waves with successive new ATHs one after another.
All in All, I assume that in worst case scenario, cycle degree wave 3 is yet to be completed. There are even more optimistic scenarios. Please let me know if you can make a more pessimistic yet valid wave count. As I previously emphasized , I believe AMD will see unbelievable targets in long term.
Hope this analysis to be helpful.
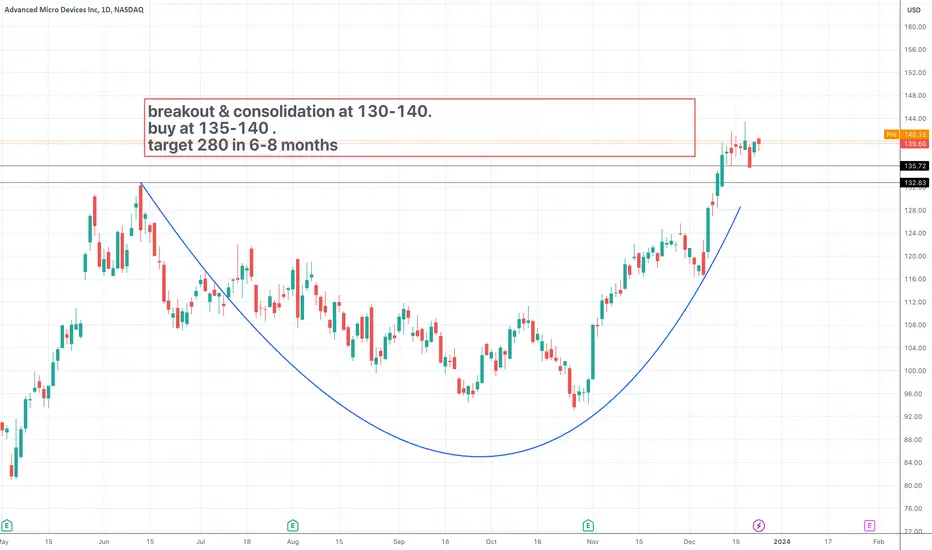
buy Amd at 140 for target of 280.breakout & consolidation at 130-140.
buy at 135-140 .
target 280 in 6-8 months
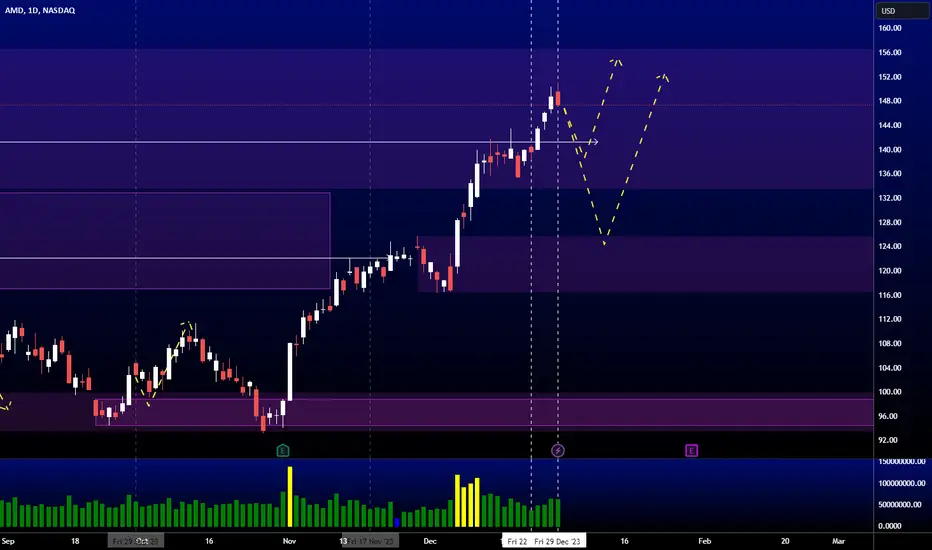
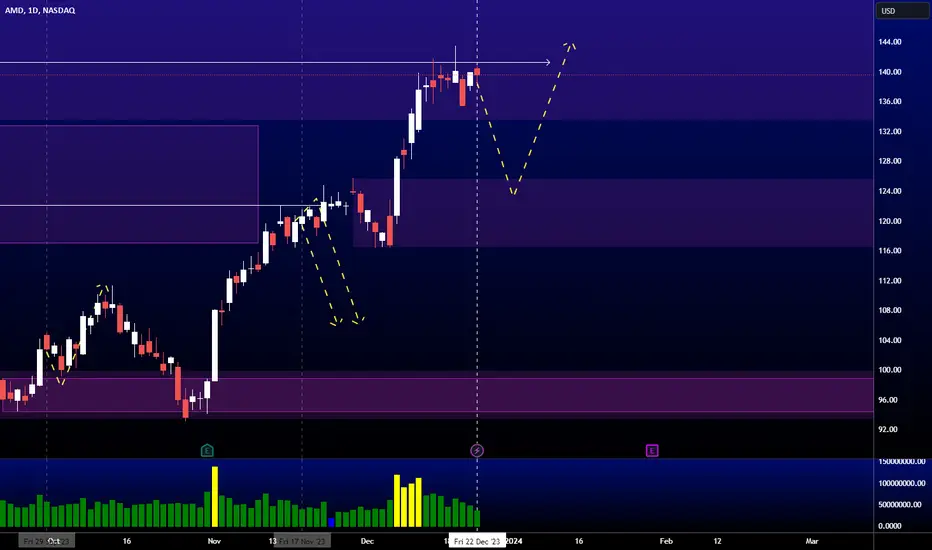
AMD AnalysisPrice did not play to my last analysis. We get a slight reaction to the downside once price took the highs at 122.12 within the bearish OB. However, price rallied higher into the bearish OB at 156.73 instead. We also have the clean highs at 141.25 taken recently within this bearish OB. If we see volume picks up on the down move, we can see price heading towards the new bullish OB at 125.73 next.
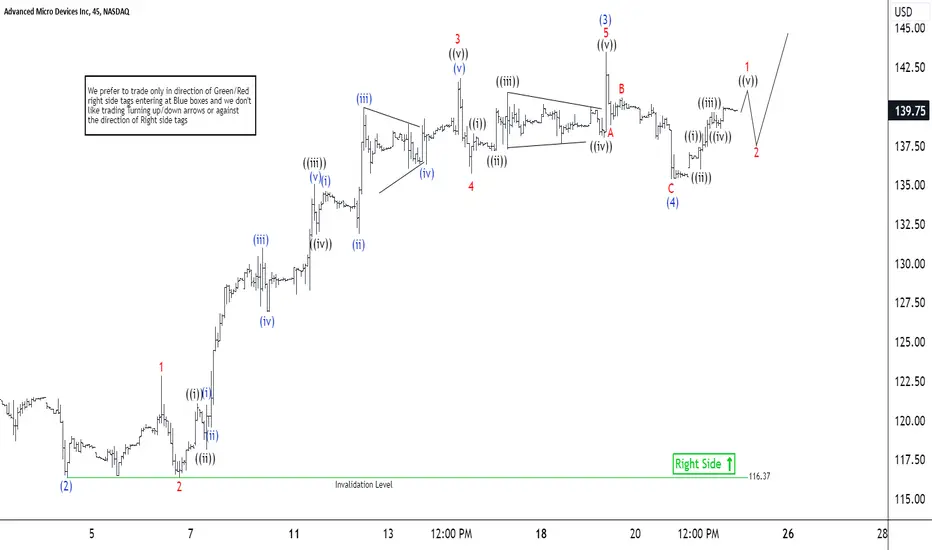
AMD Looking for One More Leg Higher to Complete an ImpulseShort Term Elliott Wave View in AMD shows a bullish sequence from 10.26.2023 low favoring further upside. Up from 10.26.2023 low, wave (1) ended at 125.72 and dips in wave (2) ended at 116.37. The impulse is in progress as the 45 minutes chart below shows. Internal subdivision of wave (3) was unfolding as a 5 waves impulse Elliott Wave structure. Up from wave (2), wave 1 ended at 122.83 and pullback in wave 2 ended at 116.38. AMD then resumes higher in wave 3.
Up from wave 2, wave ((i)) ended at 121.00 and dips in wave ((ii)) ended at 118.14. The stock then resumed higher in wave ((iii)) towards 135.04 and pullback in wave ((iv)) ended at 131.83. Final leg wave ((v)) ended at 141.82 which completed wave 3. Pullback in wave 4 ended at 135.72. Wave 5 higher made a ending diagonal structure finishing at 143.47 also ended wave (3). Wave (4) correction built a zig zag structure ending at 135.37 low. As price action stays above this level, expect the AMD to extend higher in wave (5). We need to break above wave (3) to confirm that wave (5) is in progress to avoid a possible double correction in wave (4). Once the market breaks above 143.47, next area to keep an eye comes in 143.50 – 145.46 where the stock should be rejected to think that wave (5) and the impulse is completed.
Members Daily Analysis December 2025 Hours of Upside wiped out in 2 hours.
Bearish engulfing candles everywhere.
Yields Falling / Dollar rallying!
