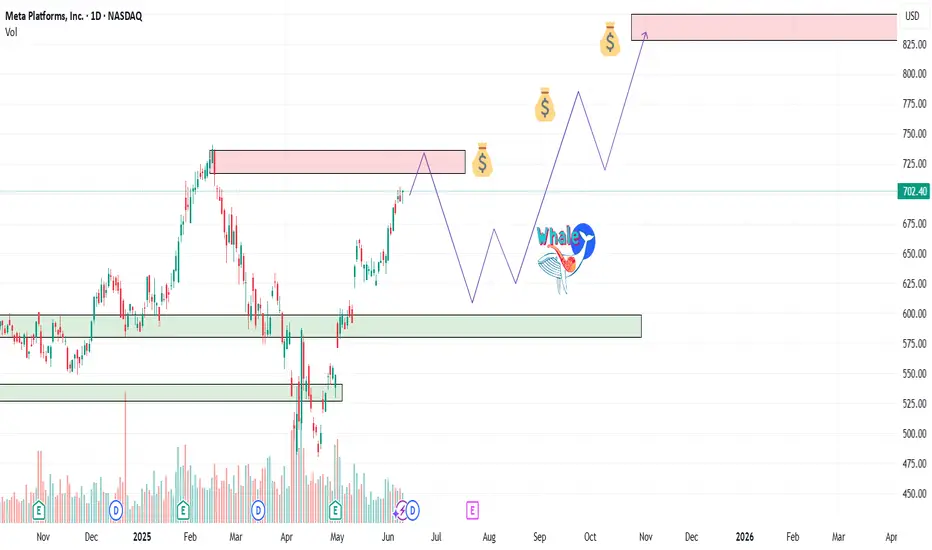
META-LOOKS STONGNASDAQ:META This is how I see the stock movement.
The setup looks strong, and after a minor correction, I expect the uptrend to continue. I’ve drawn my vision directly on the chart. Let’s see how the market reacts.
META trade ideas
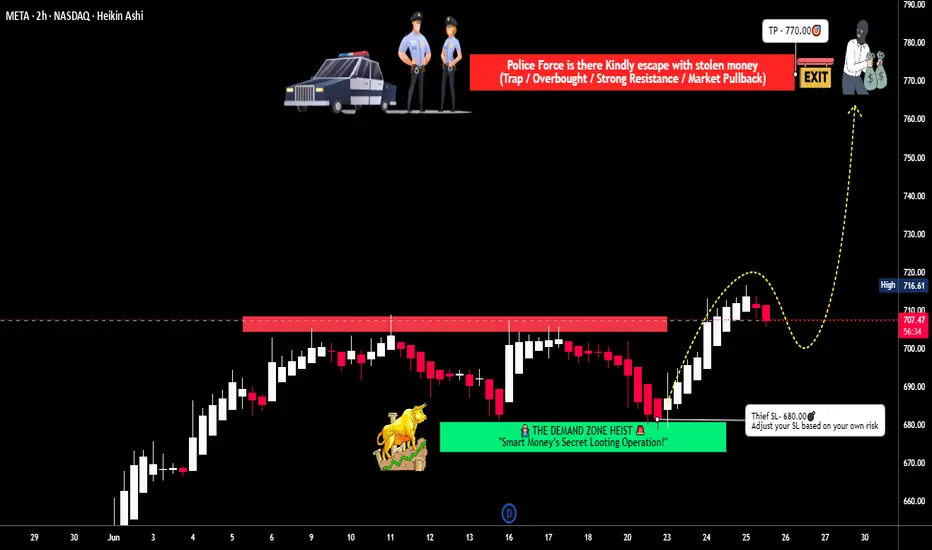
META Platforms Long Setup – Ready for the Next Move?💣 META Masterplan: Bullish Break-In Activated! 💼📈
🌟Hi! Hola! Ola! Bonjour! Hallo!🌟
Dear Money Makers & Silent Strategists, 🤑💰💸✈️
We’ve locked in on our next high-value digital vault: META Platforms Inc.
Built on our signature Thief Trading Style™ — where fundamentals meet stealth technical precision — this is your map to the bullish jackpot.
📍 ENTRY PLAN – Door’s Unlocked!
✅ Enter at any level — this heist is already in motion.
OR
🎯 Set your Buy Limit on a 15m/30m swing low or high — classic pullback infiltration.
🛑 STOP LOSS – Your Exit Route
Before breakout? Hold the line.
After breakout? Drop your SL at the recent 4H swing low – and size it to your risk appetite.
This isn’t luck — it’s calculated theft. 🔐
🎯 TARGET ZONE – Grab & Vanish
🎯 Aim: 770.00
But if the cops (aka sellers) show up early, get out with your loot — no shame in a clean getaway.
“Profit is the win. Perfection is fantasy.”
⚡ SCALPERS' TIPS – Quick In & Out
💵 Big wallet? Enter now.
💳 Tight budget? Follow the swing team.
Either way — longs only, and trailing SL is your safety rope.
📊 WHY META? – Intel Behind the Mission
🔍 This plan is reinforced by:
🔥 Strong Fundamentals
📈 Sentiment Signals
🧠 Quantitative + Macro Flow
💼 COT Data
🌐 Intermarket Correlations
It’s all aligning — the pressure’s building, and the breakout door is creaking open...
🚨 TRADING ALERT – Stay Outta Trouble
💥 Avoid placing new trades during major news drops.
🎯 Use trailing SL to protect and lock profits — your getaway vehicle must be ready.
💖 Support the Heist? Smash Boost!
Fuel the mission — every Boost empowers the crew.
This is Thief Trading Style — we don’t chase, we plan, strike, and vanish with the win. 🏆💪🐱👤
📡 Another breakout mission incoming. Stay hidden. Stay profitable. 🤑🚀
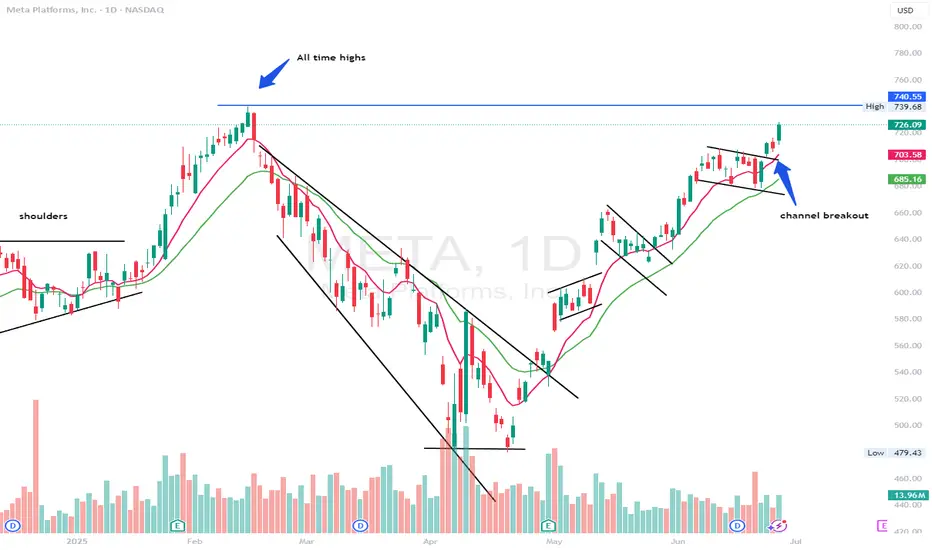
$META - channel breakout and test of all time highs incomingMETA - Stock breaking out of the channel on the daily time frame. Stock is approaching all time highs at $739.68. We might see a possible retest those levels very soon. calls above $727 looking good.
Meta Platforms - This stock tastes sooo good!Meta Platforms - NASDAQ:META - will print a new all time high:
(click chart above to see the in depth analysis👆🏻)
Over the course of the past two months, Meta has been rallying +40%. This recent behaviour was not unexpected at all but rather the consequence of the all time high break and retest. Now - back at the previous all time high - Meta will most likely break out higher again.
Levels to watch: $700, $900
Keep your long term vision!
Philip (BasicTrading)

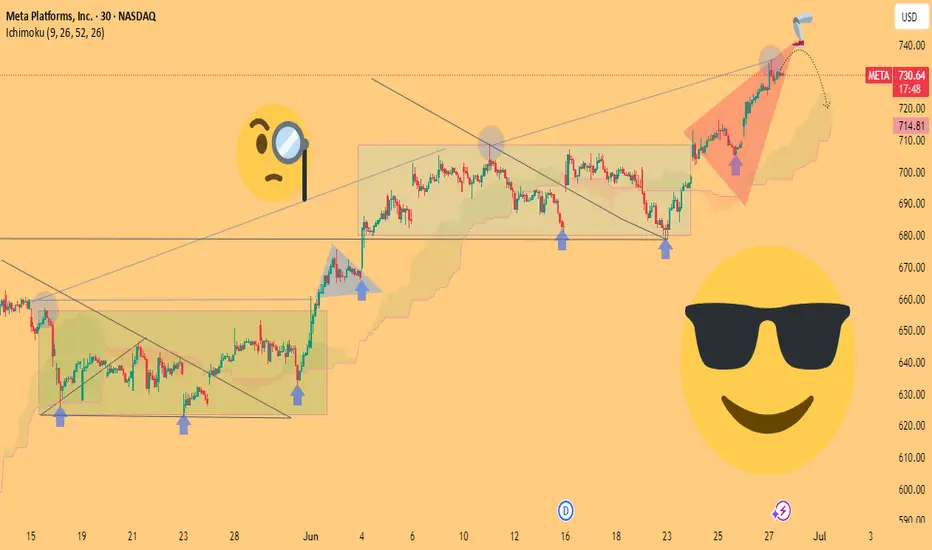
META Platforms (META), 30-Minute Timeframe📊 Chart Analysis: META Platforms (META), 30-Minute Timeframe
🧠 Thesis Summary:
The META chart shows a clear progression of bullish continuation patterns followed by potential exhaustion at the top of a rising wedge. A short-term retracement appears likely, offering a tactical opportunity for traders eyeing mean reversion setups.
---
🔍 Technical Breakdown:
1. Chart Patterns Identified:
Rectangles (Consolidation Zones):
Price respected horizontal support/resistance within multiple sideways ranges, indicating accumulation/distribution phases.
Marked with green boxes and blue arrows, the breakout points signal strong bullish momentum.
Symmetrical Triangle Breakout:
Just before the sharp rally, a textbook symmetrical triangle broke to the upside, acting as a bullish continuation.
Volume and price action confirmed this breakout.
Rising Wedge (Potential Reversal):
Price currently sits within a rising wedge (highlighted in red), often a bearish reversal pattern.
The curved dashed line suggests a projected pullback, possibly toward the Ichimoku Cloud (around $715–$720).
---
2. Ichimoku Cloud Analysis:
Supportive Trend Confirmation:
Price remained above the cloud for most of the move, reinforcing bullish bias.
Cloud thickness is reducing ahead, implying a potential slowdown in momentum.
---
3. Projected Path:
A short-term correction is projected as the price tests the upper boundary of the wedge.
A return toward the support zone ($715–$720) aligns with both technical pattern resolution and cloud support.
---
😎 What Makes This Chart Stand Out:
✅ Unique Visual Storytelling:
The use of emojis and illustrations (e.g., magnifying glass, sunglasses) adds personality while guiding the viewer’s eye to critical points.
The projected price path with curved lines and clear highlight zones communicates the author’s idea visually—ideal for broader engagement.
✅ Depth of Analysis:
Combines chart patterns, Ichimoku Cloud, trendlines, and price structure analysis.
Progression from consolidation to breakout to exhaustion is clearly defined and educational.
✅ Clean and Professional Layout:
No clutter—colors are subtle and harmonized.
Annotations are purposeful and add meaning rather than noise.
---
📌 Conclusion / Idea for TradingView Title:
> "META on the Move: From Breakout to Blow-Off – Is a Pullback Next?"
A high-conviction technical setup with a rising wedge near exhaustion, supported by Ichimoku analysis. Watch for a pullback to $715–$720 before the next move.
---
🧰 Tips for Publishing:
Use a short, sharp headline that teases the idea.
Include a brief written summary under the chart explaining your logic—something like what’s outlined above.
Meta Platforms - The rally is clearly not over!Meta Platforms - NASDAQ:META - can rally another +30%:
(click chart above to see the in depth analysis👆🏻)
Some people might say that it seem counterintuitive to predict another +30% rally on Meta Platforms while the stock has been rallying already about +750% over the past couple of months. But price action and market structure both tell us, that this will soon turn into reality.
Levels to watch: $850
Keep your long term vision!
Philip (BasicTrading)

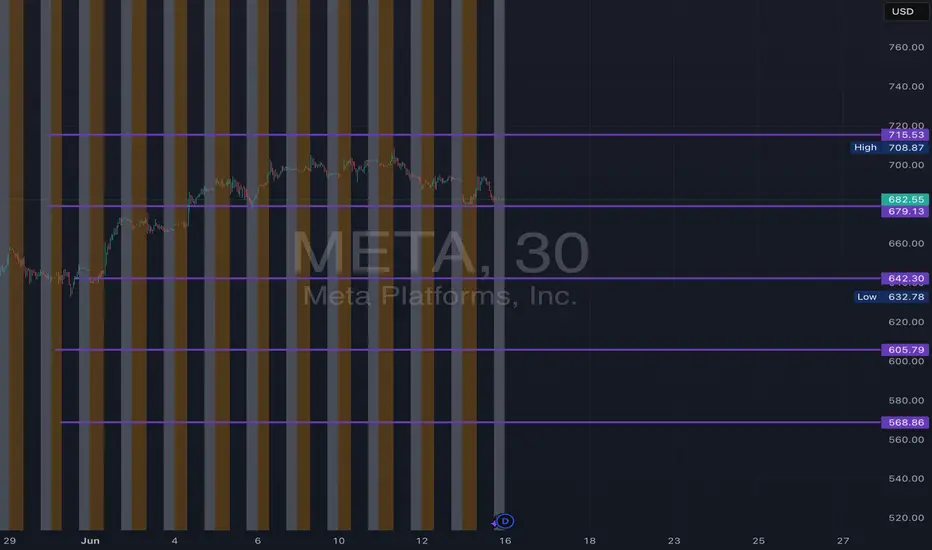
META June 2025 Monthly Support & Resistance Lines Valid till EOMOverview:
The purple lines serve as support and resistance levels for META stock throughout the month of June. When the price approaches these lines from either the bottom or the top, I will consider taking long or short positions in META stock, depending on the direction of the price movement.
Trading Timeframes
I usually use 30-minute candlesticks to swing trade options by holding 2-3 days max. Some can also use 3hr or 4hrs to do 2 weeks max swing trades for massive up or down movements.
I post these 1st week of every month and they are valid till the end of the month.
META: Short From Resistance! SELL!
META
- Classic bearish resistance pullback
- Our team expects a move down
SUGGESTED TRADE:
Swing Trade
Sell META
Entry Level - 708.68
Sl - 742.00
Tp - 667.90
Our Risk - 1%
Start protection of your profits from lower levels
Disclosure: I am part of Trade Nation's Influencer program and receive a monthly fee for using their TradingView charts in my analysis.
❤️ Please, support our work with like & comment! ❤️
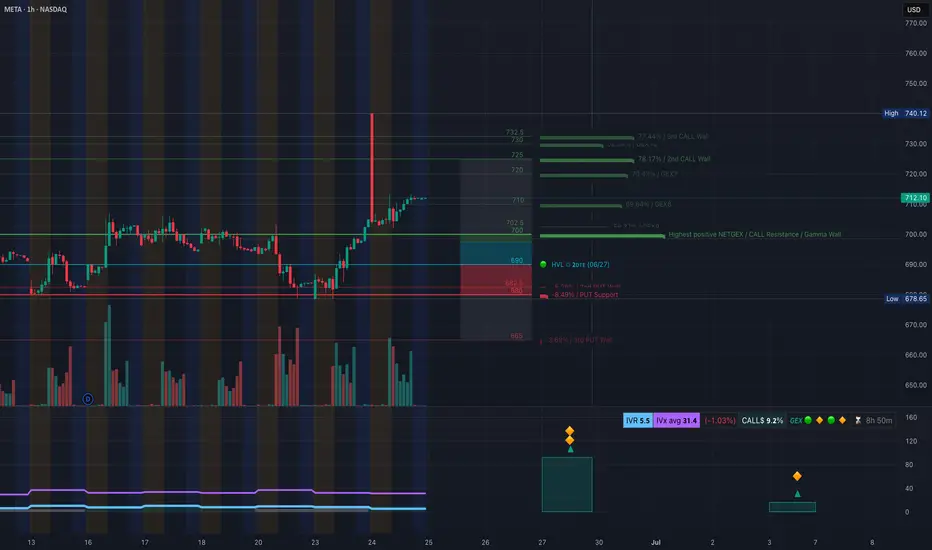
META is Heating Up! Time to Ride the Gamma Wave? 🔥 GEX Insight – Institutional Positioning:
META’s GEX chart is showing strong bullish sentiment:
* 📈 Highest Net GEX / Call Wall at $710, with stacked call resistance up to $740+.
* ✅ Current price at $712.10 has already pushed into the upper gamma zone — this puts $725 and $732.5 in play.
* 🟩 IVR at 5.5 + IVX dropping = low implied volatility zone — perfect time to buy calls cheap before volatility expansion.
* 🟢 GEX boxes: Full green lineup = highly supportive environment for bullish flow.
Options Idea:
🎯 Buy META 720C 06/28 (Friday expiry)
* Entry under $712.50
* Risk: below $703.00 (invalidates gamma push)
* Target 1: $725
* Target 2: $732.50 (GEX wall)
Why it works: You're riding on gamma exposure, a fresh breakout, and institutional positioning behind you.
Chart-Based Trading Plan (1H Structure):
META just broke above a long consolidation zone with:
* 🔄 Clean CHoCH → BOS → CHoCH bullish market structure.
* 🔼 Price retested the OB at ~$703–705, then bounced hard, forming a bull flag.
* ⛽ Volume spike and consolidation just below resistance at $715, with clear path toward the next SMC target at $740.
Trade Scenario:
* 📈 Bullish Play:
* Entry: Break above $713.00 (flag breakout)
* Target: $725, then $732.50
* Stop-Loss: Below $703 (last demand and CHoCH)
* 🧘♀️ Conservative Entry: Wait for pullback to $707–708 area (OB support), enter calls on bounce with tighter risk.
Wrap-up:
META’s GEX flow and technical structure are aligned for a potential continuation higher. You’ve got institutions buying calls into low IV, and price holding structure above BOS and CHoCH. Great odds for a momentum play to the upside — just don’t chase too high without a plan.
Disclaimer: This is not financial advice. Trade at your own risk with proper sizing and a risk management plan.
META an opportunity to add on this dip
Traded from that flag consolidation and was able to make some money on it.
now NASDAQ:META looks like a double top on the daily
but very bullish chart and can be added back between 660-665
that's it
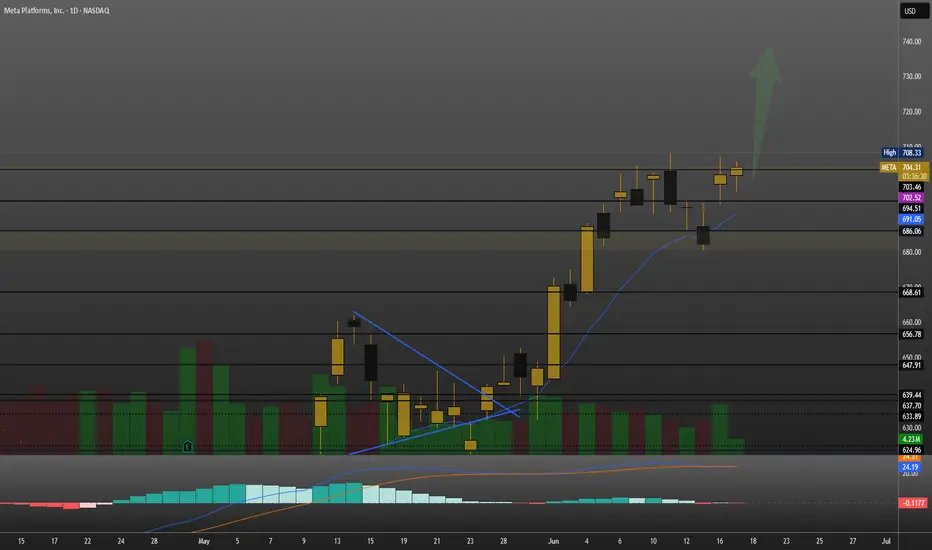
$META - Consolidation Cluster Bullish Flagging Ahead of The FedPrice held above key levels after breakout and is now flagging near highs.
700+ zone holding as new support
Strong structure with rising 9EMA catch
Volume cooling, but MACD remains bullish
Eyeing potential expansion above $708–710 range
This setup favors continuation. Watching for a clean break and close above $708 to confirm next leg higher.
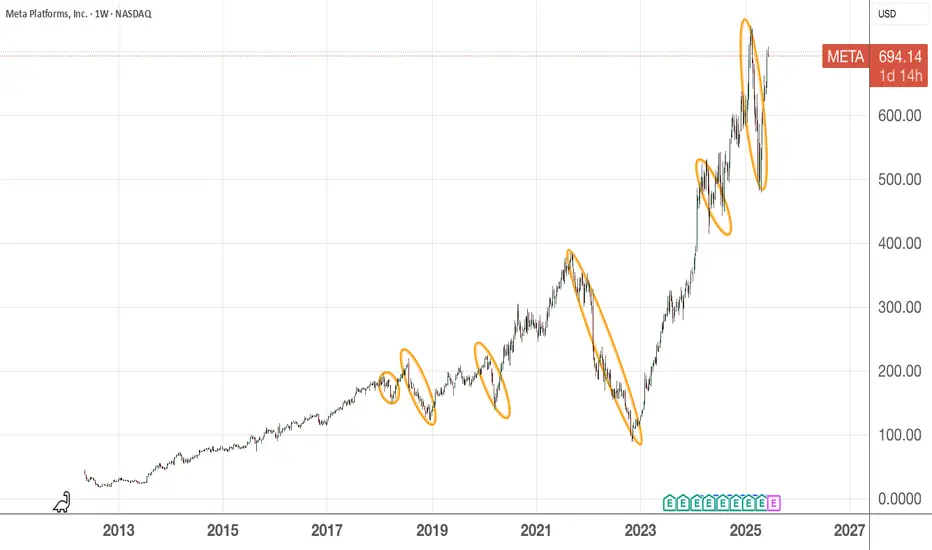
where were you 10 years ago, Facebook/Meta ?$10,000 Invested for 10 Years
Meta price March 19, 2015: $82.36
Meta 10-year return: 609.15%
S&P 500 price March 19, 2015: $2,089.27
S&P 500 10-year return: 171.64%
Nasdaq price March 19, 2015: $4,992.38
Nasdaq 10-year return: 255.56%
For more on the returns, read here
The consolation is IF you can't pick stock and hold it long enough to see the enormous returns, then investing in the index is the next best thing to do. You still get about 1/3 of the returns if you invest in Nasdaq compared to investing directly with Meta.
Of course, it has its down time as well as indicated in the orange loop. Question is were you able to ride the downs before enjoying the ups? Or you freak out and sold your shares like what some doomsday porn were influencing you?
And please don't ask me if Meta will ever by replaced ? How the hell will I know ? Go ask 3 of your good friends and 3 of your colleagues are they using FB, whatsapp and instagram? Just one or all 3 ? How often do they check their messages or go post on it ?
The answer is pretty clear.........
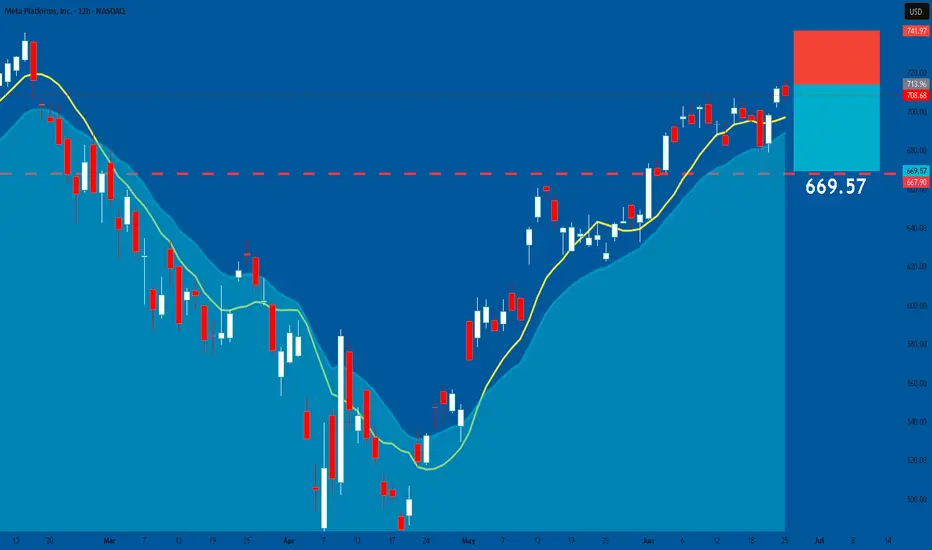
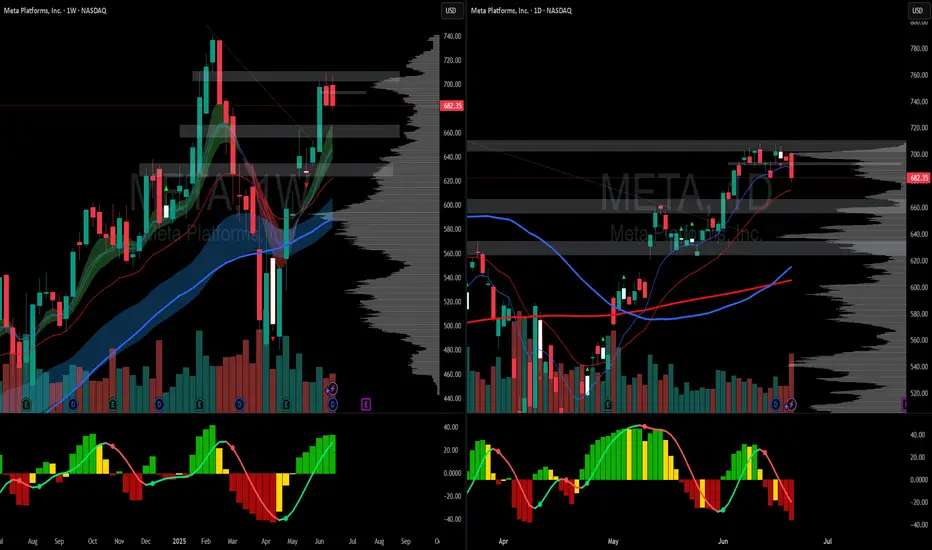
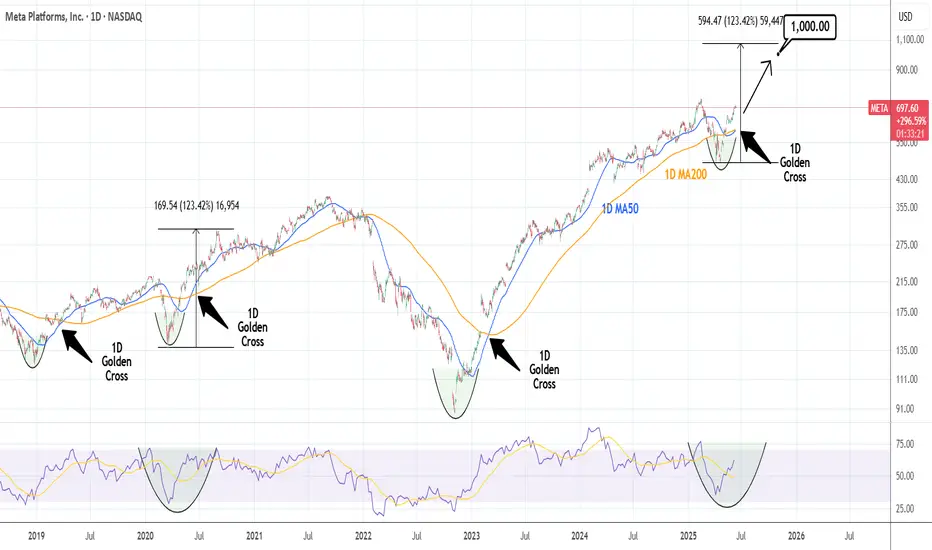
META: Close to a 1D Golden Cross. Strong buy.META is almost overbought on its 1D technical outlook (RSI = 69.797, MACD = 30.360, ADX = 40.237) but is about to form a 1D Golden Cross, the first such pattern since March 1st 2023, which was a little after the November 2022 market bottom. The market technically thrives on such conditions and since 2019, the 3 Golden Cross patterns that were formed were bullish continuation formations. Based on the 1W RSI, the current Golden Cross might be more similar with the June 2nd 2020 Golden Cross that was formed after the COVID crash. It rose by +123.42% before pulling back to the 1D MA200 again, so we remain bullish on META with TP = 1,000.
## If you like our free content follow our profile to get more daily ideas. ##
## Comments and likes are greatly appreciated. ##
Don’t Sleep on META Buy the Fear, Ride the AI Wave After an impressive run, META is taking a breather around $700. But let’s not forget—this stock was trading at $530 just a few months ago. With aggressive AI bets like the $14.8B stake in Scale AI and plans to develop superintelligent models, Meta isn’t just following the AI trend—it wants to lead it.
Now here's the setup:
We could see a healthy pullback before the next leg higher. The $620–$650 zone looks like a magnet if broader tech cools off short-term.
🔽 Entry Points (Dip Buy Zone)
⚡ $700 (speculative starter)
⚡ $665–650 (ideal swing entry)
⚡ $620 (major opportunity zone if fear takes over)
📈 Targets
🎯 TP1: $725
🎯 TP2: $805 – breakout into blue-sky territory
🎯 TP3: $850+ – long-term growth if AI hype turns into revenue reality
🧠
META’s AI investments and platform dominance are building real momentum. Volatility may offer the perfect second chance. Risk is real but so is the upside.
⚠️ Disclaimer: This is not financial advice. Do your own research before making any investment decisions. Markets are risky, trade responsibly.
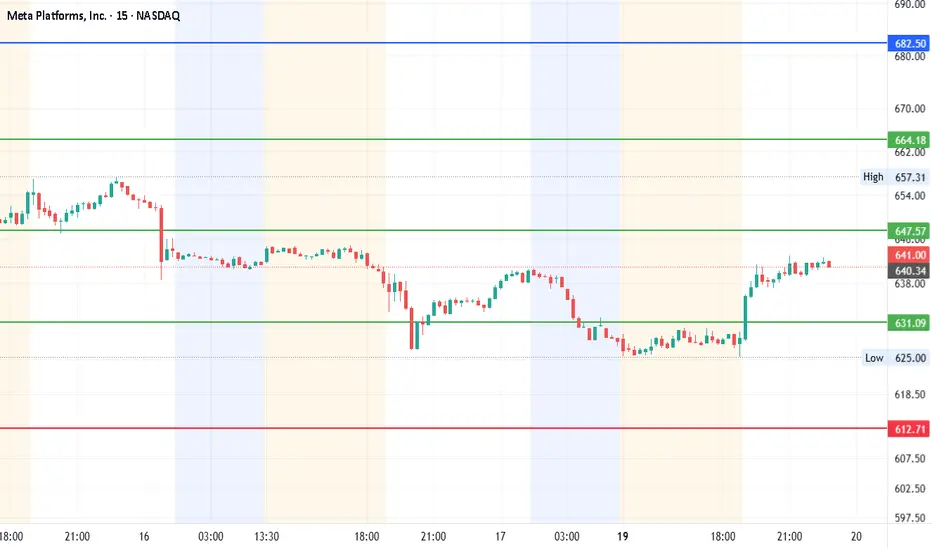
#META - 80 POINTS MOVE ON RADAR | $740 OR $554 ?Date: 19-05-2025
#META
Current Price: 640.34
Mid-Point: 647.57
Upside Targets: 682.50, 700.81, 720.78 and 740.74
Downside Targets: 612.71, 594.33, 574.37 and 554.40
Support: 631.09
Resistance: 664.18
#METAChartAnalysis
#METAChartPatterns
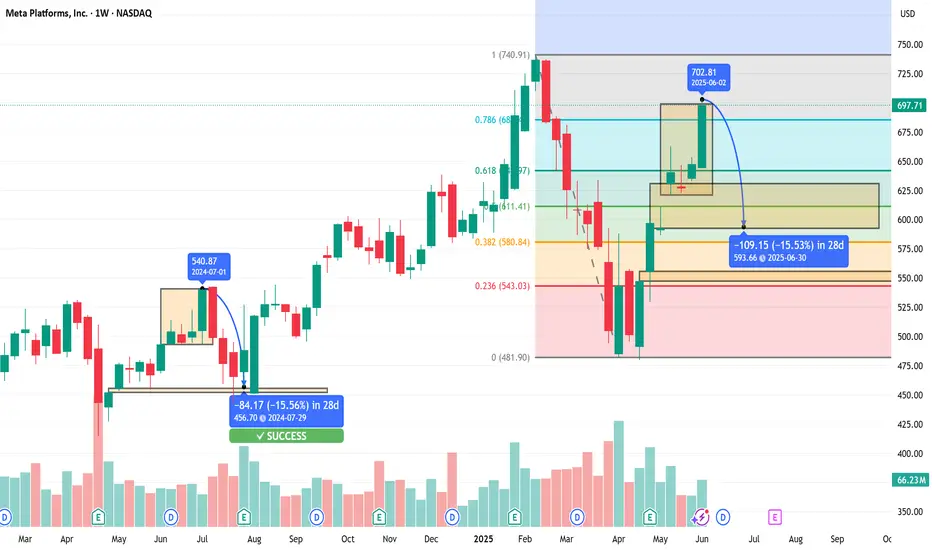
$META Short Swing - Fractal Repeat Play - Sub $600 Target@everyone 🔻 META Short Swing – Fractal Repeat Play 🔁
Entry Trigger: Week of June 10, 2025
Ticker: NASDAQ:META
Current Price: $697.71
Target Price: $593.66
Estimated Duration: ~3–4 weeks
Conviction: ★★★★★
🧠 Thesis:
This is a nearly perfect fractal repeat of META’s July 2024 top:
Identical weekly candle structure: topping wick into fib + supply zone
Weekly gap fill target lines up exactly again — same 15.5% drop
Wick gap fill = $593.66 (same confluence from 2024)
Bearish fib roadmap from 0.786 → 0.618 → 0.382
Volume and momentum exhausted on the run into $702
📉 Trade Plan:
Entry Range: $690–702 rejection zone
Stop Loss: Weekly close above $705
Primary Target: $593.66
This level completes the wick gap fill and matches 2024’s exact structure
Secondary Target (optional): $580.84 (full fib gap + demand retest)
🛠️ Options to Consider:
6/28 $650P or $640P – standard swing
7/5 $620P – for deeper move toward 0.382 and beyond
🔍 Setup Snapshot:
July 2024: -15.56% in 28 days
June 2025: Targeting -15.53% in 28 days
Same gap, same wick rejection, same fade roadmap
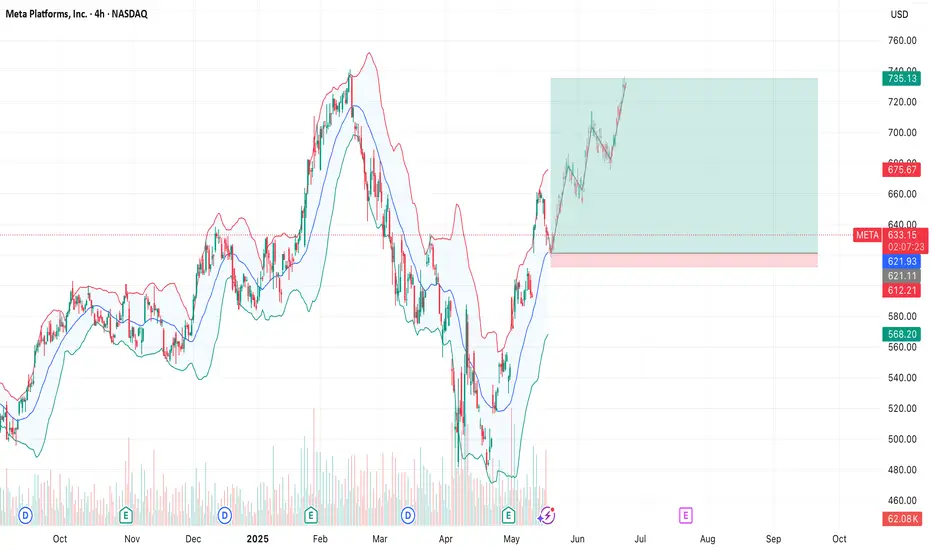
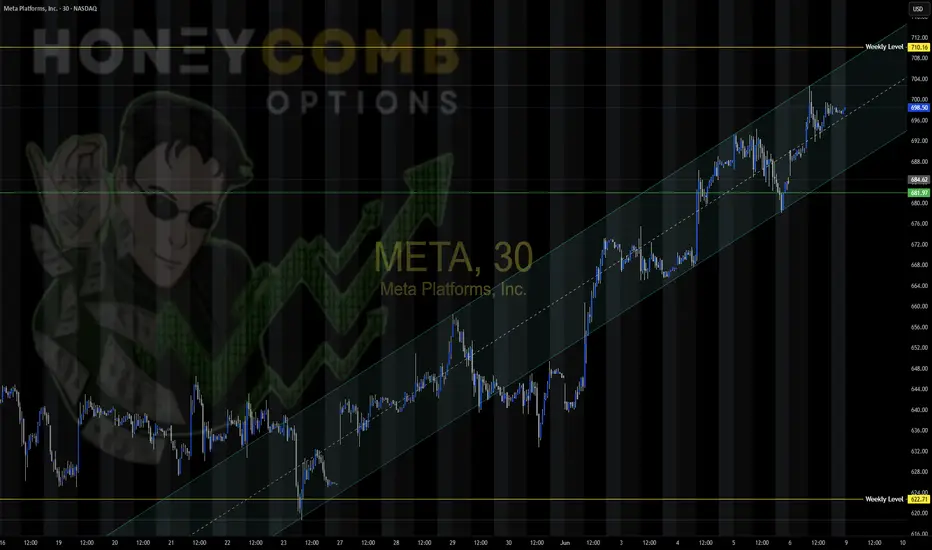
META play the channel META is in a nice channel, I would play it from top to bottom till it losses the channel
META Swing Setup – Long Call Into Overbought Strength📱 META Swing Setup – Long Call Into Overbought Strength
📆 Date: June 6, 2025
📈 Outlook: Moderately Bullish (10–14 day swing)
📊 Strategy: Buy naked call aiming for breakout above resistance near $700
🔍 Model Consensus Overview
Model Bias Strike Premium Target(s) Stop Confidence
Grok Contrarian 680P 13.25 +50% / -25% 75%
Claude Bullish 700C 10.38 $13.49 / $16.61 $7.79 75%
Llama Bullish 760C 0.97 ~100% Gain Below $680 80%
Gemini Bullish 745C 1.71 $3.42 / $5.13 $0.85 70%
DeepSeek Bullish 700C 10.50 $15.75 / $21.00 $7.00 75%
✅ Consensus Direction: Moderately Bullish
🎯 Key Technical Level: Resistance at $699–700
📊 Max Pain: $600 (ignored due to strong trend)
💡 Best Risk-Reward Strike: $700C – high OI & liquidity
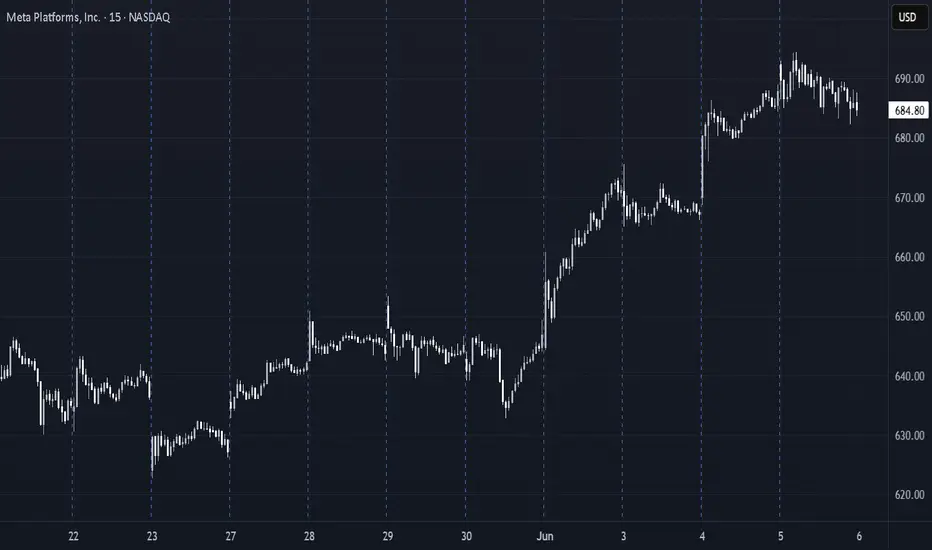
⚙️ Technical Snapshot
Trend: Strong daily/weekly uptrend intact
Short-Term: Overbought RSI (77), 15-min consolidation
Support: $680–685
Resistance: $699–700
Volatility: VIX falling = stable setup
News: Sector strength and tech leadership intact
✅ Trade Setup
Metric Value
Instrument META
Direction CALL (Long)
Strike $700
Expiry 2025-06-20
Entry Price $10.38 (midpoint)
Profit Target $15.57 (50% gain)
Stop-Loss $7.78 (25% loss)
Size 1 contract
Confidence 75%
Entry Timing Market Open
🧠 Trade Management Plan
🎯 Targets
Take profit at $15.57
Optional second target: $16.61–$21.00 range if momentum is strong
🛑 Stop Triggers
Premium falls to $7.78
Underlying drops back below $680 (watch for trend break)
📆 Hold Duration
7–10 trading days max
Exit sooner if trend weakens or resistance rejection confirmed
⚠️ Risk Considerations
Overbought RSI: Pullback from $699 possible
Bid/ask spreads: Can widen in low volume
Max pain at $600: Could magnetize near expiration
Market volatility: Sudden macro shocks can derail momentum
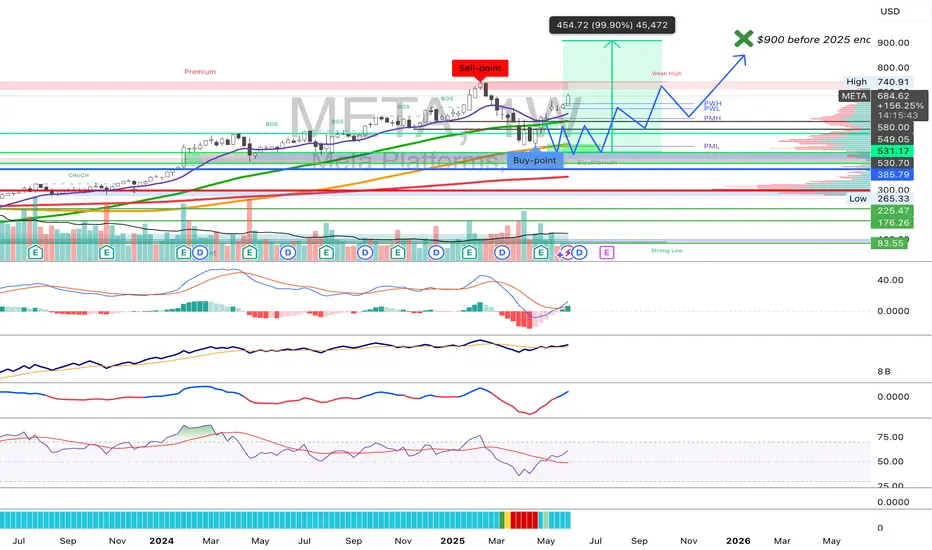
META long, I still think it can hit close to $900 usd in 2025-I've been bullish on NASDAQ:META , the stock (facebook's parent company) for awhile now. it still looks healthy having rebound off the 100 weekly SMA and is up already 38% from the bottom of the dip.
-Even though it performed lovely in 2024 I still believe it can go further before 2025 ends.
-I'm targetting $900 before the end of the year, it should be able to reach that price level.
-I don't see any reasons on the horizon to stop this uptrend from continuing.
Give me your arguments bears in the comment section ;)
Will META fill the gap before push upWill META fill the gap before push up.
My thoughts are displayed on the chart, and are technical.
While I already have a buy for the stock, I am open to another entry if this asset pulls back to fill the gap highlighted in the yellow block.
Entry, SL and TPs are all highlighted.
If you find this helpful, kindly follow me, like and comment.
As usual, trade with care

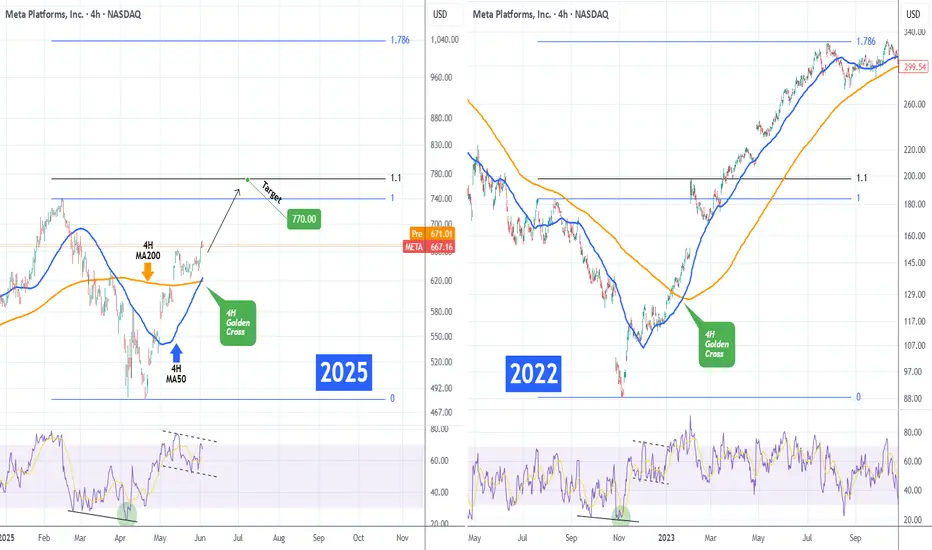
META Formed 1st 4H Golden Cross since Jan 2023!Meta Platforms (META) just completed yesterday its first 4H Golden in almost 2.5 years (since January 24 2023), flashing the strongest bullish signal it could at the moment!
Practically that Golden Cross was formed directly after the November 2022 bottom of the Inflation Crisis. The 4H RSI patterns between the two time periods are identical, so it is highly likely to see the market repeat that price action.
That suggests that the immediate Target on what seems to be an Inverse Head and Shoulders pattern is the 1.1 Fibonacci extension at $770.00, as META did on February 03 2023.
On the long-term and assuming a favorable macro environment (Trade Deals, Rate Cuts) it could reach the 1.786 Fibonacci extension a little over $1000, before the next major market correction.
-------------------------------------------------------------------------------
** Please LIKE 👍, FOLLOW ✅, SHARE 🙌 and COMMENT ✍ if you enjoy this idea! Also share your ideas and charts in the comments section below! This is best way to keep it relevant, support us, keep the content here free and allow the idea to reach as many people as possible. **
-------------------------------------------------------------------------------
💸💸💸💸💸💸
👇 👇 👇 👇 👇 👇
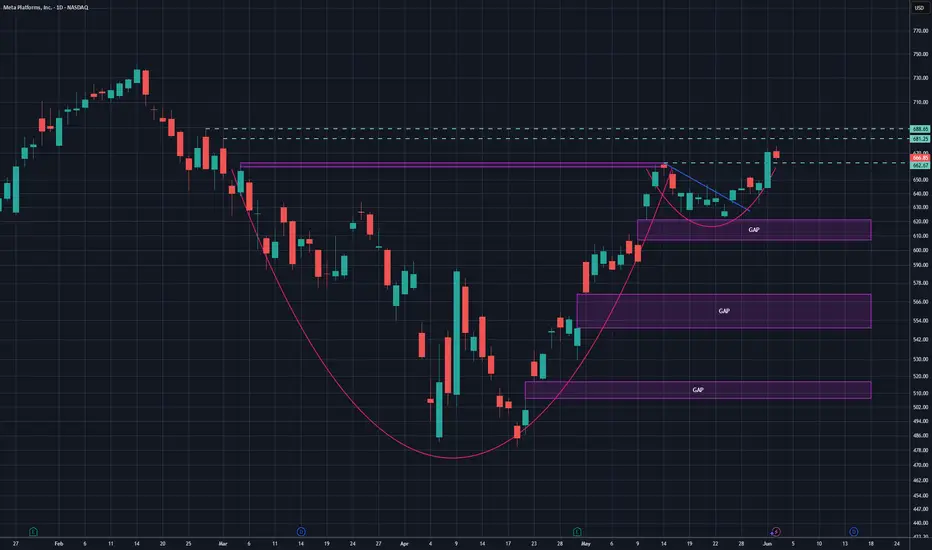
META cup and handle breakout retestMETA daily cup and handle broke out and is trading to a retest of the breakout level at ~662. A hold over 661~663 area confirms the breakout and would be a good location to add longs. The proper measured move would put the price target far past the ATH in the 900s, which I think is a bit excessive in the short term given the current economic and geopolitical climate. My price targets are a bit more conservative, with the first PT at 681.25 and a secondary PT at 688.65.
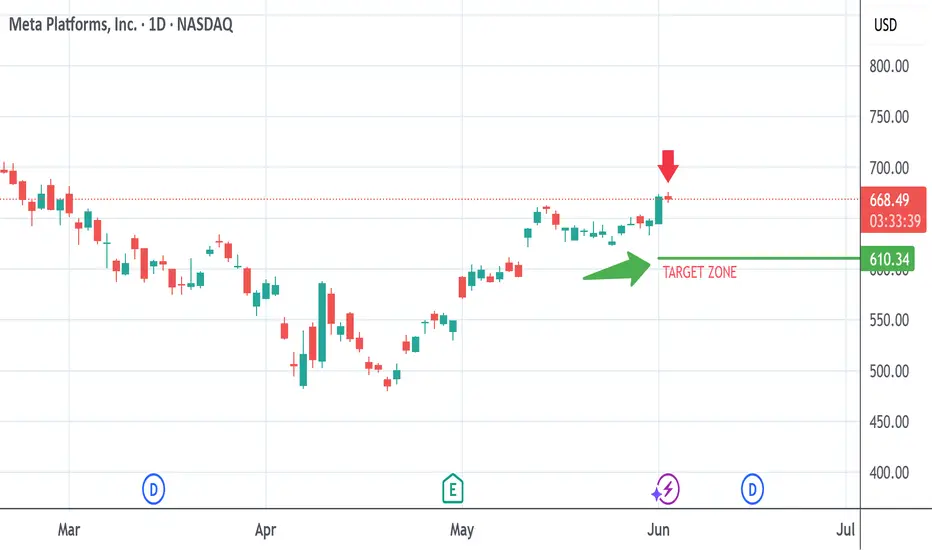
Watching for pullback in METAMETA hit a target area I had on my dowsing work for the upside. Actually, it busted it by $10, but I get that it'll pullback to around the $610 area. There may be some kind of news. I'm unsure if it's specific to META, or the entire market. This would be happening soon. Like, tomorrow. BUT, I've been very wrong before... so if it triggers short, I'd expect it to be a decent move down (over 5%). We'll see.