Nvidia (NVDA) 2025+ Catalysts & Risks: Analyst Views🚀 Nvidia (NVDA) 2025+ Catalysts & Risks: Analyst Views
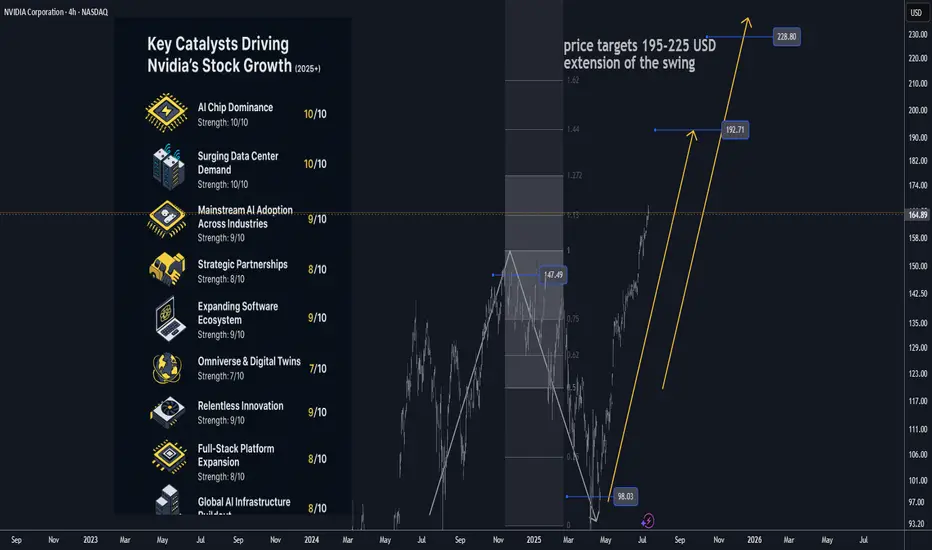
🔑 Key Catalysts Driving Nvidia’s Stock Growth (2025+)
1. 🏆 AI Chip Dominance
Nvidia maintains >90% market share in data-center AI chips (Blackwell, Hopper, Rubin). Its CUDA ecosystem and relentless innovation keep it as the “default” supplier for advanced AI, giving NVDA massive pricing power.
2. 🏗️ Surging Data Center Demand
Cloud and enterprise AI spending remains white-hot. Tech giants (Meta, Microsoft, Amazon, Google) are collectively pouring $300B+ into 2025 AI CapEx. Data center revenues are at all-time highs; analysts expect this uptrend to extend through 2026 as “AI infrastructure arms race” persists.
3. 🌐 Mainstream AI Adoption
AI is now integrated in nearly every industry—healthcare, finance, logistics, manufacturing, retail. As companies embed AI at scale, NVDA’s hardware/software sales rise, with “AI everywhere” tailwinds supporting 15–25% annual growth.
4. 🤝 Strategic Partnerships
Big wins: Deals with Snowflake, ServiceNow, and massive sovereign/international AI collaborations (e.g., $B+ Saudi Arabia/“Humain” order for Blackwell superchips; UAE, India, and Southeast Asia ramping up AI infrastructure using Nvidia).
5. 🚗 Automotive/Autonomous Vehicles
NVDA’s automotive AI segment is now its fastest-growing “new” business line, powering next-gen vehicles (Jaguar Land Rover, Mercedes, BYD, NIO, Lucid) and expected to surpass $1B+ annual run rate by late 2025.
6. 🧑💻 Expanding Software Ecosystem
Nvidia’s “full stack” software (CUDA, AI Enterprise, DGX Cloud) is now a sticky, recurring-revenue engine. Over 4M devs are building on Nvidia’s AI SDKs. Enterprise AI subscriptions add high-margin growth on top of hardware.
7. 🌎 Omniverse & Digital Twins
Industrial metaverse and simulation/digital twin momentum is building (major partnerships with Ansys, Siemens, SAP, Schneider Electric). Omniverse becoming the industry standard for 3D AI/simulation, unlocking new GPU/software demand.
8. 🛠️ Relentless Innovation
Blackwell Ultra GPUs debuting in late 2025, “Rubin” architecture in 2026. Fast-paced, aggressive product roadmap sustains Nvidia’s tech lead and triggers constant upgrade cycles for data centers and cloud providers.
9. 📦 Full-Stack Platform Expansion
Grace CPUs, BlueField DPUs, and Spectrum-X networking mean Nvidia is now a “one-stop shop” for AI infrastructure—capturing more value per system and displacing legacy CPU/network vendors.
10. 🌏 Global AI Infrastructure Buildout
Recent US export rule rollbacks are a huge tailwind, opening up new high-volume markets (Middle East, India, LatAm). Nvidia remains the “go-to” AI chip supplier for sovereign and enterprise supercomputers outside the US, supporting continued global growth.
________________________________________
📈 Latest Analyst Recommendations (July 2025)
•Street Consensus: Overwhelmingly bullish—~85% of analysts rate NVDA as “Buy/Overweight” (rest “Hold”), with target prices often in the $140–$165 range (post-split, as applicable).
•Target Price Range: Median 12-month PT: $150–$160 (representing ~20% upside from July 2025 levels).
•Key Bullish Arguments: Unmatched AI chip lead, accelerating enterprise AI adoption, deep software moat, and a robust international/sovereign AI order pipeline.
•Cautious/Bearish Notes: Valuation premium (45–50x P/E), high expectations priced in, geopolitical and supply chain risks.
________________________________________
⚠️ Key Negative Drivers & Risks
1. 🇨🇳 US–China Tech War / Chip Export Restrictions
• US restrictions: While the Biden administration eased some export bans in May 2025 (allowing more AI chip exports to Gulf/Asia partners), China remains subject to severe curbs on advanced NVDA AI chips.
• Workarounds: Nvidia is selling modified “China-compliant” chips (H20, L20, A800/H800), but at lower margins and lower performance.
• Risk: If US tightens controls again (post-election), China sales could fall further. Chinese firms (Huawei, SMIC, Biren) are also racing to build their own AI chips—posing long-term competitive risk.
2. 🏛️ Political/Regulatory Risk
• Election year: A US policy shift (e.g., harder tech stance after Nov 2025 election) could re-restrict exports, limit new markets, or disrupt supply chains (especially TSMC foundry reliance).
3. 🏷️ Valuation Risk
• NVDA trades at a substantial premium to tech/semiconductor peers (45–50x fwd earnings). Any AI “spending pause” or earnings miss could trigger sharp volatility.
4. 🏭 Supply Chain & Capacity Constraints
• As AI chip demand soars, there’s ongoing risk of supply/delivery bottlenecks (memory, HBM, advanced packaging), which could cap near-term revenue upside.
5. 🏁 Competitive Threats
• AMD, Intel, and custom in-house AI chips (by Google, Amazon, Microsoft, Tesla, etc.) are scaling up fast. Loss of a hyperscaler account or a successful open-source software alternative (vs CUDA) could erode Nvidia’s dominance.
6. 💵 Customer Concentration
• A small handful of cloud giants account for >35% of revenue. Delays or pullbacks in their AI spending would materially impact results.
________________________________________
📝 Summary Outlook (July 2025):
Nvidia’s AI chip monopoly, software moat, and global AI arms race create a powerful multi-year growth setup, but the stock’s high valuation and US-China chip tension are real risks. Analyst consensus remains strongly positive, with most seeing more upside as data-center and enterprise AI demand persists—but with increased focus on geopolitical headlines and potential supply chain hiccups.
________________________________________
NVDA trade ideas
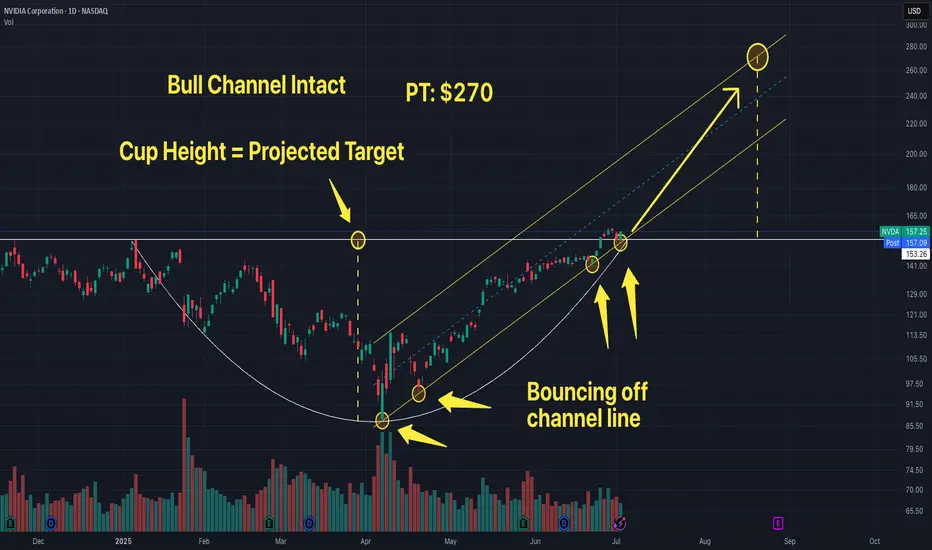
$NVDA - $270 PT in BULL ChannelThe stock is currently bouncing off of the lower channel line of the rising Bull Channel. Price action has created a Cup and Handle. The projected Price Objective sits at around $270. Remember, the height of the cup is the project target which from current stock price extends to around $270.
A bit of profit taking on NVDA and then up again?NASDAQ:NVDA is the most talked about and everyone is capitalizing on that. Let's take a look.
NASDAQ:NVDA
Let us know what you think in the comments below.
Thank you.
75.2% of retail investor accounts lose money when trading CFDs with this provider. You should consider whether you understand how CFDs work and whether you can afford to take the high risk of losing your money. Past performance is not necessarily indicative of future results. The value of investments may fall as well as rise and the investor may not get back the amount initially invested. This content is not intended for nor applicable to residents of the UK. Cryptocurrency CFDs and spread bets are restricted in the UK for all retail clients.

NVDA SELLSELL NVDA at 149.00 to 163.00, riding it back down to 93.00 to 77.00 as Profit Targets, Stop Loss is at 172.00!
If anyone likes long mumbo jumbo garbage analysis, than this is NOT for you.
Also, if you are afraid of risk, failure, and want only a 100% sure thing, than
run as fast as you can from the markets, because the markets are NOT a sure thing,
so it is definitely NOT for you.
WARNING: This is just my opinions of the market and its only for journaling purpose. This information and any publication here are NOT meant to be, and do NOT constitute, financial, investment, trading, or other types of advice or recommendations. Trading any market instrument is a RISKY business, so do your own due diligence, and trade at your own risk. You can loose all of your money and much more.
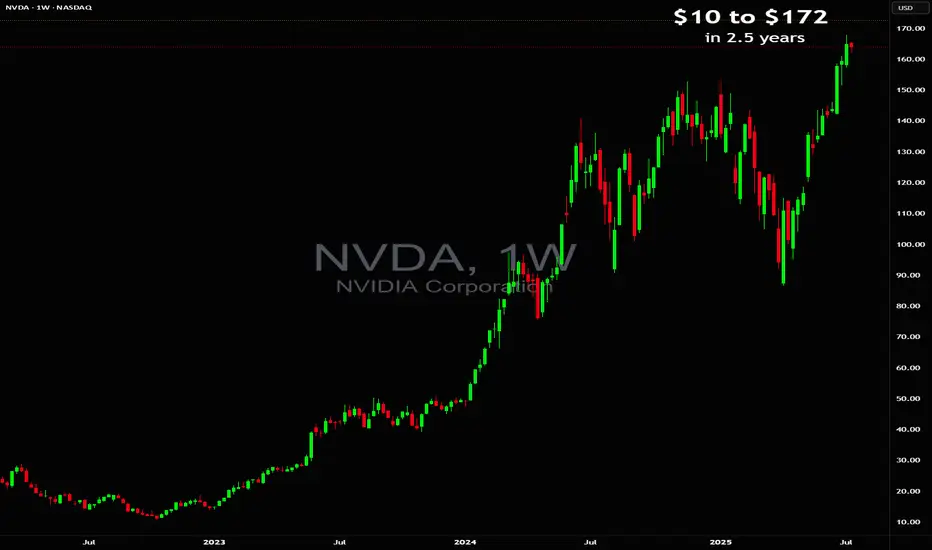
How expensive is Nvidia today?How expensive is NASDAQ:NVDA today?
❗ You're paying $40 today for $1 of next year's earnings
That's what Nvidia's forward P/E 40x means at current $172 per share
AI might be the future but you're prepaying for it like it's 2060 🤖
NVDA - Going VerticalNVDA has continue to see our near vertical trajectory to the upside.
After yesterday's test of our blue trendline on the daily at $160 price bounced and has now moved up to $170.
Due to the angle of this trend we will break to the downside very soon, but most likely not before some sort of blow off top move towards the $200 level. It is possible we continue to go vertical but just below $200 seems to be where the major level is to see some take profit start occurring.
Also market structure has been super strong which you can see by the retest and hold of the $153 level (yellow dotted line). This was the previous ATH that NVDA recently created as a new level of support with that retest.
Nvidia (NVDA) Share Price Surges Above $170Nvidia (NVDA) Share Price Surges Above $170
Yesterday, Nvidia’s (NVDA) share price rose by more than 4%, with the following developments:
→ It surpassed the psychological level of $170 per share;
→ Reached another all-time high;
→ Gained more than 9% since the beginning of the month.
The bullish sentiment is driven by Nvidia CEO Jensen Huang’s visit to China shortly after meeting with US President Trump. At the same time:
→ US Secretary of Commerce Howard Lutnick stated that the planned resumption of sales of Nvidia H20 AI chips in China is part of the US negotiations on rare earth metals.
→ The head of Nvidia stated that he was assured licences would be granted very quickly, and that a large number of orders for H20 chip deliveries had already been received from Chinese companies.
Market participants are viewing the situation with strong optimism, and analysts are raising their valuations for NVDA shares:
→ Morningstar analysts raised their fair value estimate for Nvidia shares from $140 to $170.
→ Oppenheimer analysts increased their target price from $170 to $200.
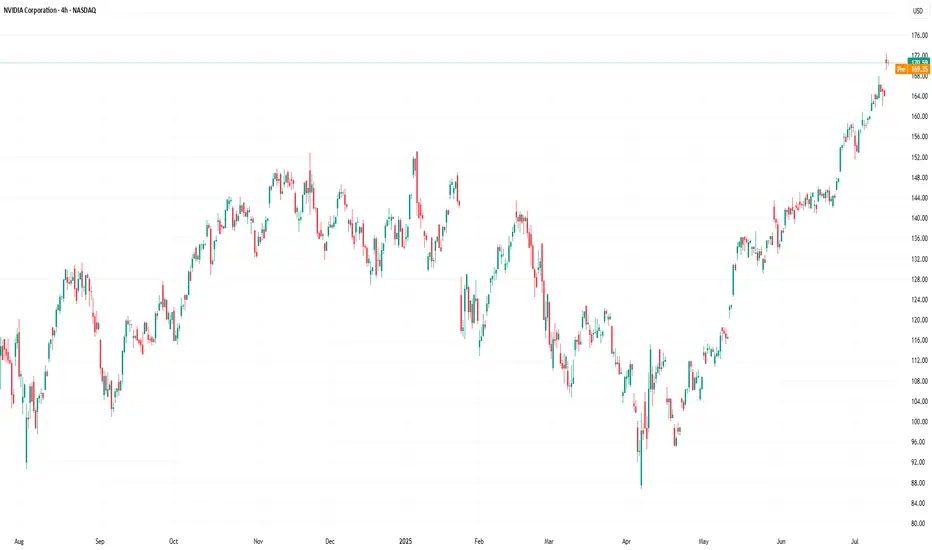
Technical Analysis of the NVDA Chart
The price trajectory of NVDA shares fully reflects the exceptionally strong demand:
→ The price is moving within an ascending channel with a steep growth angle;
→ Since early May, the RSI indicator on the 4-hour chart has not fallen below the 50 level;
→ Yesterday’s trading session opened with a large bullish gap.
The chart also shows the formation of a stable bullish market structure (shown with a purple broken line), expressed through a sequence of higher highs and higher lows.
Given the above, it is difficult to imagine what might cause a sharp shift from positive to negative sentiment. If a correction begins (for example, with a test of the $160 level), traders should watch for signs of its completion — this could present an opportunity to join the emerging rally.
This article represents the opinion of the Companies operating under the FXOpen brand only. It is not to be construed as an offer, solicitation, or recommendation with respect to products and services provided by the Companies operating under the FXOpen brand, nor is it to be considered financial advice.
NVDA SELL SELL SELLSELL NVDA at any price now, riding it back down to 93.00 to 77.00 as Profit Targets, Stop Loss will be determine later!
If anyone likes long mumbo jumbo garbage analysis, than this is NOT for you.
Also, if you are afraid of risk, failure, and want only a 100% sure thing, than
run as fast as you can from the market, because the market is NOT a sure thing,
so it is definitely NOT for you.
WARNING: This is just opinions of the market and its only for journaling purpose. This information and any publication here are NOT meant to be, and do NOT constitute, financial, investment, trading, or other types of advice or recommendations. Trading any market instrument is a RISKY business, so do your own due diligence, and trade at your own risk. You can loose all of your money and much more.
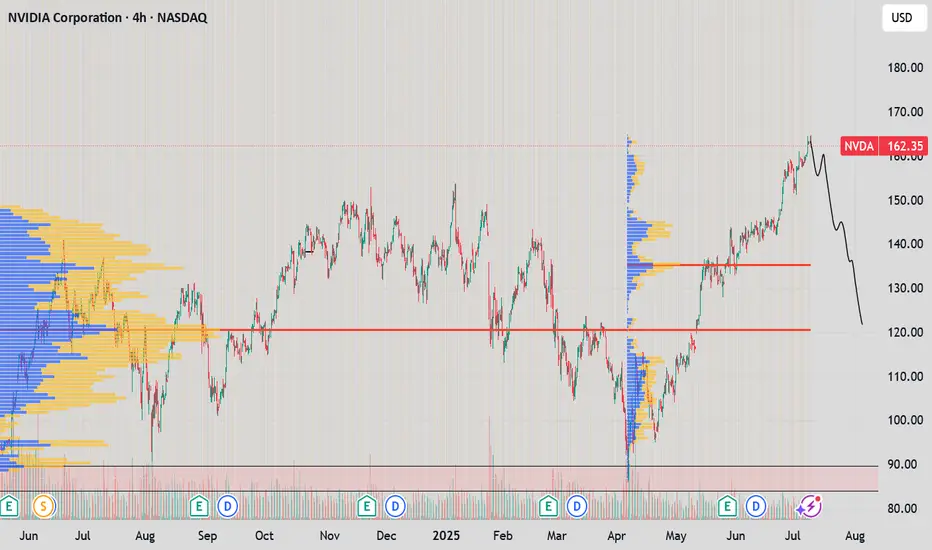
Nvda bearish ideaGiven the recent euphoric blast of NVDA on the AI wave, I'm calling for a deep technical correction. While fundamentals are still there, it shows overvaluation and is in dire need of a cool off period
NVIDIA Robbery Plan: Bullish Swing Trade to Millions!🔥 NVIDIA (NVDA) Stock Heist Blueprint: Unlock Bullish Profits with Thief Trading Style! 🚀💰
🌟 Greetings, Wealth Warriors! 🌟
Hello, Ciao, Salaam, Bonjour, Hola, and Hallo to all you savvy traders and market masterminds! 🤑💸 Get ready to execute a high-octane trading plan with our Thief Trading Style—a bold fusion of technical precision and fundamental insights designed to crack the NVIDIA (NVDA) stock market vault! 💥📈
📝 The NVIDIA Heist Plan: Swing & Day Trading Mastery 🏆
Based on our proprietary Thief Trading Style, this plan targets NVIDIA (NVDA), currently riding a bullish wave fueled by strong fundamentals and technical setups. Follow the strategy outlined below to navigate the high-risk Red Zone—where overbought conditions, consolidation, and potential trend reversals create opportunities for sharp traders. 💪 Stay alert, as bearish players may set traps at key levels! 🕵️♂️
Entry Strategy: Crack the 🙂Vault! 🏦
Go long with confidence! The market is primed for a bullish breakout. Enter at current prices or set buy limit orders near recent swing lows/highs on the 15-minute or 30-minute timeframe. 📅
Pro Tip: Set price alerts on your chart to catch the optimal entry. Timing is everything in this heist! ⏰
Swing Traders: Look for pullbacks to key support levels for safer entries.
Scalpers: Focus on quick long-side trades with tight stops to maximize gains. 💨
Stop Loss: Protect Your Loot! 🔒
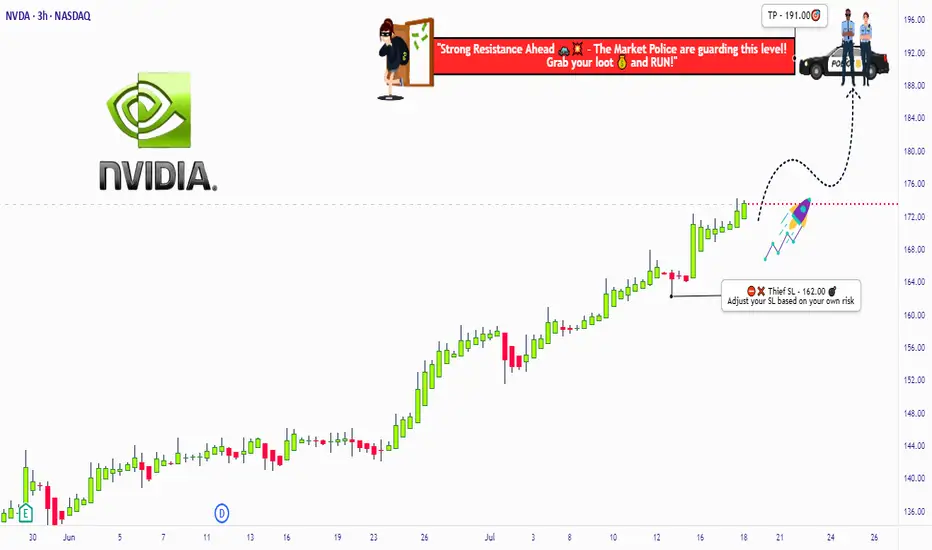
Place your stop loss (SL) below the recent swing low on the 30-minute timeframe (e.g., $162.00 for swing trades).
Adjust your SL based on your risk tolerance, position size, and number of orders. For larger accounts, consider tighter stops to lock in gains early. 🛡️
Scalpers: Use a trailing stop to secure profits while riding short-term momentum.
Take Profit Target: Cash Out Big! 💰
Aim for $191.00 as the primary target, or exit early if momentum slows.
Swing Traders: Hold for the full target if the trend remains strong.
Scalpers: Grab quick profits on smaller price spikes and re-enter on dips.
Pro Move: Use a trailing stop to let profits run while safeguarding gains. 🚀
📌Key Levels & Risk Management
Entry Zone: Market price or swing low – ideal for long positions. 📈
Stop Loss: $162.00 – based on 30m timeframe swing low. 🛑
Take Profit Target: $191.00 – primary target for swing/day trades. 🎯
Risky Red Zone: Overbought levels – watch for consolidation or reversal traps. ⚠️
💡 Why NVIDIA? The Bullish Case 📡
NVIDIA (NVDA) is powering through a bullish phase, driven by:
Fundamentals: Strong demand for AI, gaming, and data center chips. 📊
Macro Factors: Positive market sentiment and tech sector momentum. 🌍
COT Data (Latest Friday Update, UTC+1): Large speculators are increasing bullish positions, signaling confidence in NVDA’s upside (data sourced from reliable platforms). 📅
Geopolitical & News: Monitor upcoming earnings and industry developments for catalysts. 📰
Intermarket Analysis: Tech-heavy indices like the NASDAQ are trending higher, supporting NVDA’s rally. 📈
For a deeper dive, check fundamental reports, COT data, and sentiment analysis to align your trades with the bigger picture. 🔍
⚠️ Trading Alert: Navigate News & Volatility 🗞️
News releases can spark sharp price swings. To protect your capital:
Avoid new trades during major news events (e.g., earnings or Fed announcements). 🚫
Use trailing stops to lock in profits and limit downside risk. 🔐
Stay updated with real-time market developments to adjust your strategy dynamically. 📡
🚀 Boost the Heist! Support the Thief Trading Community 🤝
Love this plan? Hit the Boost Button to amplify our Thief Trading Style and empower our community to conquer the markets! 💥 Every like and share fuels our mission to make money with precision and style. 💪 Join us daily to unlock more high-profit heist plans! 🏴☠️
📌 Important Disclaimer
This analysis is for educational purposes only and not personalized investment advice. Always conduct your own research, assess your risk tolerance, and verify market conditions before trading. Markets move fast—stay sharp and adapt! ⚡
🌟 Stay tuned for the next heist plan, traders! Let’s keep stealing profits together! 🤑🐱👤🎉
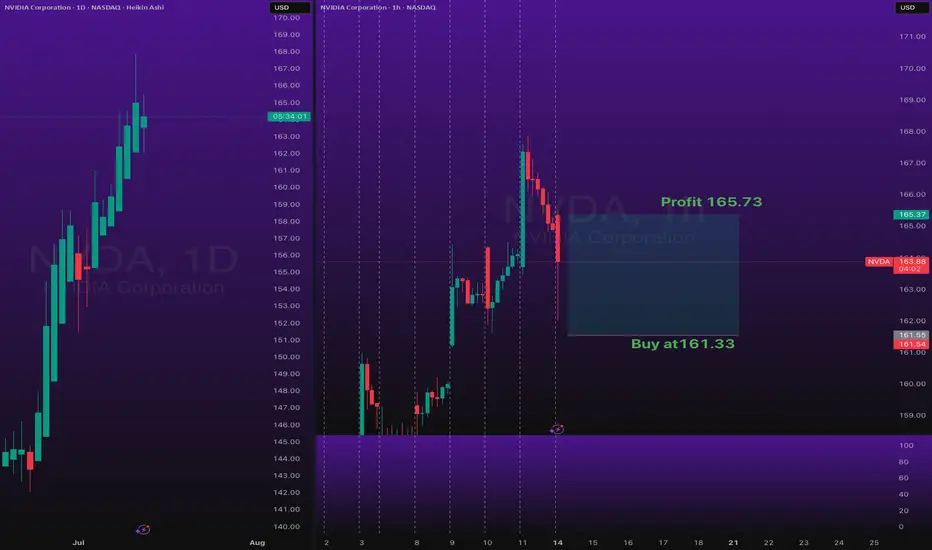
Stocks SPOT ACCOUNT: NVDA stocks Buy Trade with Take ProfitStocks SPOT ACCOUNT: NASDAQ:NVDA stocks my buy trade with take profit.
This is my SPOT Accounts for Stocks Portfolio.
Trade shows my Buying and Take Profit Level.
Spot account doesn't need SL because its stocks buying account.
Nvidia at a CrossroadsNvidia at a Crossroads: Unstoppable Growth, Geopolitical Tensions, and Fears of Talent Drain to China
Ion Jauregui – Analyst at ActivTrades
Nvidia’s rise as a central player in the artificial intelligence revolution has not been a solitary journey. The company, now valued at over $4 trillion, has built a complex network of suppliers, strategic clients, and industrial partners that fuel its growth. However, this success has also placed the firm under the scrutiny of U.S. authorities, especially amid growing fears of knowledge transfer to China.
Washington on Alert: National Security Risks?
The U.S. government has begun to closely monitor the hiring of foreign talent in strategic sectors. One of its main concerns is the potential unintentional transfer of advanced military knowledge to China through engineers working at companies like Nvidia. The company’s chips power everything from data centers to autonomous systems, and part of its strength lies in the know-how contributed by its employees—many of whom are of Asian descent—to the development of these key technologies.
Although the company benefits enormously from hiring highly skilled engineers—many of them trained in U.S. universities—there is concern in Capitol Hill and the Pentagon that some of these specialists, directly or indirectly, could end up collaborating with China’s People’s Liberation Army. The U.S. Department of Commerce and the Pentagon have increased scrutiny of technical staff with links to China, particularly after identifying several cases of dual-nationality engineers involved in sensitive projects. According to intelligence sources cited by outlets such as Bloomberg and The Washington Post, internal investigations have been launched to review hiring policies at key semiconductor companies. There is concern that without stricter measures, U.S. technological know-how—especially related to dual-use civilian-military GPUs—could leak and accelerate the development of Chinese military capabilities, including AI for warfare.
The Ecosystem Powering Nvidia
Nvidia does not manufacture its own chips: it relies primarily on Taiwan Semiconductor Manufacturing Company (TSMC), which produces its most advanced units—such as the H100 and the new B200 Blackwell chips—using 3 and 4 nanometer processes. Pressure from the U.S. government to relocate production led TSMC to build a factory in Arizona as a geostrategic response to ensure supply on American soil.
Additionally, companies like SK Hynix, Micron, Wistron, and Flex form a key supply chain, providing everything from HBM memory to full system assembly. In parallel, Nvidia has accelerated development of the HBM4 chip amid growing competition from new players such as AMD and AI divisions of Chinese firms.
An AI-Powered Empire: Voracious Clients and Strategic Alliances
Meanwhile, Nvidia’s rise has been meteoric. From a napkin sketch in 1993 to a market cap surpassing $4 trillion, the company has gone from revolutionizing video games to becoming the heart of artificial intelligence. The key lies in its GPUs (such as the H100 and the new B200), which power language models like ChatGPT and Llama-4.
Its supplier network includes TSMC, SK Hynix, Micron, and Wistron, while on the demand side, Microsoft, Meta, Amazon, Alphabet, and Super Micro are among the giants boosting its revenue. In fact, Microsoft alone accounts for nearly 19% of Nvidia’s revenue. Microsoft leads with over $29 billion invested, while Meta allocates more than 9% of Nvidia’s total revenue to training its Llama-4 model. Even Amazon, which develops its own Trainium and Graviton chips, continues to purchase Nvidia GPUs due to high customer demand for cutting-edge products.
Now, all hopes are pinned on the new generation of Blackwell chips. The B200 promises performance up to 30 times higher than the H100 in generative AI tasks, positioning it as the new industry standard. But as the market matures, competition, regulation, and geopolitical risks are all intensifying.
Technical Analysis of Nvidia (NVDA)
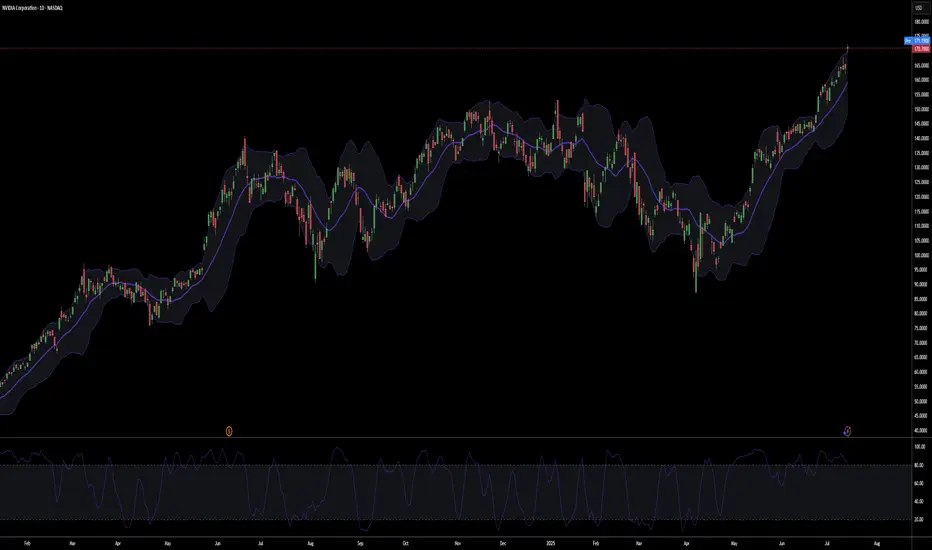
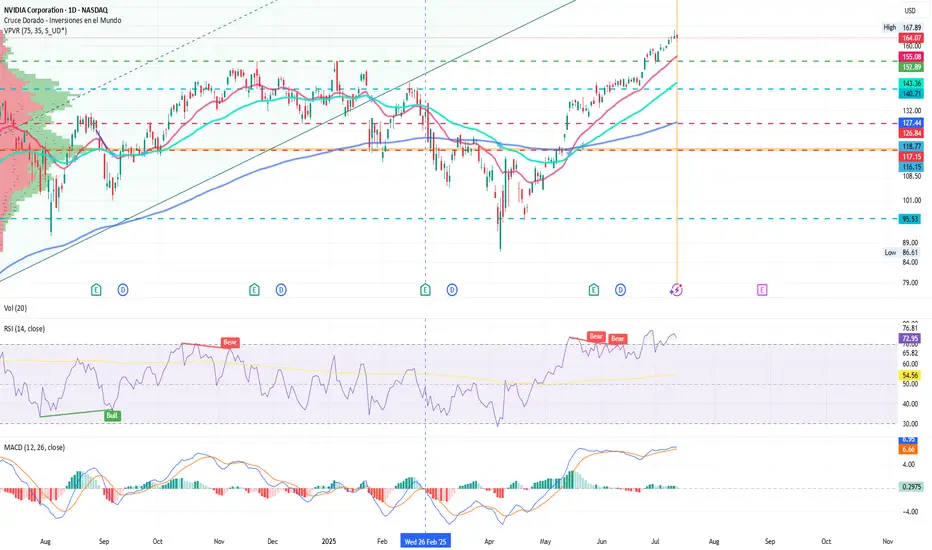
Nvidia (NVDA) shares closed yesterday at $164.07, slightly below its all-time high of $167.89. On the daily chart, we observe a consolidation movement after hitting a new record high on Friday. The price remains within an upward channel that began in January 2024.
Key Support: $141.75 (above the 50-session moving average), a level defended by buyers during recent pullbacks.
Immediate Resistance: $167.89 (all-time high). A breakout with volume could open the door to $180 as the next psychological target.
Technical Indicators:
The daily RSI stands at 72.95%, reflecting strong overbought conditions and suggesting continued buying interest.
The moving averages remain in a wide bullish crossover, with no clear sign of directional reversal.
The volume point of control (POC) sits at $118, at the lower end of the consolidation zone.
The MACD continues in a bullish crossover pattern, although it’s starting to show a loss of momentum. This could signal that the price push is weakening, indicating a bearish divergence between price and volume.
The technical outlook remains bullish, but a short-term pause or sideways movement is not out of the question—especially if regulatory pressure or the next quarterly results fail to meet high market expectations. The key level to watch is around $141 as the structural support to maintain the uptrend.
The Future? A Mix of Innovation and Oversight
Nvidia embodies the spirit of Silicon Valley, but its privileged position also makes it a central piece on the global geopolitical chessboard. While its technology drives scientific, medical, and consumer advancements, its ties to Asia and openness to foreign talent will continue to spark friction with Washington.
The big question is whether it can continue to lead the AI race without destabilizing the delicate balance between national security and technological innovation. Time—and the regulators—will tell.
*******************************************************************************************
The information provided does not constitute investment research. The material has not been prepared in accordance with the legal requirements designed to promote the independence of investment research and such should be considered a marketing communication.
All information has been prepared by ActivTrades ("AT"). The information does not contain a record of AT's prices, or an offer of or solicitation for a transaction in any financial instrument. No representation or warranty is given as to the accuracy or completeness of this information.
Any material provided does not have regard to the specific investment objective and financial situation of any person who may receive it. Past performance and forecasting are not a synonym of a reliable indicator of future performance. AT provides an execution-only service. Consequently, any person acting on the information provided does so at their own risk. Political risk is unpredictable. Central bank actions can vary. Platform tools do not guarantee success.
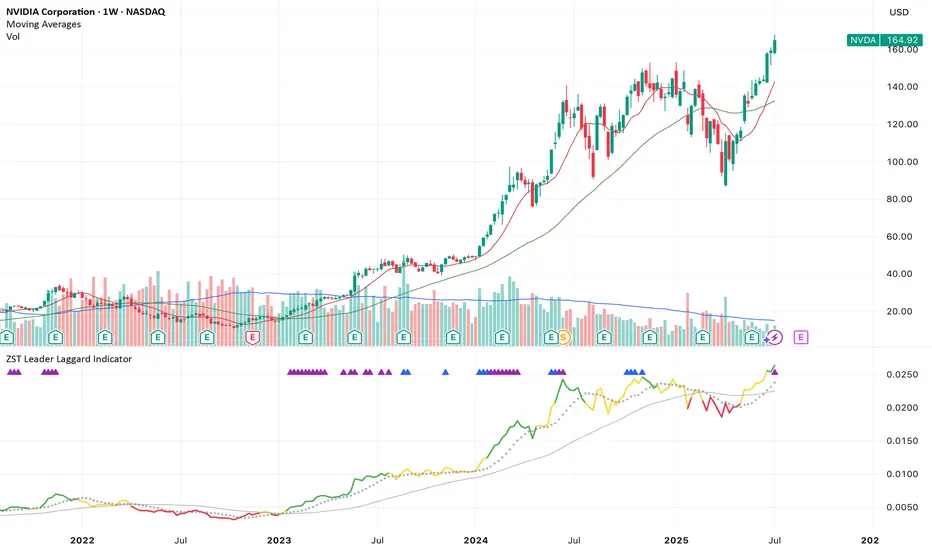
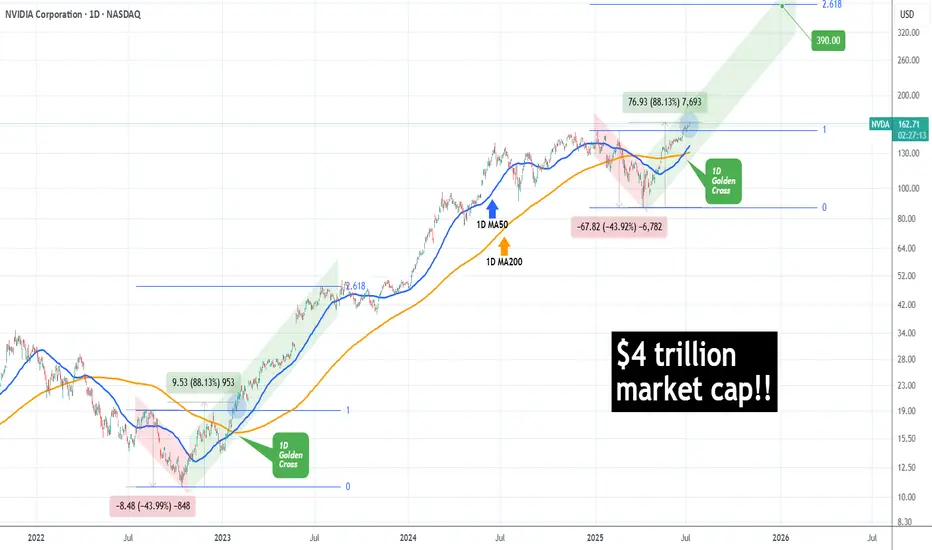
NVIDIA made history! First company with $4 trillion market cap!NVIDIA Corporation (NVDA) became today the first company in history to surpass a $4 trillion market value, as A.I. bulls extended the recent rally and pushed the price past the approximate $163.93 level needed to reach this market capitalization threshold.
The long-term trend on the 1D time-frame couldn't look more bullish. Coming off a 1D Golden Cross less than 2 weeks ago, the price has turned the 1D MA50 (blue trend-line) into Support and sits at +88.13% from the April 07 2025 Low.
This is the exact set-up that the market had when it was coming off the 2022 Inflation Crisis bottom (October 13 2022). As you can see, both fractals started with a -44% decline, bottomed and when they recovered by +88.13%, there were just past a 1D Golden Cross. In fact that Golden Cross (January 24 2023) was the last one before the current.
NVIDIA entered a Channel Up (green) on its recovery and for as long as the 1D MA50 was supporting, it peaked on the 2.618 Fibonacci extension before it pulled back below it.
If history repeats this pattern, we are looking at a potential peak around $390, which may indeed seem incredibly high at the moment, but as we pointed out on previous analyses, the market is in the early stages of the A.I. Bubble, similar to the Internet Bubble of the 1990s.
-------------------------------------------------------------------------------
** Please LIKE 👍, FOLLOW ✅, SHARE 🙌 and COMMENT ✍ if you enjoy this idea! Also share your ideas and charts in the comments section below! This is best way to keep it relevant, support us, keep the content here free and allow the idea to reach as many people as possible. **
-------------------------------------------------------------------------------
💸💸💸💸💸💸
👇 👇 👇 👇 👇 👇
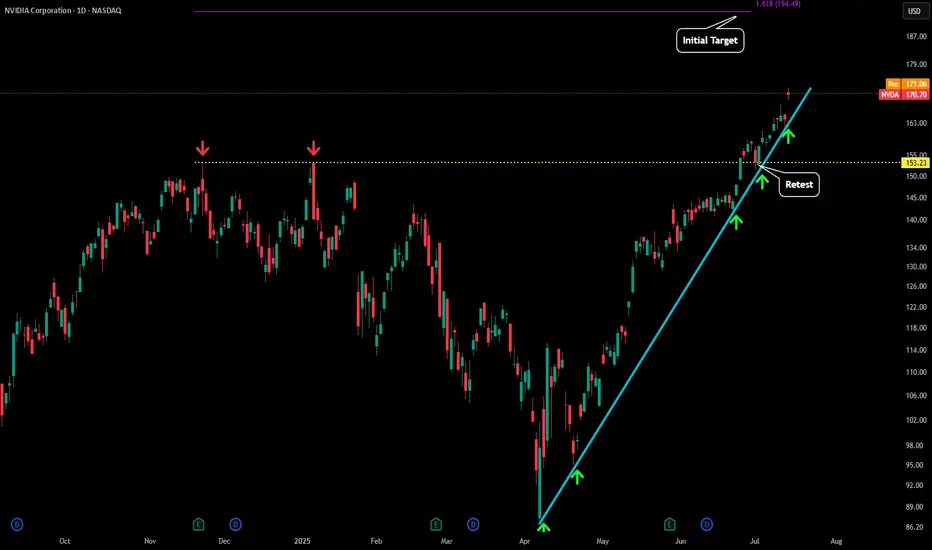
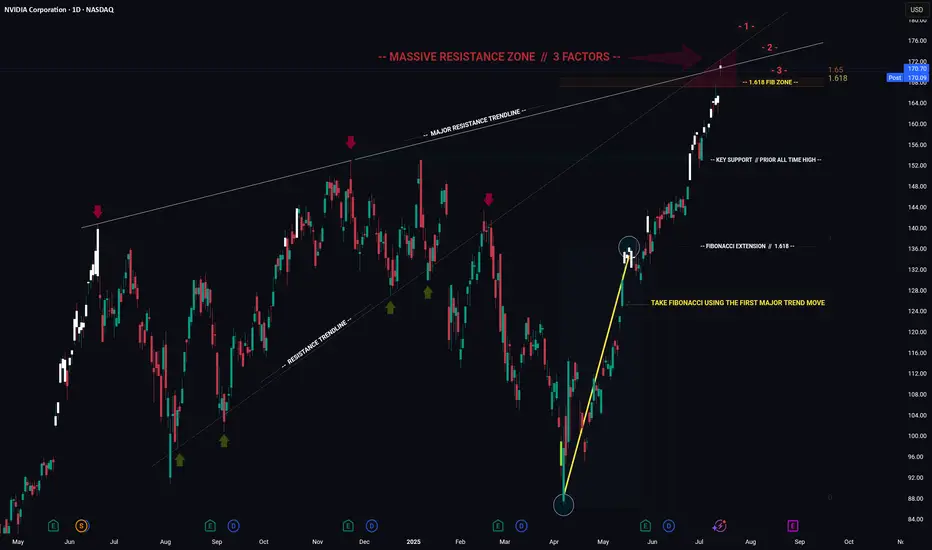
NVIDIA -- Major Resistance // Confluence of 3 FactorsHello Traders!
WOW... This chart is quite incredible I must say.
It's amazing how price is currently at an exact point where 2 major trendlines converge which also nearly coincides with the 1.618 Fibonacci extension. Price closed almost to the penny just above the major trendline connecting the prior highs. It will be very interesting to see what price does over the next few days.
What Does These Converging Trendlines Mean?: Think of a trendline like a wall... Depending on how "strong" the trendline is, this wall could be made from wood all the way through to vibranium straight from Captain Americas shield! These two trendlines converging would likely resemble a steel wall and would be extremely hard to penetrate. (Although there are no gurantees in trading)
What To Watch For: I will be watching to see if price can both break and confirm above both resistance trendlines. It will take MEGA buying pressure to accomplish this and would likely mean continuation to the upside. If price cannot break and confirm above then we will likely see a large retrace to support.
Thanks everyone and best of luck on your trading journeys!
Speculative advice I don’t think Mr burry was ready or sold too soon. I still see a bit more potential from NVDA…I too will be leveraging on some puts near the top. NFA only trade what you can afford to lose. Remember to leave me your comments 📝
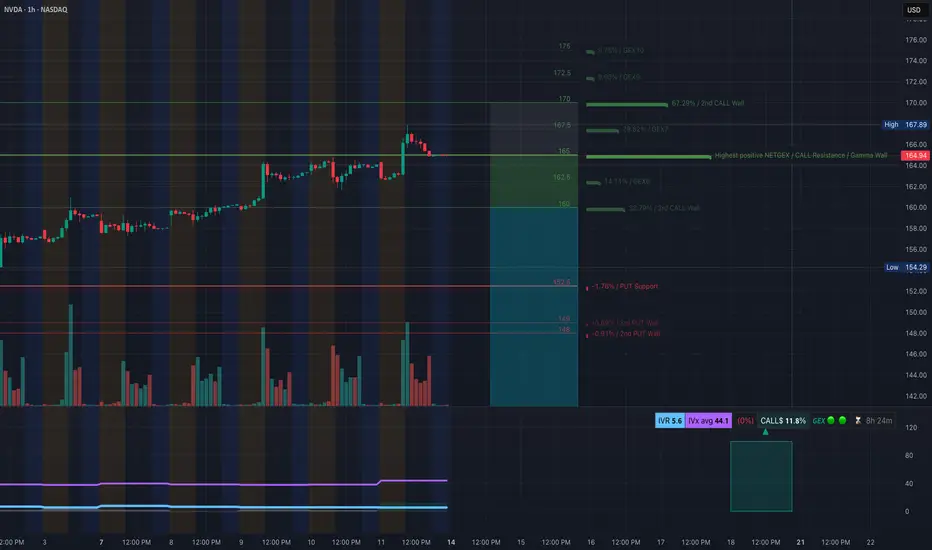
NVDA GEX Options Sentiment Analysis for July 14🧠 GEX Breakdown
* Key Gamma Resistance (Call Wall):
* $164.94 → Highest NET positive GEX (Gamma Wall) – Major resistance where market makers start hedging against further upside.
* $167.89 (local high) → aligns with 1st rejection wick.
* $170 → 2nd CALL Wall (67.29%) – max squeeze potential if $165 breaks with volume.
* Call Side Build-up:
* $167 – 20.62%
* $170 – 67.29%
Stacked CALL walls above = gamma trap if breached, but tough resistance ahead.
* Put Support Walls:
* $152.50 – Strongest downside gamma support
* $148–149 – Layered 2nd/3rd PUT Wall zone
📊 Options Flow Insights
* IVR: 5.6 (very low) → cheap premiums, low expected move
* IVX avg: 44.1
* Call/Put Bias:
* Calls: 11.8% dominance
* GEX Sentiment: ⚠️ Bearish Reversal Risk (high call saturation at resistance)
✅ Suggested Option Plays (Based on GEX Only)
🔸Bearish Rejection Play
* If NVDA rejects $164.94–$165.20 zone (Gamma + Supply confluence):
* Buy puts targeting $160 or $158
* Trade idea:
* Buy: NVDA 160p (Jul 19 expiry or same week)
* Entry: If price stalls/rejects $164.90–$165.20
* Target: $161 → $158
* Stop: Close above $166.00
🔸Bullish Gamma Squeeze (Only if $165 Breaks Cleanly)
* If price breaks and holds above $165.50 with strength
* Buy calls targeting $170 (2nd CALL Wall)
* Trade idea:
* Buy: NVDA 170c (Jul 19 or 26 expiry)
* Entry: $165.60+ breakout + strong volume
* Target: $169–$170
* Stop: Below $163.80
🕯 1-Hour Chart – Price Action Analysis
Market Structure
* CHoCH → BOS → BOS → creating a clear bullish leg, but current supply box at $165 is rejecting price short term.
* Trendline support: Still holding from July 8 lows
* Liquidity zone: $160.96–$161.10 (first demand zone)
Current Setup
* Price is hovering under supply zone + GEX wall → indicating indecision or potential short-term top
* MACD weakening + volume declining = possible pause or reversal
* Clean higher-low structure still intact for now
🎯 Trade Plan Based on 1H Chart
🟢 Bullish Intraday Plan
* Entry: $161.00–$160.50 demand block
* Confirmation: Bullish engulfing or rejection wick
* Target: $164.94 then $167
* Stop-loss: Below $159.80
🔴 Bearish Intraday Plan
* Entry: $164.90–$165.20 inside supply
* Confirmation: Weakening candle (doji or long wick) + no breakout
* Target: $161.00 then $158.80
* Stop-loss: Above $166.10
✍️ My Thoughts
NVDA is coiling just under a heavy GEX resistance wall. If $165 can't break, downside correction to $161–$158 is probable. GEX suggests sellers may be in control unless bulls force a gamma squeeze over $165. Stay patient — let the levels react.
This breakdown is for educational purposes only and not financial advice. Always manage your risk.
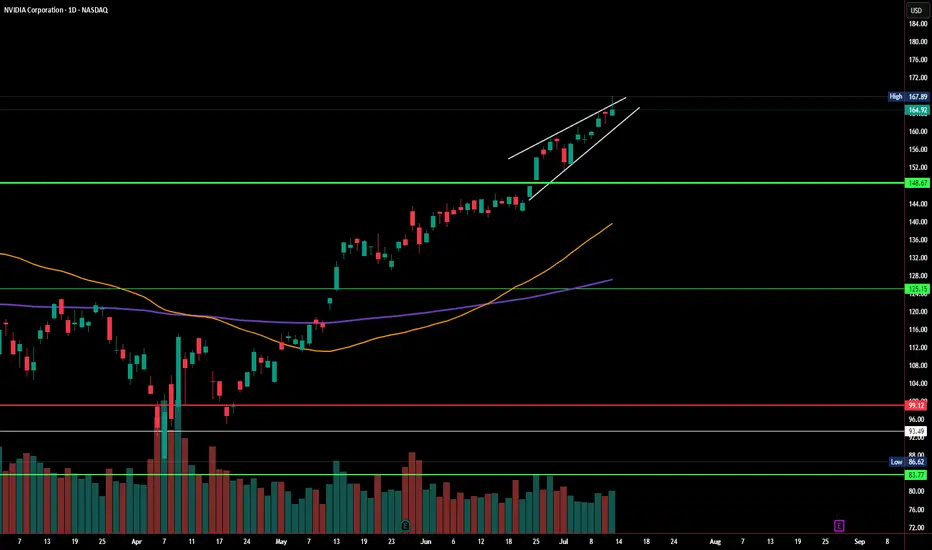
NVDA Daily Chart – Rising Wedge Alert!Just analyzed this NVDA setup. We’re seeing a clear rising wedge forming near the top of a strong run-up — typically a bearish reversal pattern. Price tagged $167.89 and pulled back slightly, closing at $164.92.
If this breaks down, watch the $148.67 - 151.31 area, and below that $125 as a key level. Bulls want to see a strong hold and breakout above $168 to invalidate the wedge.
#NVDA #NVIDIA
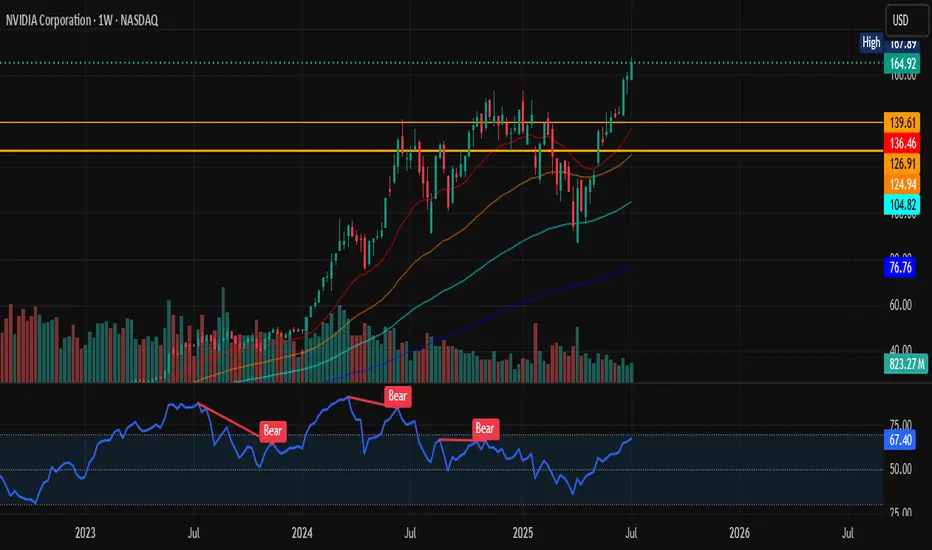
NVIDIA Technical Breakdown NASDAQ:NVDA has broken above the previous congestion/resistance zone (~$139–$145). This zone was tested multiple times and now acts as a support base.
Volume on the breakout week is strong and supporting the move.
Weekly RSI is 67.40, approaching overbought but NOT YET overheated (no bearish divergence). RSI broke past prior Bear zones, signaling renewed strength. Only time will tell.
All-time high territory so proceed with caution. Always due YOUR OWN research.
Bullish long-term trend intact as price is above all EMAs (not too shabby).
I wouldn't be surprised for a pull back soon; maybe 145ish.
Happy Sunday ya'll!
**As always: this isn't financial advice. Please seek professionals on any investments.
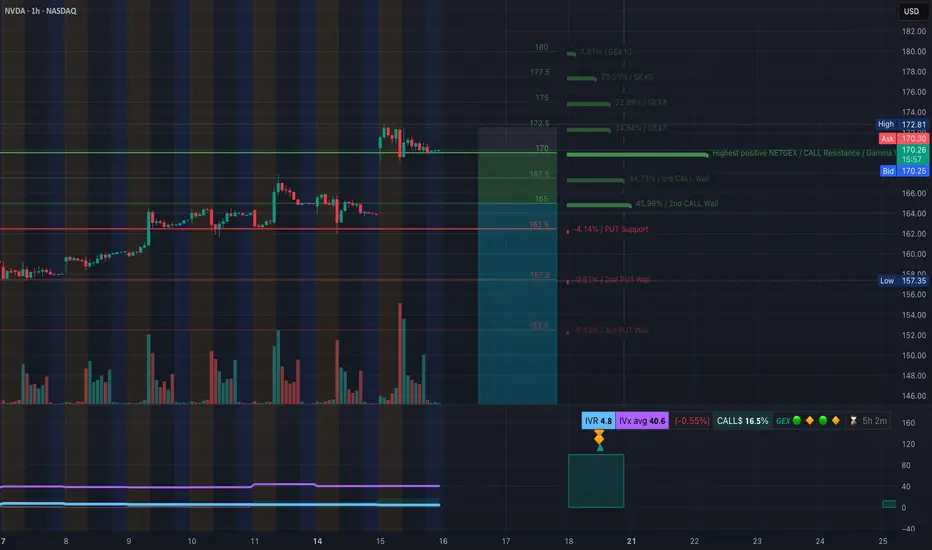
NVDA Bulls in Control Above $170? TA for July16Options Flow and Technical Setup🔥
🧠 GEX & Options Flow Analysis
* GEX Map Summary:
* Highest Call Wall & Gamma Resistance: $172.50
* Major GEX Clusters: $175–$178 → Layered GEX zones, strong positive sentiment
* PUT Support: $162.5 — This is the highest negative NetGEX zone and key downside defense
* IVR: 4.8 (Low)
* IVx: 40.6 (Decaying vol environment)
* Options Skew: 16.5% CALL-dominant bias — Traders leaning bullish.
🧩 Options Trading Suggestions:
* Bullish Play (Preferred Bias):
* Above $170, bulls can look for a push into $172.5 → $175 range.
* Suggested Strategy:
* Buy: $172.5 or $175 CALL (0DTE or 7/19 expiry)
* Condition: NVDA must hold above $170.00 on pullbacks
* Risk: Use $167.5 as a mental stop
* Target: $175–$178 possible gamma magnet if volume kicks in
* Bearish Hedge (if 170 fails):
* Below $167.5, NVDA could revisit $165 or $162.5 PUT wall
* Put Entry Idea: $165 PUT (7/19)
* Only if price shows CHoCH + BOS confirmation
🧠 1H Chart + SMC Price Action Breakdown
* Market Structure: BOS continuation → price consolidating below BOS high
* Current Box: NVDA trapped in a tight SMC range between $167.89–$172.81
* CHoCH Zone: None yet. We’re in a healthy bull flag consolidation pattern
🔍 Trading Scenarios:
* Bullish Setup:
* Wait for breakout above $172.5
* If price closes above and retests → long to $175, $178
* Alternatively, accumulate calls if price bounces from $170 with strength
* Bearish Setup:
* Watch $167.89 → a CHoCH and BOS below this opens $165, $162.5
* Be cautious: this is a bullish structure unless macro news hits
✅ Final Thoughts:
NVDA remains one of the strongest charts on the board. The consolidation under $172.5 is healthy, and GEX flow shows bullish momentum building. As long as $170 holds, this setup favors long trades, especially toward $175–$178.
Disclaimer: This analysis is for educational purposes only and not financial advice. Always do your own due diligence and manage risk properly.
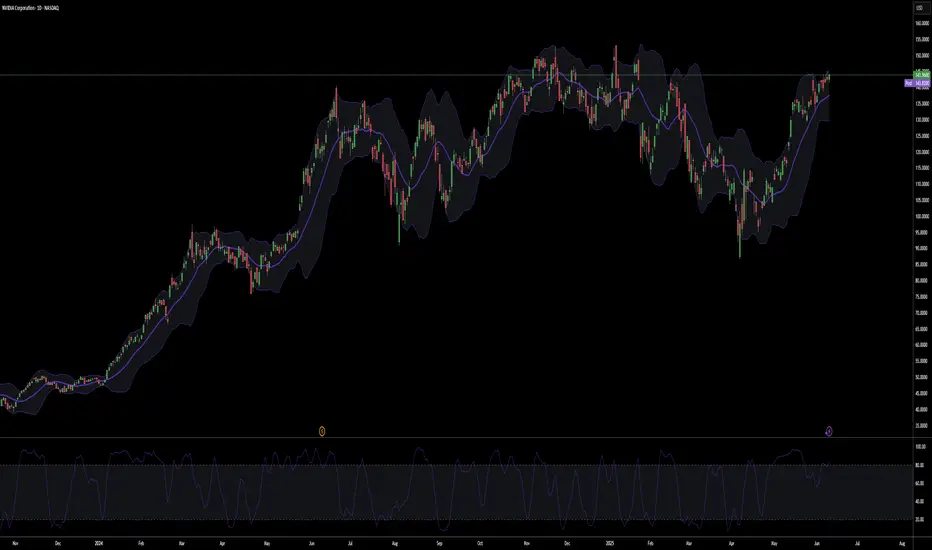
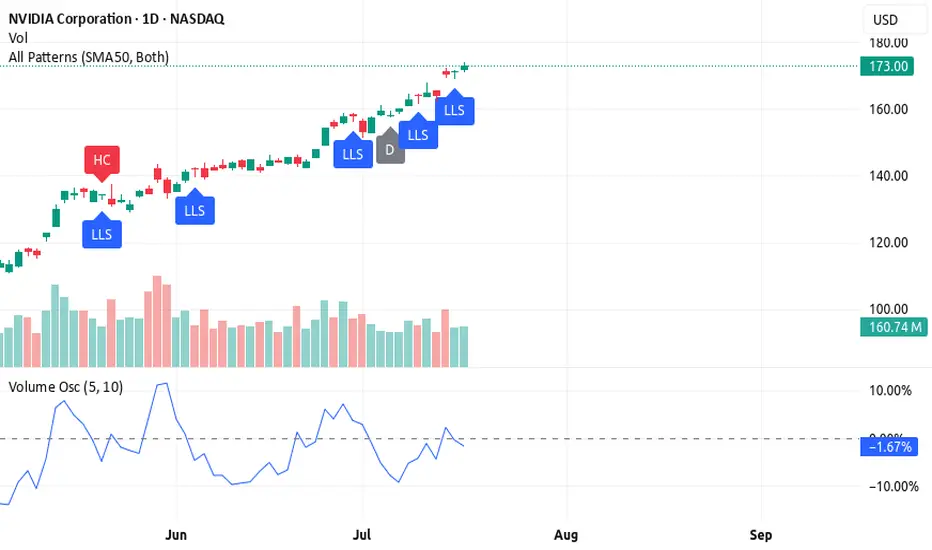
3 Reasons Why Nvidia (NVDA) Looks Bullish Right Now🚀 3 Reasons Why Nvidia (NVDA) Looks Bullish Right Now
Nvidia is showing strong signs of a bullish breakout. Here are 3 solid technical reasons why NVDA could be ready to lift off 📈
1️⃣ Candlestick pattern – long lower shadow
The long lower shadow signals buyers stepped in after early selling pressure. This shows strong demand at lower prices — classic bullish behavior.
2️⃣ High daily volume
Nvidia is trading on increased volume today, confirming that big players are active. High volume validates the price action and increases the reliability of the bullish setup.
3️⃣ Reversal on the volume oscillator
The volume oscillator is reversing from below zero, signaling momentum may be shifting back to the bulls. This indicates a potential trend change just before a new rally begins.
🔥 Bonus: Rocket Booster Strategy
NASDAQ:NVDA fits the Rocket Booster Strategy:
Price is above the 50 EMA
Price is above the 200 EMA
A recent gap up confirmed by candlestick support
When all these factors align, it’s like lighting the engines for a bullish liftoff.
Rocket boost this content to learn more
---
⚠️ Disclaimer: Always use a simulation (demo) account before trading with real money. Learn proper risk management and profit-taking strategies to protect your capital.
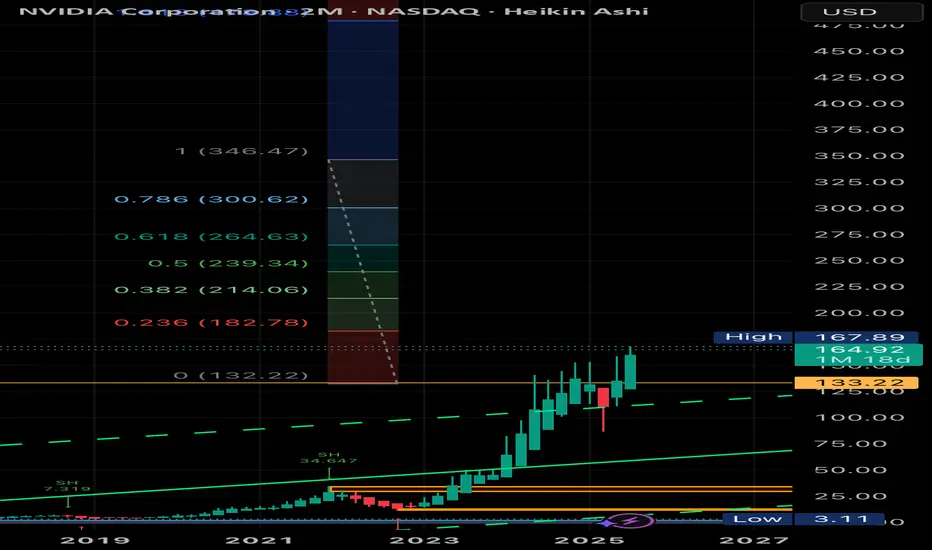
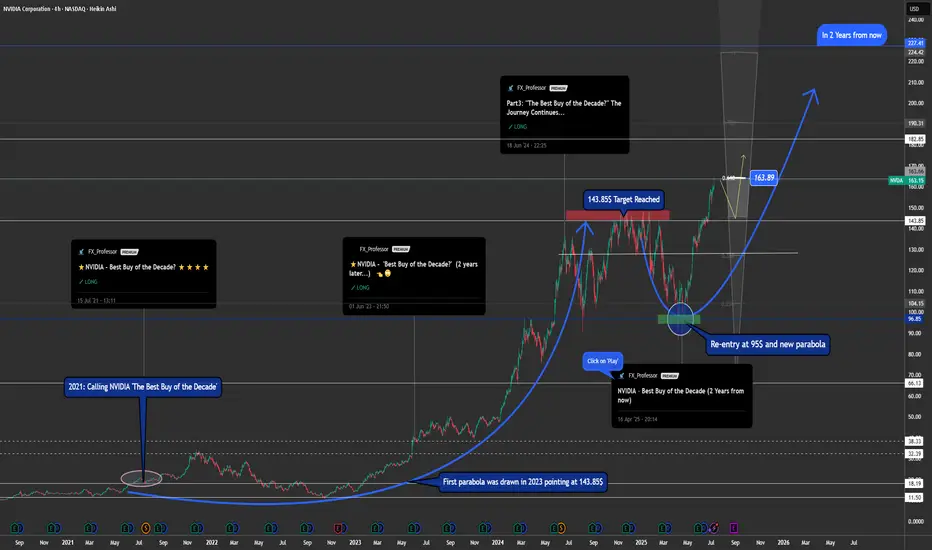
NVIDIA – Best Buy of the Decade (4T Record but now resistance)🚀🔥 NVIDIA – Best Buy of the Decade Post #6
💡📉 Great but why am I taking half profits Today?
Back in July 2021, I named NVIDIA "The Best Buy of the Decade. " Today, it just hit a mind-blowing milestone — becoming the first company to reach a $4 trillion market cap. But here's the thing... that happened right at major resistance.
From our initial call in 2021 , to the target at $143.85 drawn via parabola in 2023, to the April 2025 re-entry at $95, it’s all on the chart — and it's been a textbook ride so far.
At the current level of $163.89, we’re pressing into serious overhead resistance. This doesn’t mean the story is over — not even close. But it could mean we take a breather before the next leg higher.
🧭 Targets ahead remain unchanged:
🔹 First stop: $182.85
🔹 Long-term vision: $227.41
What started as a bold macro call in 2021 has now become a multi-year thesis with precision updates along the way. This is post #6 in the NVIDIA journey — and if you scroll back through the chart, each piece has built on the last with clarity and conviction.
🎯 NVIDIA is not just a tech stock — it’s the AI backbone. But every cycle has pauses, and this one looks ready for a short rest before we see the next breakout.
Stay sharp, follow the structure, and honor the parabola.
One Love,
The FX PROFESSOR 💙
Additional info, for those who like to dive deeper into NVDA:
🔍 Technical Breakdown Version
For the chartists and structure followers, here’s the breakdown:
📌 2021: Original call — "Best Buy of the Decade"
📌 2023: First parabola plotted, projecting toward $143.85 — target hit precisely
📌 April 2025: Market offered $95 re-entry — second parabola begins
📌 Now: Price sits at $163.89, testing resistance from both structure and Fibonacci
📌 Next levels:
- $182.85 → Key extension level
- $227.41 → Long-term target based on full parabolic arc
Current structure suggests a possible pause before continuation. No need for panic — parabola remains valid unless structure is broken. Volume still supportive, and price action is following projection beautifully.
🧠 AI Macro Narrative Version
The big picture? NVIDIA isn't just another semi stock — it’s the nervous system of the AI revolution.
From gaming → crypto → AI, NVIDIA has consistently been first to adapt, and now it’s the leader in AI hardware infrastructure. The $4 trillion milestone is more than symbolic — it represents capital reallocation toward AI as the next dominant sector.
🧠 Key macro takeaways:
AI demand is insatiable
Data centers need NVIDIA
Generative AI isn't slowing down
Institutions are still buying — not selling
The resistance we see now isn’t weakness — it’s the market pausing to digest before another acceleration. Just like every past cycle... we ride, retrace, reload, and resume.
Disclosure: I am happy to be part of the Trade Nation's Influencer program and receive a monthly fee for using their TradingView charts in my analysis. Awesome broker, where the trader really comes first! 🌟🤝📈
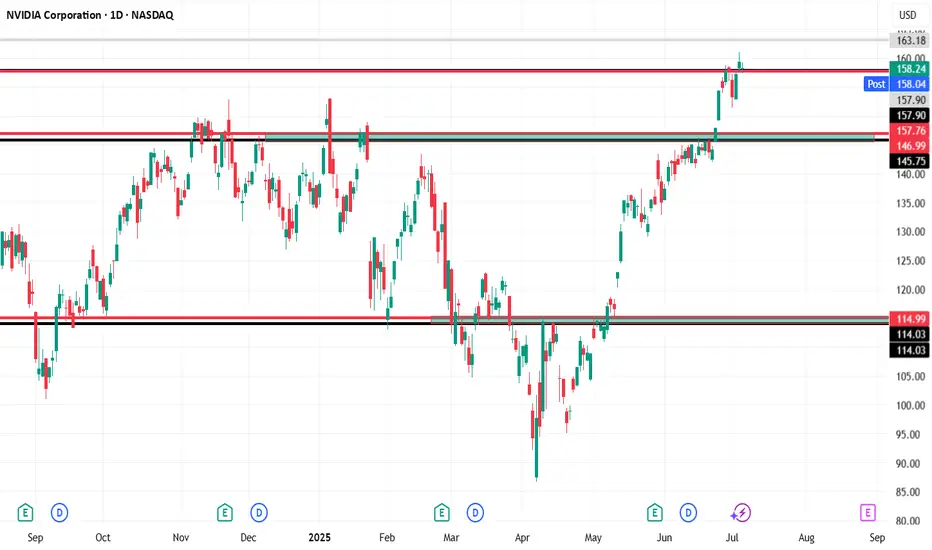
NVDA📊 NVIDIA (NVDA) – Daily Chart Technical Analysis
Entry Point:
A long position is considered at $158, assuming the price holds above $157.78.
Resistance & Target:
The first target is set at $163, which is a clear resistance zone on the chart based on historical price reactions.
If momentum continues beyond that, higher targets could be considered in future analysis.
Stop Loss:
A tight stop-loss is placed just below key support at $157 to manage risk.
🔄 Weekly Bearish Scenario:
If the price closes below $157, this invalidates the bullish setup:
The first downside target would be $146, which is a previously established support zone.
A further drop could extend toward $115, especially if broader market weakness or sector rotation occurs.
📌 Key Technical Zones:
Support Zones: $157.78, $157.00 (critical for bullish continuation)
Resistance Zones: $158.12, $163.18
Multiple historical rejections and price consolidations are noted near these zones, highlighting their significance.
Summary:
As long as NVDA remains above $157.78, the outlook remains bullish targeting $163. However, a confirmed breakdown below $157 could shift the sentiment sharply bearish, targeting $146 and possibly $115.