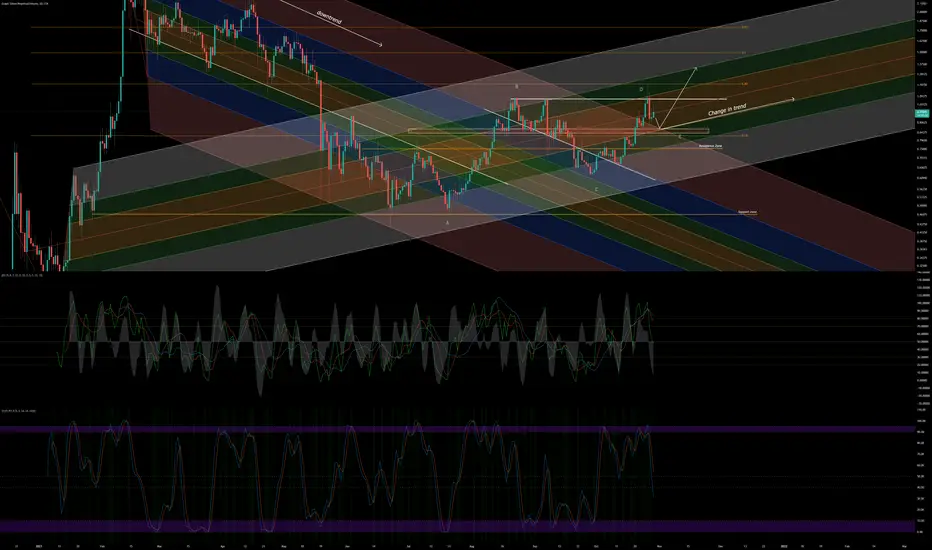
GRT.USDT (Y21.P6.E1).Change in trendHi All,
Its been a while since I have used pitchfork and it seems GRT has the perfect alignment.
Now that its broken the 200% level (red zone), its confirmation of trend change.
I see the ideal entry with a pullback as per indicators suggest to my liking of testing the top of the channel of the pitchfork.
We also have alignment with a structure of ABCDE as per elliot wave structure.
The daily stoch RSI will assist in finding an entry and we have also picked our spot that makes sense.
IF both align, its a good signal to enter.
I will be using my phx indicator to see confluence as well.
All the best.
S.SAri
GRTUSD trade ideas
Update on my 450% idea-- DISCLAIMER --
I AM NOT A FINANCIAL ADVISOR, DO YOUR OWN RESEARCH. THIS INFO FOR ENTERTAINMENT PURPOSES ONLY.
--
Hi there, I have a small update on my chart that kind of changes my expectations for the shorter term, however I think the
4.5 price target is still valid.
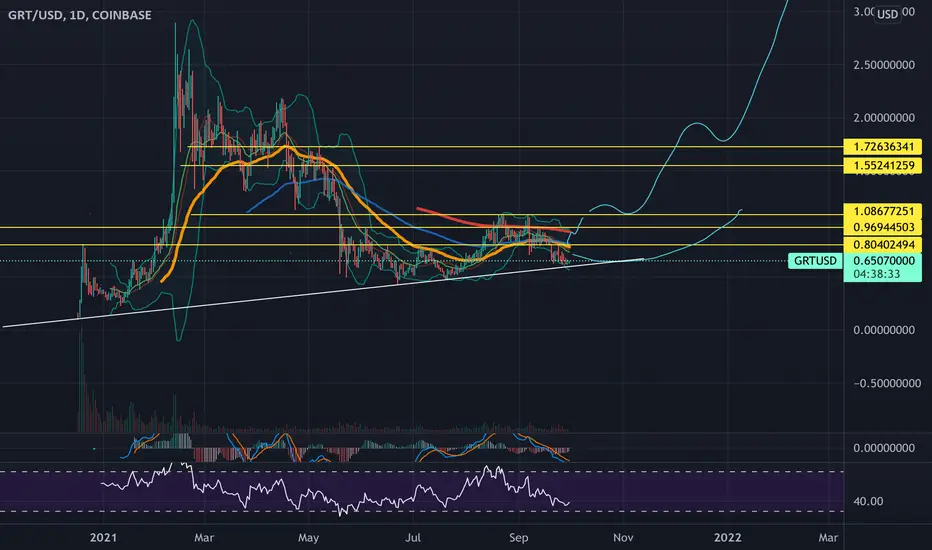
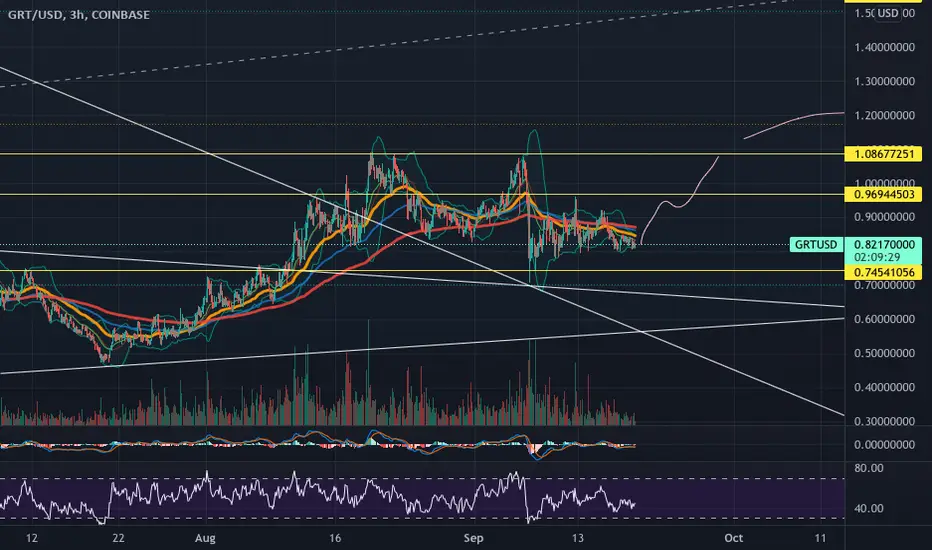
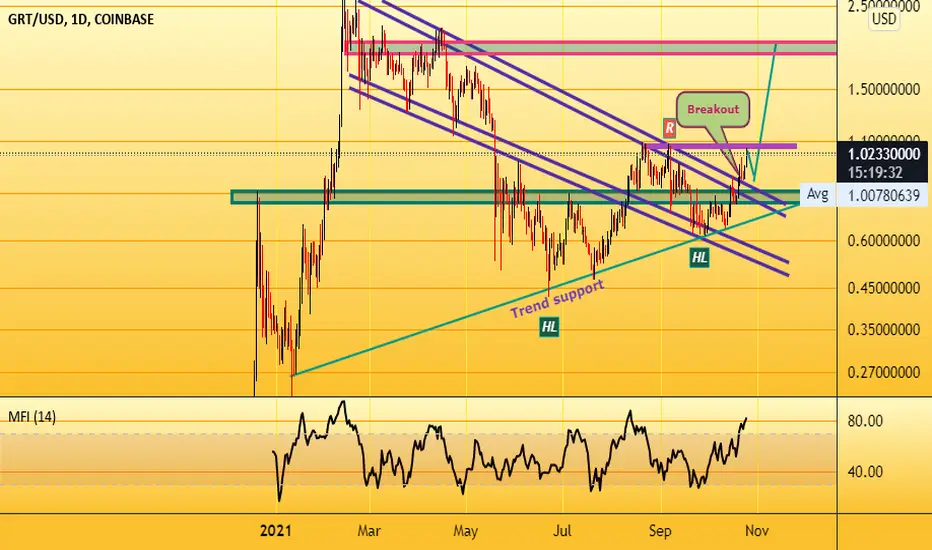
Today, The Graph was rejected at the previous support turned resistance (I drew it in orange and blue, so you can see it) and looks like
it is heading lower to .8 then bounce off of the bigger support line (lower green one) then move toward $1.5 for starters, unless it can
manage to break resistance at $1.03 in which case there won't be a pull back to such low level.
We can also see an ascending triangle taking form between the bigger green support line and the resistance drawn in orange/blue, so for
me, however you look at it, it is extremely bullish. If it goes to $.8 I will definitely be buying more, and I will be buying more
if it breaks resistance this week and retests the resistance as support.
Thanks a lot for your time, I hope you like and agree with my idea, please let me know what you think, your feedback is much appreciated.
Bye bye

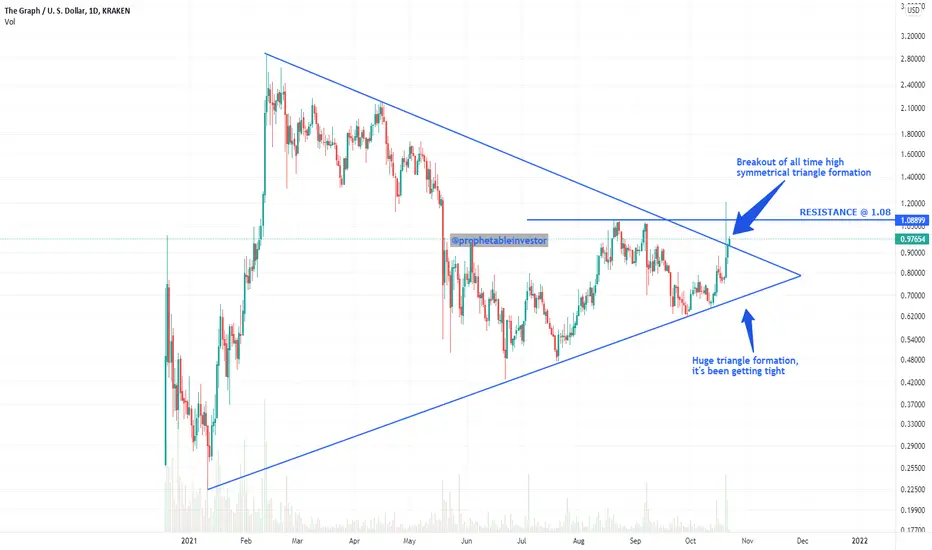
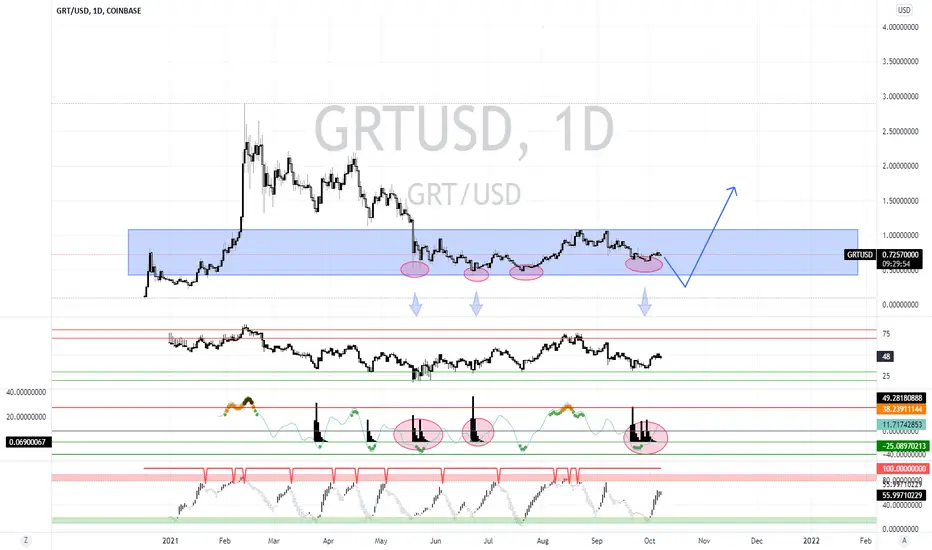
GRTUsd Clear breakout spotted looking for a targetHi everyone,
Grt has been a project with strong fundamentals and it has previously shown exponential price hike. It was in consolidation for a long time but now it has clearly broken out of its downtrend.
A major Suport trendline was held properly along with horizontal support.
The First target is at 2 dollas.
A higher low s are clearly intact, all we need is a high and a Higher High
Currently Rsi on daily is overextended which can result in a pullback for a better buy.
Also keep an eye on a 1 region, if it gains strength from dollars we can expect that 1 dollars has become strong support and it will look for 2, 3 and finally a 5 dollar target in medium term.
On the bearish side, if market declares this as a fakeout and return back inside the breakout trendline, time to exit as we might see a strong correction which is less likely at this stage.
Best of luck
Please like and subscribe for more analysis
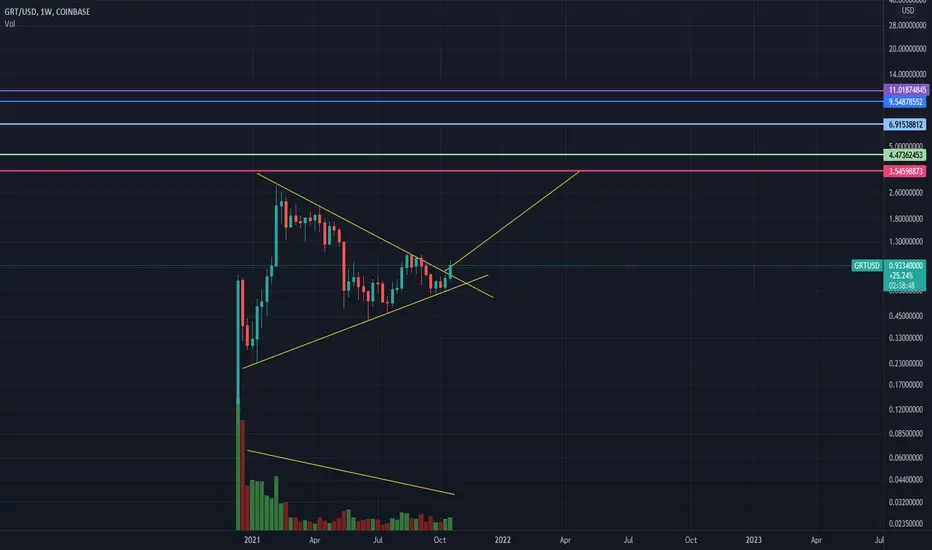
Massive 450% move incomingThe Graph keeps making higher lows and a massive move to the upside (450%) is projected
by measuring the distance between the first low and first high on this symmetrical triangle.
The world is changing and you should too.
Get in now or cry later.

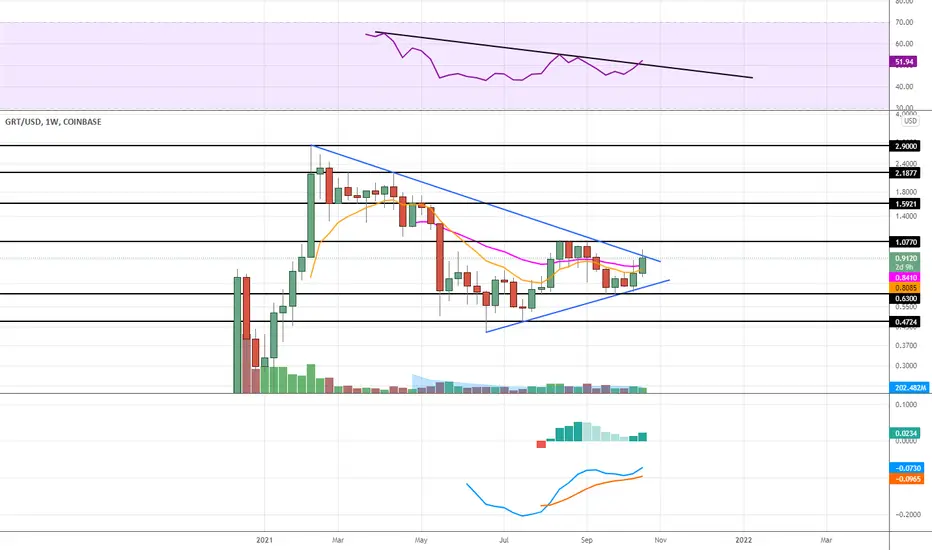
BULLISH GRTI am currently very bullish on GRT as it looks like its just about to begin its weekly climb to 3.50. Nice symmetrical triangle on declining volume and its a weekly formation. The close tonight should begin our ascent.
GRTUSDT at the decision pointThe price consolidation reaches to important area. Just wait for clear breakout.

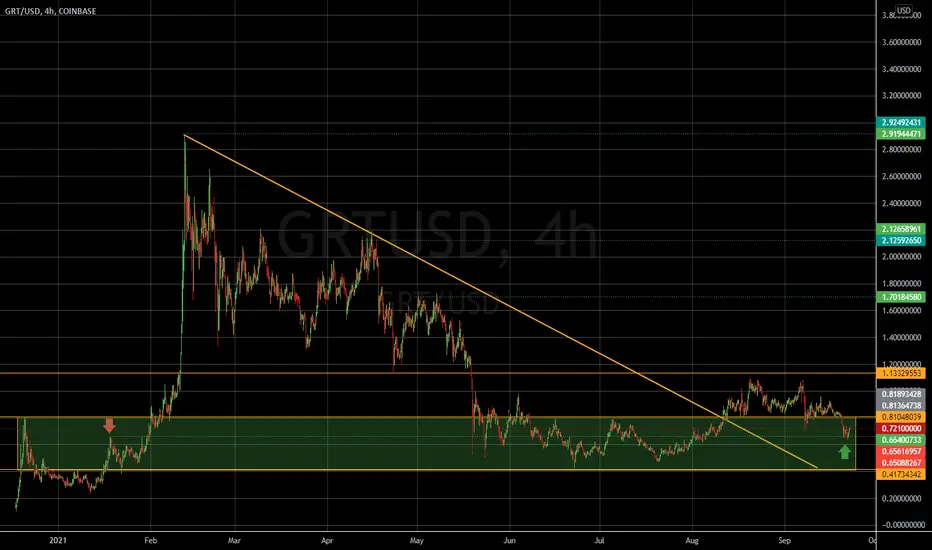
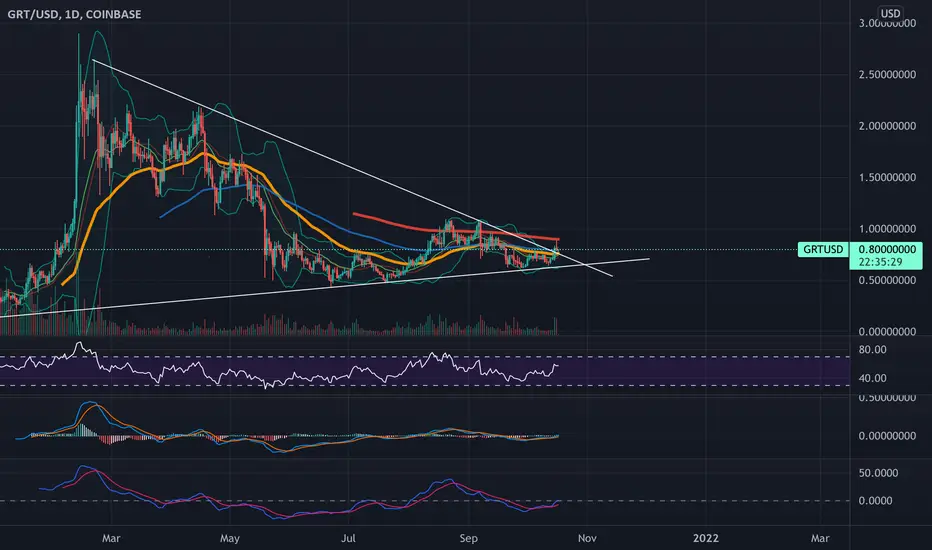
$GRT weekly very close to breaking out$GRT has been off my radar for most of the year since I sold the last of my trade during the February run up but it's starting to show signs of life here.
Touching the long term downtrend line on price and the RSI has (for now) broken its downtrend line as well. MACD histogram is also rising.
Firm break of the ~1.00 zone then last resistance around ~1.10 should send this bad boy back up to 1.60+
The Graph ($GRT) is Set to Make New All Time HighsThe Graph ($GRT) has broken the declining trend from all time highs. Bullish diagonal patterns breaking out from highs usually result in an uptrend especially when other factors are in play like a bullish crypto environment. Watch for some weak resistance at $1.08 and $1.3; once we smash through those levels the fomo will be real. I humbly believe this is a great time to add to your $GRT stack. GLTA, NFA.
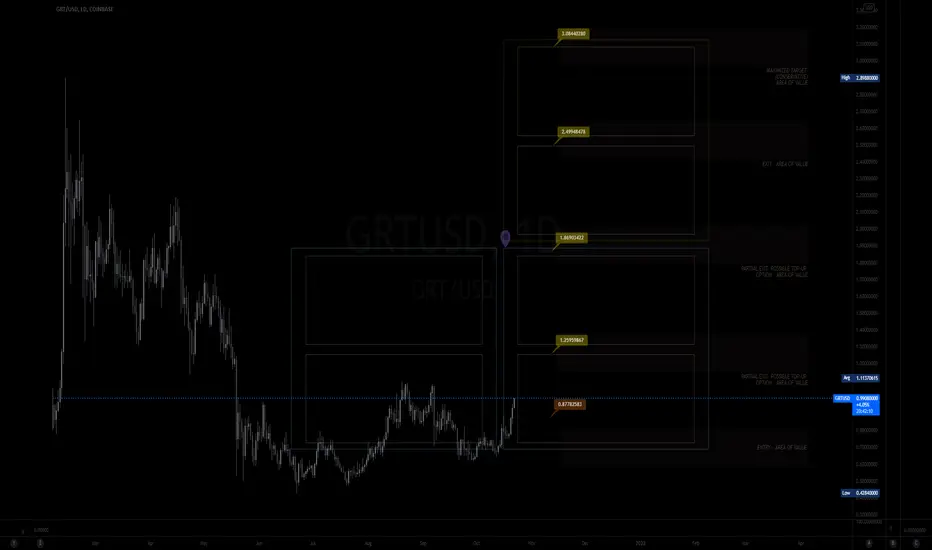
MY MINIMALIST ANALYSIS OF THE GRAPH$GRT
10.22.21 1114H +8 SINGAPORE
ALERT: MARKED ENTRIES and EXITS FOR A SWING TRADE
HOW TO USE MY CHART
It is designed for SWING TRADES at the BOTTOM. I do not SHORT (in support of all the DUMB-MONEY), though you can still use it.
Created on a WEEKLY & DAILY Analysis of Dynamics of the Market.
LARGE BOXES are major pivots that will occur, while the small boxes are MINOR PIVOTS. These can be entries to a BUY/ SELL POSITION or an EXIT/PARTIAL EXIT/TOP-UP AREAS.
Watch out for Chart Patterns, Candlestick Math, Market Dynamics, and your Fibs.
This CHART is best used without indicators.
Price action, candlestick /bars, and FIBS alone will be sufficient as a major deciding factor for this MINIMALIST CHART.
Disclaimer:
The findings of the following analysis are the sole opinions of the publisher of this idea and should not be taken as investment advice.
Thank You for your appreciation and support (Follows, Comments, and Likes.)

GRT 10x move incoming?Could the Graph be setting up for a massive move?
GRT has been consolidating since February and has formed this massive triangle.
A breakout from here has targets past $10. It has yet to retest it's all time high which would also move us to $3.
Still relatively small market cap. Important use case and has massive potential as a blockchain indexer.

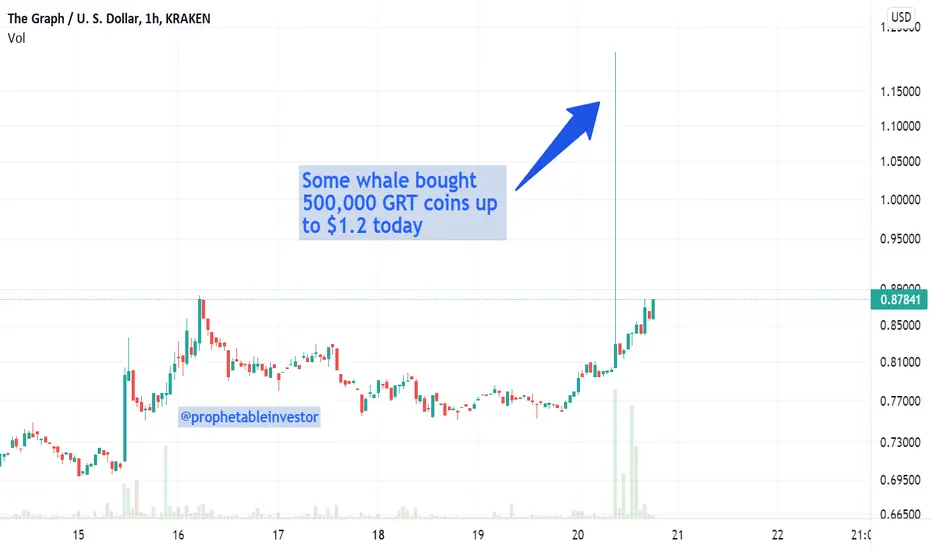
Some $GRT whale purchased 500,000 coins up to $1.2 via KrakenWhales are buying up GRT and willing to pay a premium.
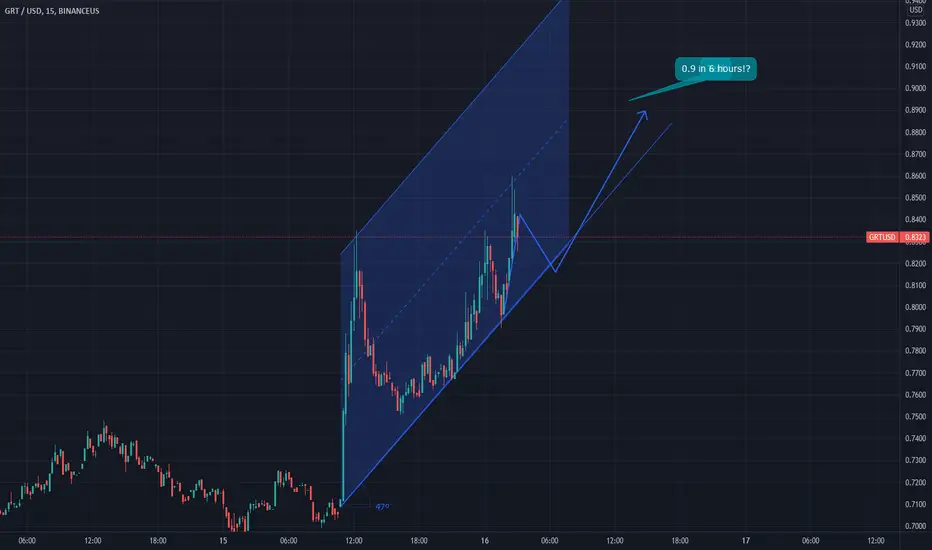
GRT - Looking juicyGRT is making moves. if thats a break out and re-test - you know what happens next
Cautious value trade - GRT Was going to wait for a dump in BTC to get in below 0.50, but I'm thinking a nice pump could happen over the weekend and I don't want to miss it. I've been tracking GRT for a while and this feels like value. I have a tight stop loss and if it doesn't happen I'll keep waiting. I was there the first time it went from $0.76 to $ 2.50 and I think it can happen again.... We'll see what happens Monday with BTC.
First post.... haha

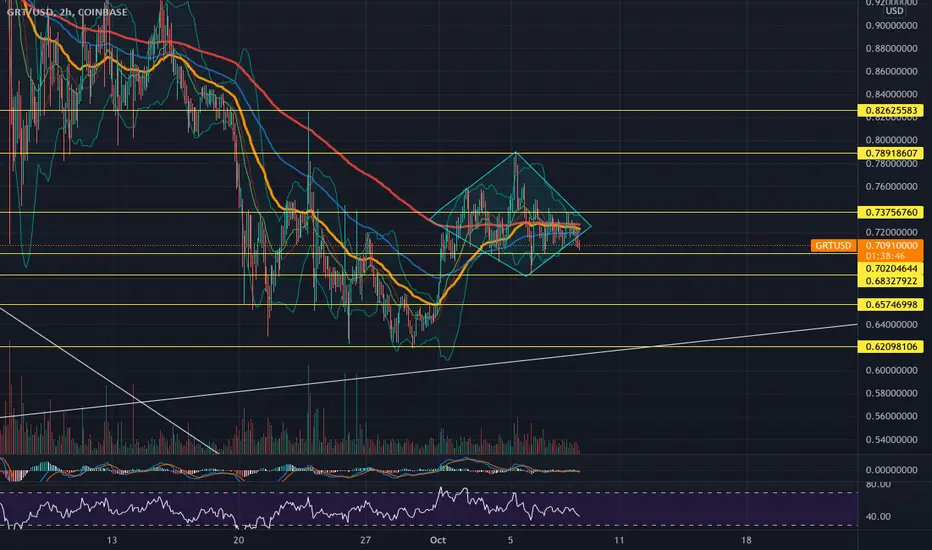
#GRT at interesting support levels. LONG on the GRTBULLlots of confluence
should continue to pop
with these lines defined.
It's easy to know when to bail out on the trade.
which should attract HOT money

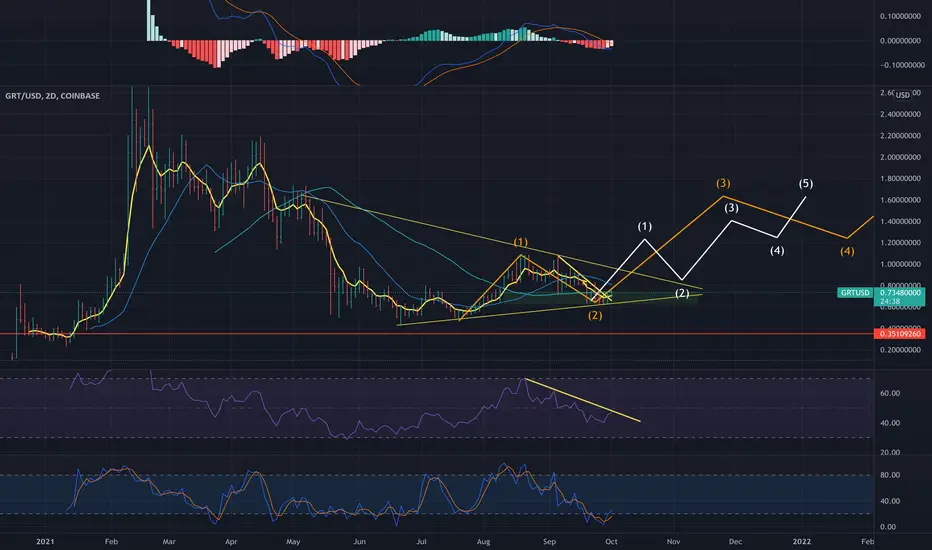
GRTUSD Elliott wave projectionAnalysis is based on Elliott Waves projection and support and resistance.
Exit all your position at the last line.

GRT/USD Price Movement and PredictionAs you can see on the 1D chart GRT seems to be trading in an accumulation channel which indicates that the institutions are stocking up. The price may move to as low as $0.27 to pick up any loose tokens from the sellers before making new highs. We also see huge buying volumes at the bottom of the channel at about 0.45 to 0.50.
$GRT the long wayInvesting comes with considerable risk. This is not investment advice, and this should be used for educational purposes ONLY.
$GRT looks like it held the trendline to complete a wave 2 correction (orange line on chart). Looks like we are gearing up for a larger possible wave 3. EW PTs on chart.
GRT UpdateStill super frustrated with GRT.
Love the project.
China outlawed Bitcoin - price didnt dump. Seems like buy the dip it is?