The altcoin cycle is loading… don’t get caught chasing!Why It Might Be a Good Time to Start Building Your Nest Now 🥚🐣💸
If history’s taught us anything, it’s this: the best opportunities usually show up before everyone’s talking about them. 📈 Every cycle, whether it’s stocks, crypto, or real estate, rewards the people who start stacking early, not the o

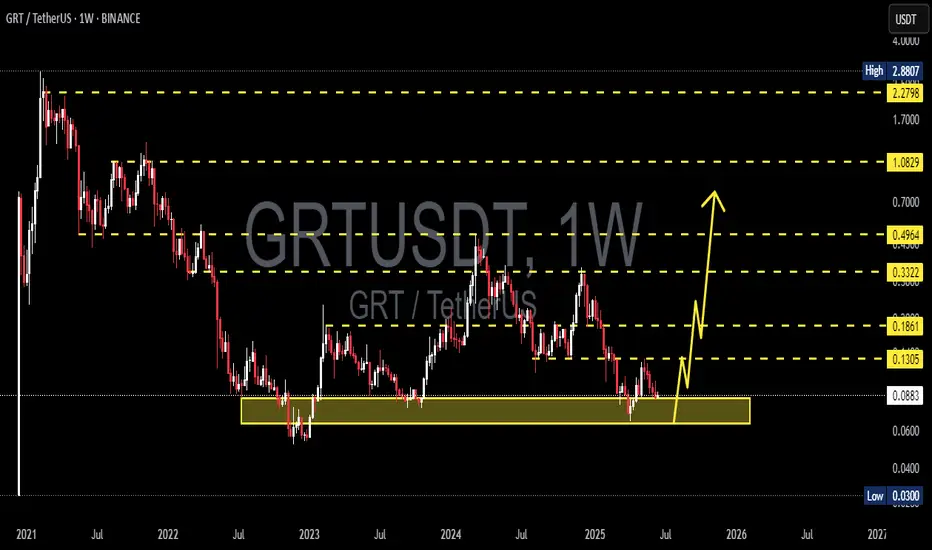
GRTUSDT 1W AnalysisGRT ~ 1W Analysis
#GRT Buy back gradually from here with a short term target of at least 20%+ from this support.
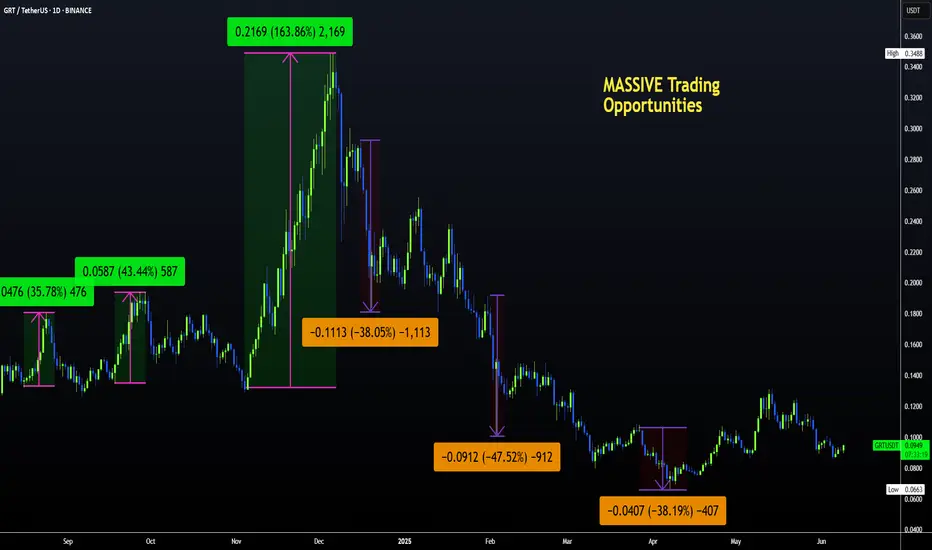
GRT | Altcoins | MASSIVE UPSIDE Potential on The GraphAnother altcoin that has great upside potential is the Graph BINANCE:GRTUSDT
The Graph from a weekly perspective may seem like there's not much action, but if you zoon in to the daily timeframe we see a different picture.
WEEKLY:
VS DAILY:
We can see anything from a +40% increase to a -30%
Maintaining support is necessary, not essential, for the climb.Hello friends🙌
🔊Given the price drop, you can see that the support we identified has worked well for you so far and buyers have supported the price.
Now, given the heavy price drop and disappointment in the market, we can expect a rise until the targets are set.
Don't forget capital and risk mana

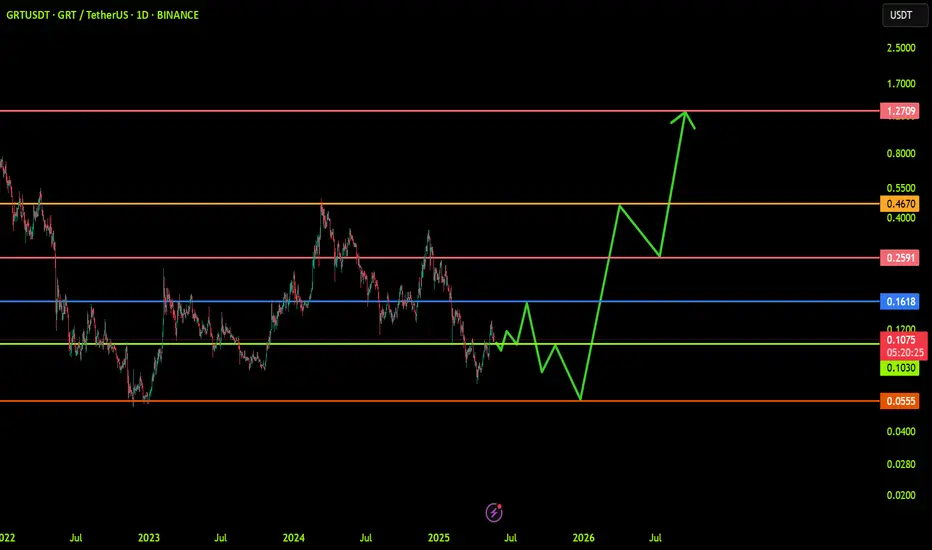
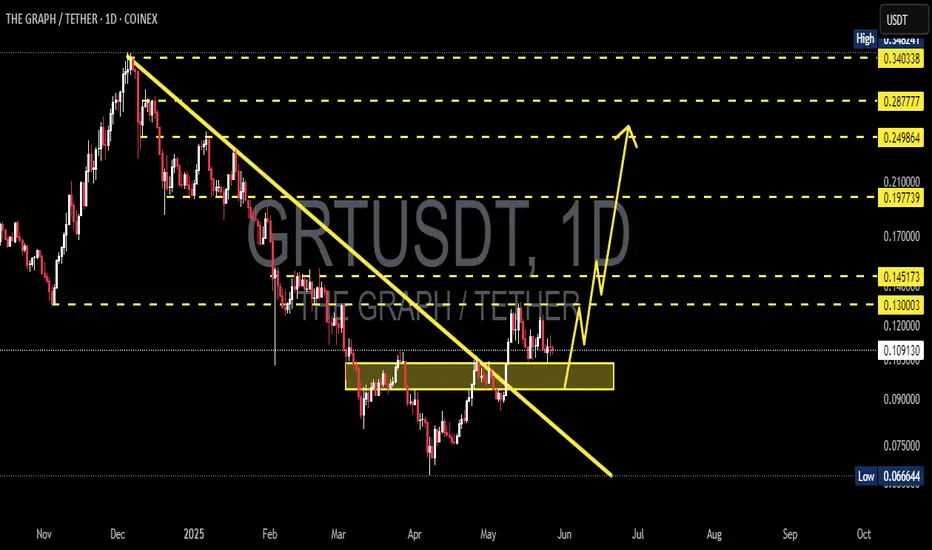
GRTUSDT: Trend in daily time frameThe color levels are very accurate levels of support and resistance in different time frames, and we have to wait for their reaction in these areas.
So, Please pay special attention to the very accurate trend, colored levels, and you must know that SETUP is very sensitive.
Be careful
BEST
MT
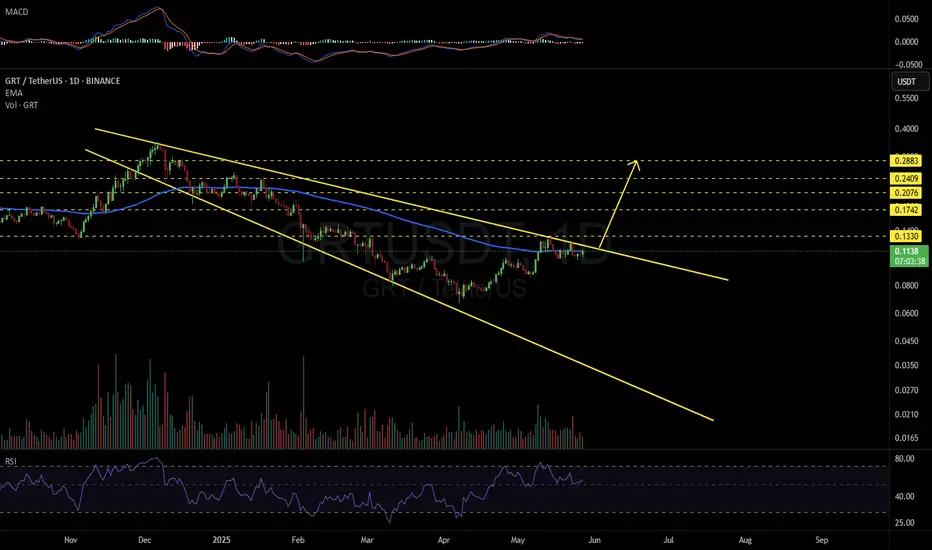
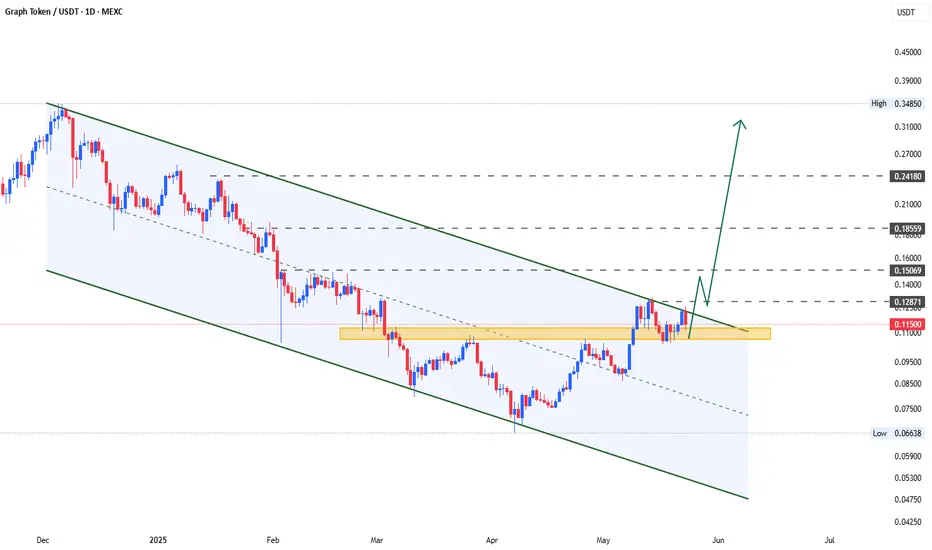
GRTUSDT 1D#GRT is moving inside a Descending Broadening Wedge on the daily chart and is now on the verge of breaking out above both the EMA100 and the wedge resistance. 📈
In case of a successful breakout, the targets are:
🎯 $0.1330
🎯 $0.1742
🎯 $0.2076
🎯 $0.2409
🎯 $0.2883
⚠️ Don’t forget to use a tight stop
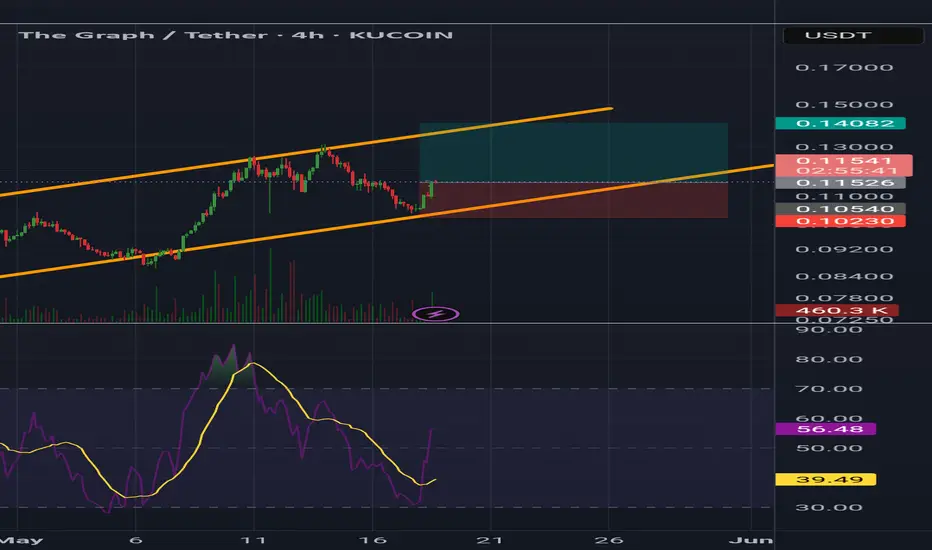
GRTUSDT 1D AnalysisGRT ~ 1D Analysis
#GRT On the 1D time frame the selling pressure has stopped.. Buy on this support block with a short term target of at least 10%+ from here.
GRT Analysis (12H)From the point where we placed the red arrow on the chart, it seems that a large-degree triangle on the GRT chart has completed, and we are now in a new wave sequence.
In these new downward waves, wave A/W has completed, and it now appears we are in the middle of wave B/X.
We are looking for a reb
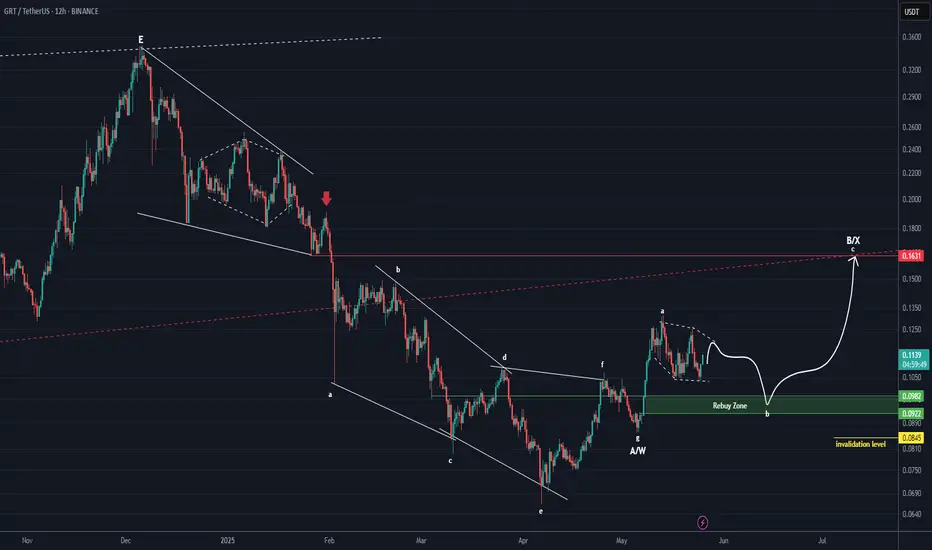
GRT channel is forming
Buy gradually from here or wait for breaking through this resistance line with a short-term target of at least 10%+.
See all ideas
Summarizing what the indicators are suggesting.
Oscillators
Neutral
SellBuy
Strong sellStrong buy
Strong sellSellNeutralBuyStrong buy
Oscillators
Neutral
SellBuy
Strong sellStrong buy
Strong sellSellNeutralBuyStrong buy
Summary
Neutral
SellBuy
Strong sellStrong buy
Strong sellSellNeutralBuyStrong buy
Summary
Neutral
SellBuy
Strong sellStrong buy
Strong sellSellNeutralBuyStrong buy
Summary
Neutral
SellBuy
Strong sellStrong buy
Strong sellSellNeutralBuyStrong buy
Moving Averages
Neutral
SellBuy
Strong sellStrong buy
Strong sellSellNeutralBuyStrong buy
Moving Averages
Neutral
SellBuy
Strong sellStrong buy
Strong sellSellNeutralBuyStrong buy
Displays a symbol's price movements over previous years to identify recurring trends.