GRT: Current SituationYou asked, and we delivered:
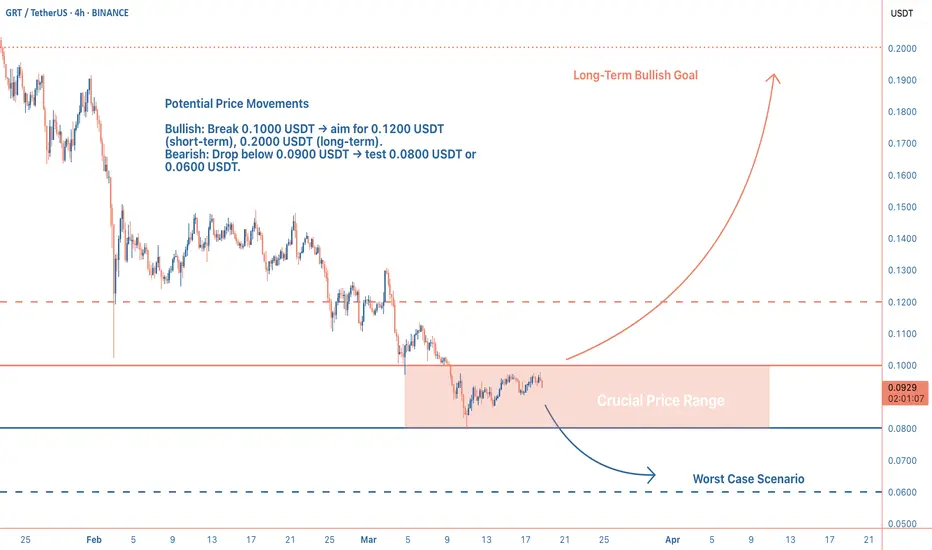
GRT is trading at 0.0930 USDT, down over 70% from its September peak of 0.3600 USDT, reflecting a steep decline amid a broader crypto market dip (total market cap down 4.4% in the last 24 hours). The price is testing a critical support zone at 0.0900-0.0930 USDT, with bearish signals dominating: it’s below the moving average, and indicators like MACD suggest ongoing selling pressure. A falling wedge pattern hints at a potential reversal, but volume is needed to confirm any breakout. The market’s cautious mood amplifies GRT’s struggles, making this a pivotal moment.
Technical Indicators and Key Levels
Short-Term (4-Hour Chart):
Support: 0.0900-0.0930 USDT (critical), 0.0800 USDT
Resistance: 0.1000 USDT, 0.1200 USDT
Indicators: RSI near oversold (~30), MACD bearish. A hold above 0.0900 USDT could spark a bounce to 0.1000 USDT.
Long-Term (One-Year Chart):
Support: 0.0800 USDT, 0.0600 USDT
Resistance: 0.2000 USDT, 0.3000 USDT
Holding 0.0900 USDT is key for any recovery; below risks a deeper slide.
Potential Scenarios
Bullish Case: Hold 0.0900 USDT, break 0.1000 USDT with volume → target 0.1200 USDT (short-term), 0.2000 USDT (long-term).
Bearish Case: Break below 0.0900 USDT → test 0.0800 USDT or 0.0600 USDT.
Volume is critical—watch for spikes to confirm moves.
Broader Context and Tips
GRT’s role in decentralized indexing supports long-term value, but short-term risks loom. Traders should focus on 0.0900 USDT, a hold could signal a bounce, a break risks more downside. Use tight stops (e.g., below 0.0900 USDT for longs) and stay alert for volume shifts or news on adoption. Long-term, accumulating near 0.0900 USDT or 0.0800 USDT could pay off if the market turns.
GRTUSDT.PS trade ideas
grt mega bullishGRTUSDT is in its week OB+FVG area, Previously it also pumped from that area and expecting now as well. if it goes down lower time frame then do DCA.
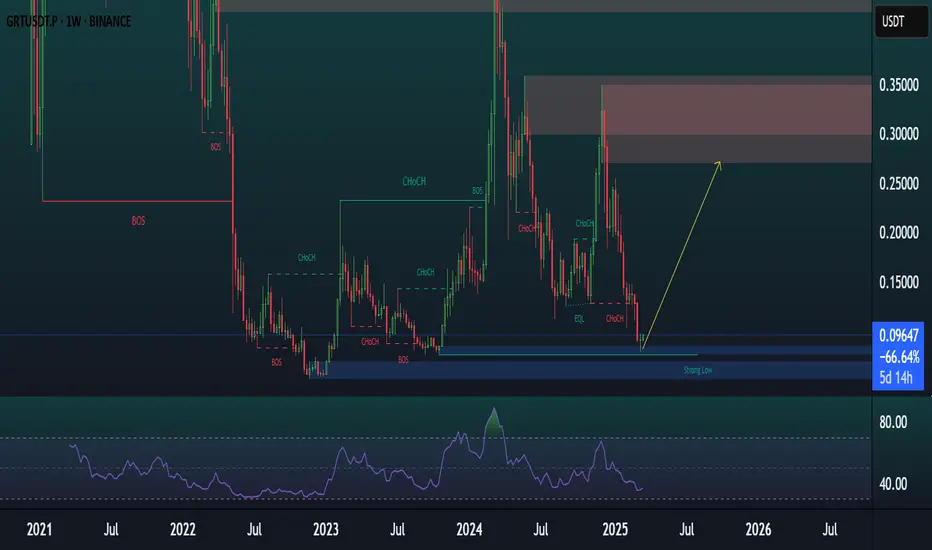
GRTUSDT 1WGRT ~ 1W Analysis
#GRT Buy gradually from here if you still have a Conviction on this Coin with a minimum target of 20%+.

GRTUSDT 1W🩸 JSE:GRT ⁀➷
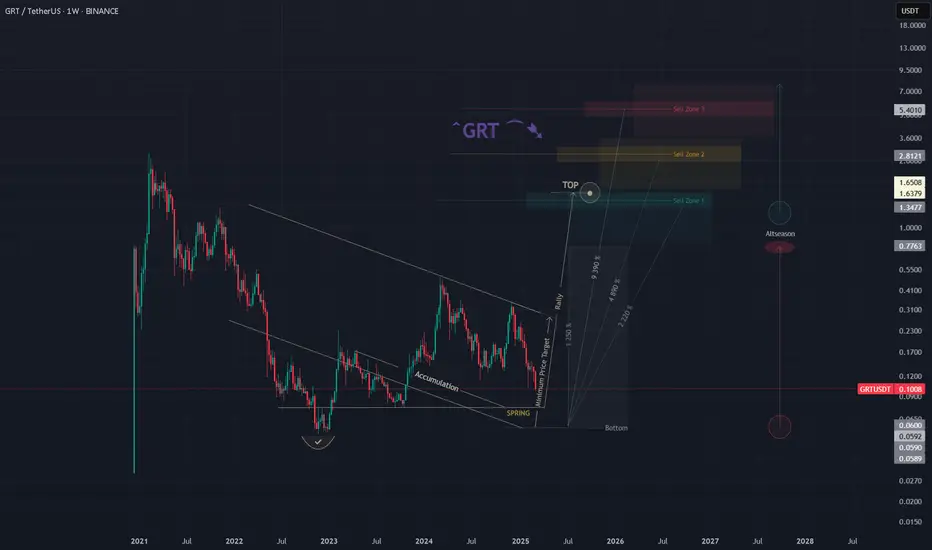
#TheGraph. Macro chart Another
💯 Intermediate Target - $0.77
🚩 Macro Target 1 - $1.34
🚩 Macro Target 2 - $2.81
🚩 Macro Target 3 - $5.40
- Not financial advice, trade with caution.
#Crypto #TheGraph #GRT #Investment
✅ Stay updated on market news and developments that may influence the price of The Graph. Positive or negative news can significantly impact the cryptocurrency's value.
✅ Exercise patience and discipline when executing your trading plan. Avoid making impulsive decisions driven by emotions, and adhere to your strategy even during periods of market volatility.
✅ Remember that trading always involves risk, and there are no guarantees of profit. Conduct thorough research, analyze market conditions, and be prepared for various scenarios. Trade only with funds you can afford to lose and avoid excessive risk-taking.
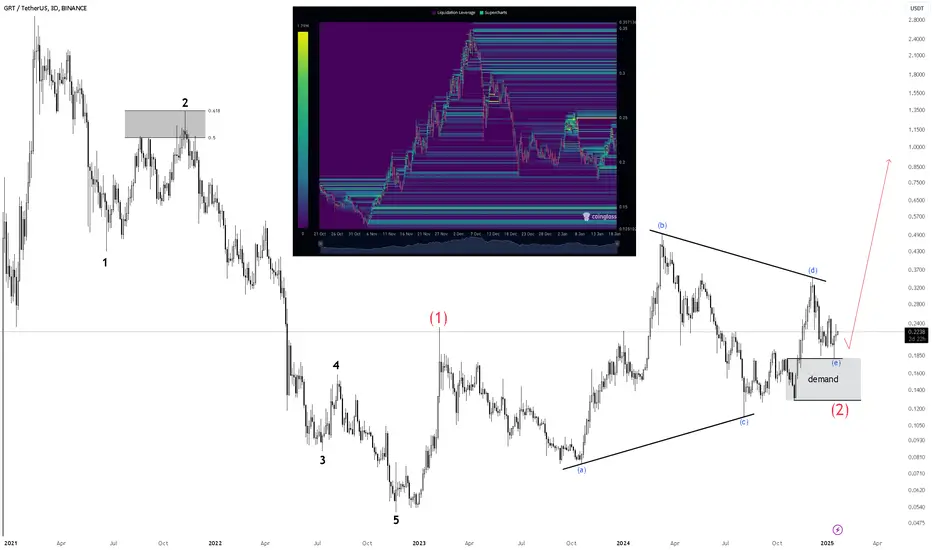
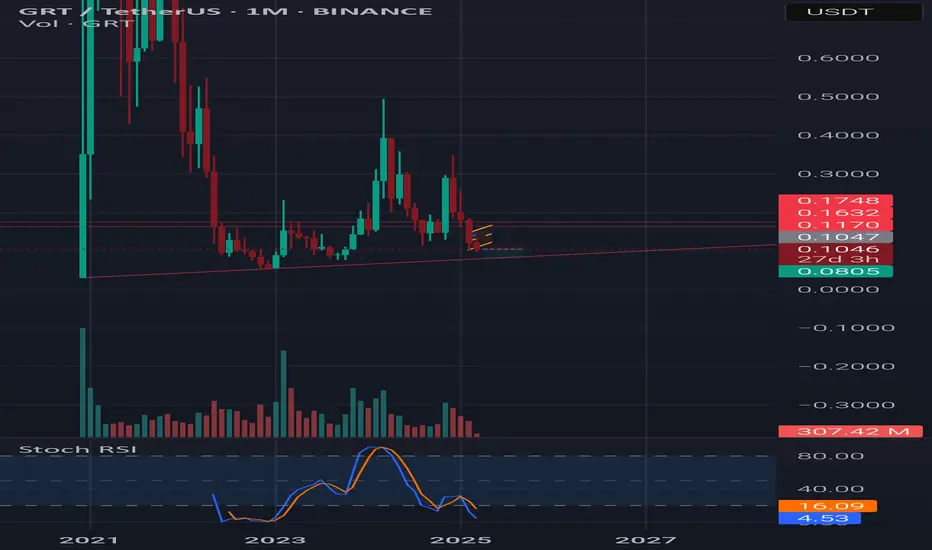
This is a monthly timeframe chart of GRT/USDT (The Graph vs. TetThis is a monthly timeframe chart of GRT/USDT (The Graph vs. Tether). Let's analyze the situation:
1. Trend and Structure
Overall, the price is in a long-term downtrend after peaking in 2021.
There is a possible ascending triangle or accumulation zone, where the lower support line is gradually rising.
2. Support and Resistance Levels
Support: ~0.1047 (current zone), ~0.0805 (lower support).
Resistance: ~0.1170, ~0.1632, ~0.1748 (key levels the price needs to break for an uptrend).
3. Volume and Indicators
Volume is low, indicating a lack of strong buyer or seller activity.
Stochastic Oscillator is in the oversold zone, which could signal a potential upward reversal.
4. Possible Scenarios
Bullish Scenario: If the price holds above 0.1047 and breaks 0.1170 with volume confirmation, it could move towards 0.1632–0.1748.
Bearish Scenario: If 0.1047 is broken downward, the price could drop to 0.0805 or lower.
5. Conclusions and Strategy
If you want to enter, it's safer to wait for a confirmed breakout above 0.1170 with volume confirmation.
If 0.1047 support is broken downward, it’s better to look for buy opportunities near 0.0805.
For a long-term uptrend, the price needs to break at least 0.1748.
Depending on your trading style, you can consider entering near 0.1047 with a tight stop-loss or waiting for a confirmed breakout before entering a trade.
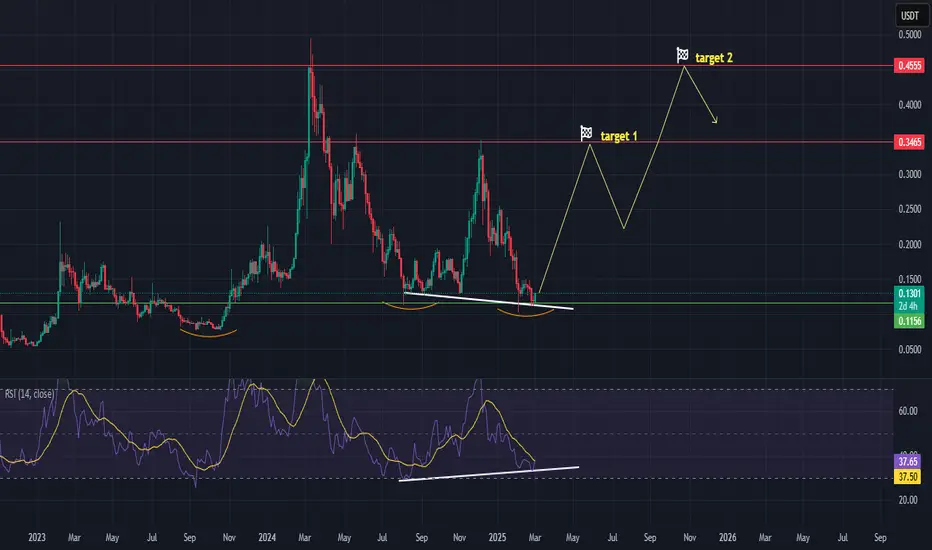
GRTUSDT long positionhi traders
GRTUSDT doesn't look bad here. The price is at the low-risk area for a swing long position.
Bullish divergences can be observed on 3D time frame.
2 targets are shown on the chart.
I can see it going higher than target 2 if you're patient but don't forget to take profit.
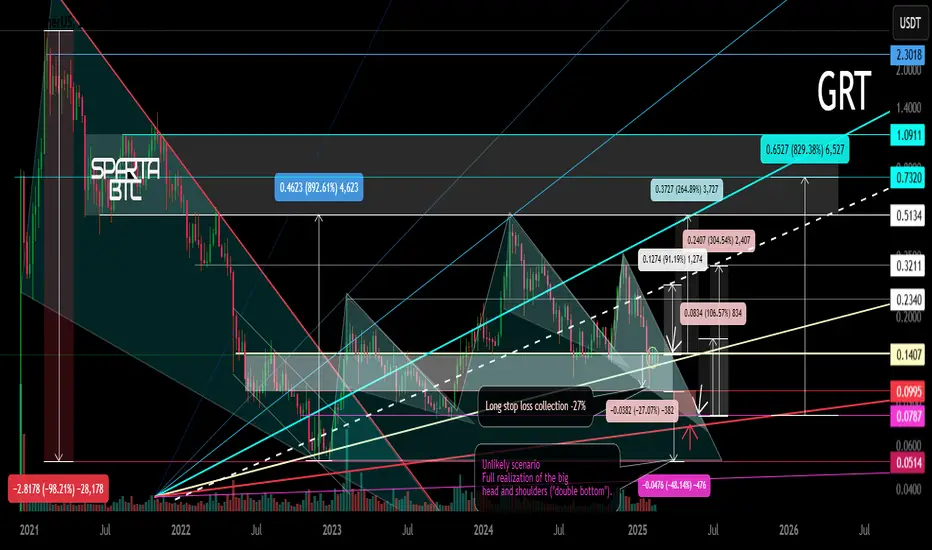
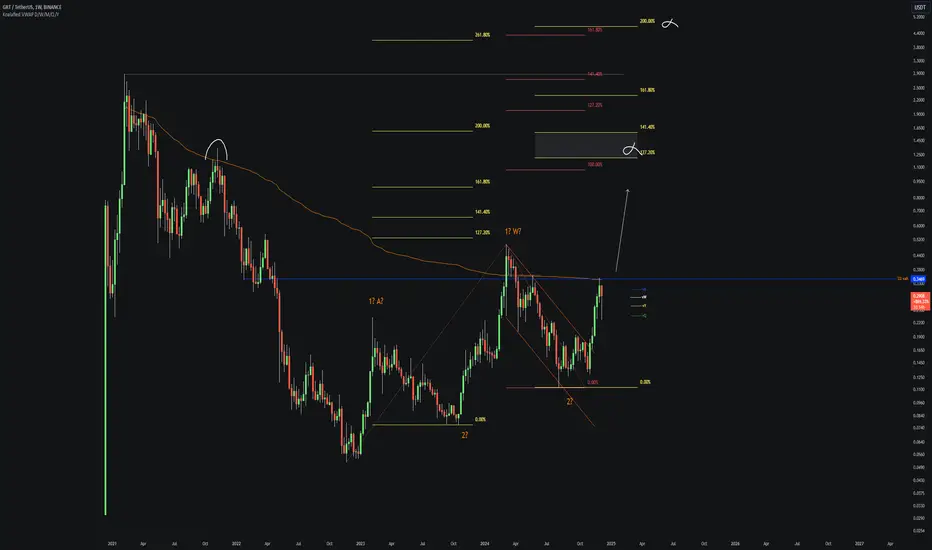
GRT Main trend. 23 02 2025Logarithm. Main trend. Time frame 1 week (no need for less). Hype will be when they promote everything related to artificial intelligence. It may go against the general trend in this regard.
But, at the moment, behind the market, which is logical. I imposed dynamic support/resistance zones of the Gann fan for orientation with the intersection of ordinary key levels (as everyone sees). I showed formations that can be formed and key reversal zones, percentages to them.
Previous closed trading idea +311% / +890%
1️⃣exactly in the designated zones of the planned first “hamster pump” +311%
2️⃣and the maximum pump (planned dump zone) 700-900%
GRT/USDT Main trend. Descending wedge. 8 02 2023
Local trading situation now.
Locally, after collecting long stop-loss at a large % (-27), this zone is held. If the market as a whole is positive, then this zone with 3 trend support points will be the main support for the development of the upward trend.
If this zone is broken, and the price consolidates below the “neck” level, then a decline to the 0.78 zone, that is, the formation of a descending wedge in the secondary trend. There will be a “double bottom” globally. Then, a breakthrough of the wedge resistance, and aggressive pumping under the hype of all that sort of thing.
Scam. Unlikely . Lower declines (implementation of "head and shoulders" without a squeeze) — the likelihood of a scam, that is, tales of hacking and "closure of the project". What is unlikely is how the project is traded in the US on Coinbase, and for this there are consequences for the creators.
The Graph (GRT)🔷 Introduction:
What is GRT?
The Graph (GRT) is a decentralized protocol designed for indexing and querying blockchain data. It enables developers to access blockchain information quickly and efficiently without the need to run dedicated servers. GRT serves as the native token of this ecosystem, used for transaction fees and securing the network.
🔹 Technical Analysis of GRT/USDT – Weekly Timeframe
📌 Overall Market Condition
After an extended corrective phase, GRT remains within its weekly ascending channel. The price is currently hovering around a key support zone (0.1165 - 0.1334, marked in blue), which has historically triggered significant reactions.
🔍 Potential Scenarios
📈 Bullish Scenario:
✅ If the blue support holds and the price re-enters the ascending channel, further upside potential is likely.
✅ Key resistance levels:
Orange Zone (0.3202 - 0.3577): Possible initial reaction level.
Red Zone (0.6423 - 0.7232): Major resistance before reaching the final target.
✅ Key Consideration: If weakness in momentum and declining volume appear near these resistance levels, gradual profit-taking and a cautious approach could be wise. Otherwise, continued bullish momentum could push the price toward the channel’s upper boundary, targeting 1.0667 - 1.2607 (light blue TP zone).
📉 Bearish Scenario:
❌ If the blue support fails, the price could drop towards the next major support zone at 0.0691 - 0.0816 (gray support).
❌ Losing this level would invalidate the bullish structure and increase the likelihood of deeper declines.
🎯 Entry Strategy & Risk Management
⚡ Gradual entry within the blue support zone with a stop-loss below the gray zone is recommended.
⚡ Suggested risk: 0.25% to 0.5% of spot capital (to prevent heavy losses).
⚡ Volume increase in this area could signal a potential trend reversal.
🔹 Conclusion
The current support level is critical for GRT. If it holds, the bullish scenario remains intact, allowing for potential growth toward the upper boundary of the ascending channel. However, losing this level could invalidate the bullish structure and lead to a deeper correction.
🔸 Additionally, when approaching key resistance levels (0.3202 - 0.3577 and 0.6423 - 0.7232), monitoring volume and price behavior is essential. Signs of weakness in these zones may indicate an opportunity for gradual profit-taking and a more cautious approach.
GRT Long Spot OpportunityMarket Context:
GRT has retraced to a key support zone and is presenting a potential bounce-back opportunity for a long position.
Trade Details:
Entry Zone: $0.125 - $0.14
Take Profit Targets:
$0.18 - $0.20
$0.2350 - $0.2550
Stop Loss: Just below $0.12
This setup offers a solid risk-to-reward ratio if the support holds. Watch for any price reaction at this level! 📈

GRT, WEEKLY LOOKThere are couple of counts here, either if this is a complex correction or start of an impulse (2 different impulse actually) GRT looks good.
We have swing vwap as a wall. If GRT gets over that vwap, things going to get better it looks.
It rejected from there couple of time so this is can be exhausting.
If BTC.D drops more and let alts print, that wall of worry will be breached i believe.
It is going very long term bullish from here Based on ICT analysis and SMC
SL AT 0.124
It ia on 4H D bullish FVG that moved the price to 5X in Nov

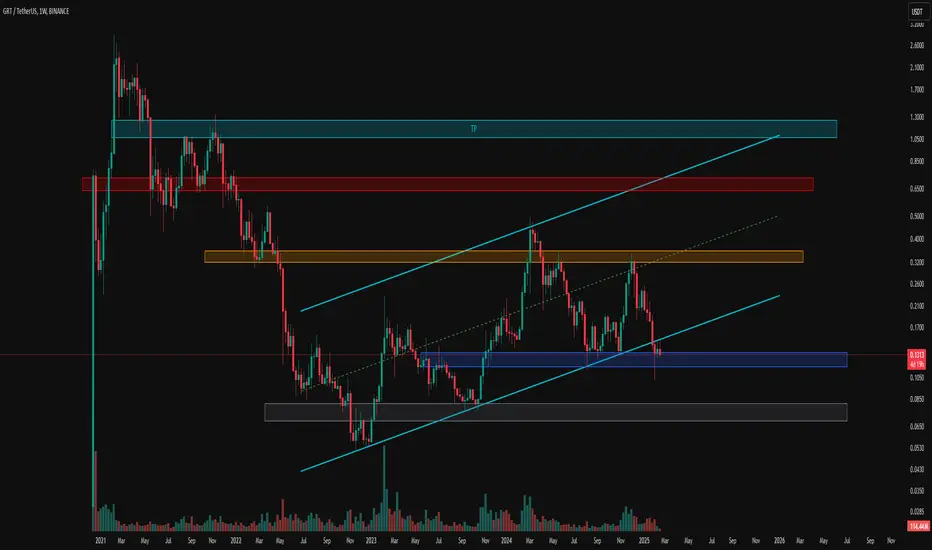
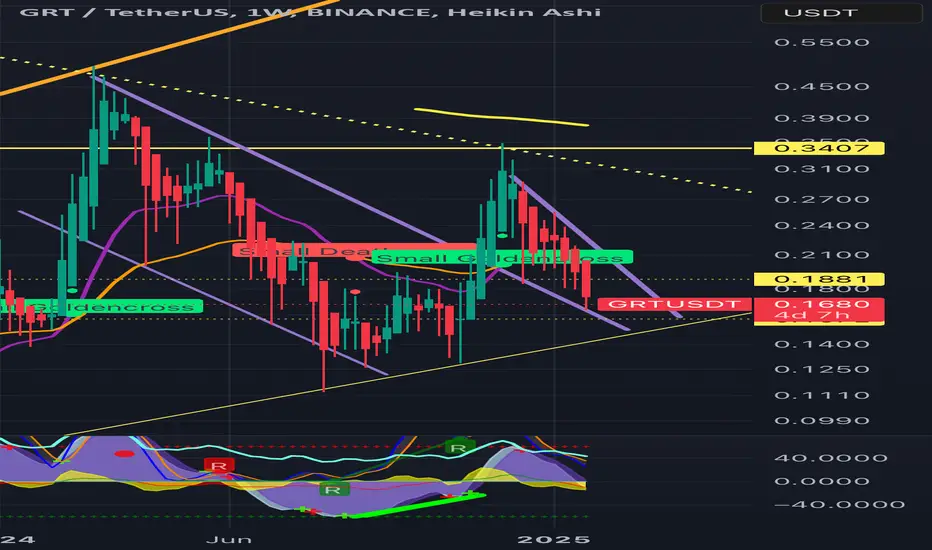
Trend lines! Bull run will continueI’ve made some previous calls for breakouts that were wrong. I think we were bullish too soon. We had a longer flush out period then everyone thought. This is good for the markets. Weak hands are selling and we are consolidating against trend pattern bottoms.
I’m more confident then I have been in the past few months that we will bounce off these support lines and rally to the 1 dollar mark in the next quarter.
Stay strong, DCA and have conviction in your investments
WILL #GRT MAKE IT!!!
Currently #GRT is facing a resistance which was previously strong support of descending triangle.
#grtusdt needs to break above this resistance, then we can probably see rally up to 0.5$ region after breaking out resistance of previously formed descending triangle.
In case of any further dip, we can see #grt heading towards its major support region.

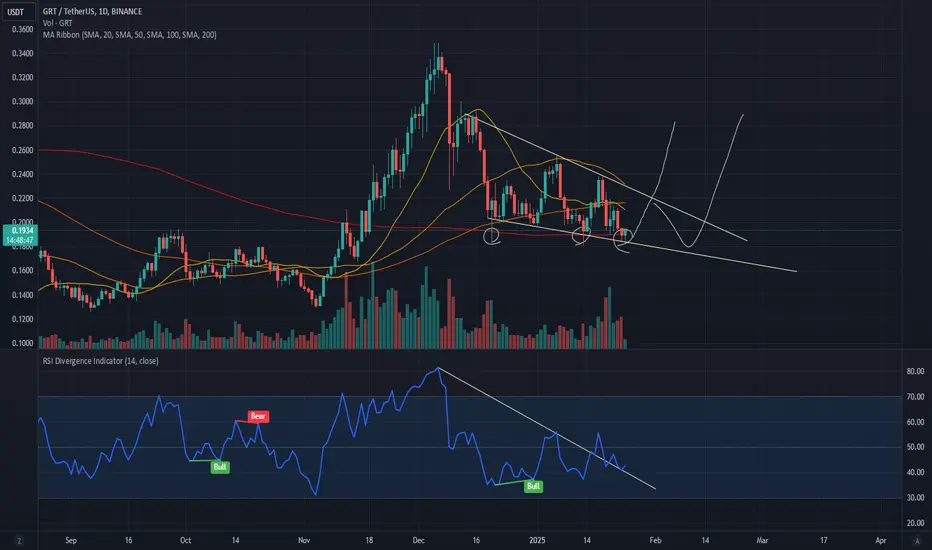
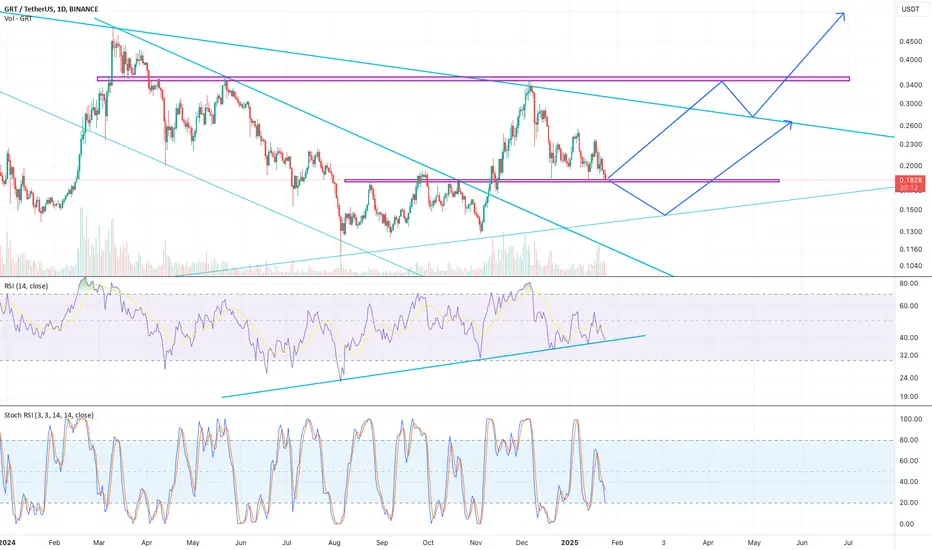
$grt looks fundamentally ready to move upall 3 local lows have caught support on the daily 200sma, price is consolidating inside a falling wedge with good volume, rsi is confirming a breakout with multiple test/finding support of its own trendline. need to overtake the other ma's and top trendline of the wedge, if this occurs short term target would be around .30-.35
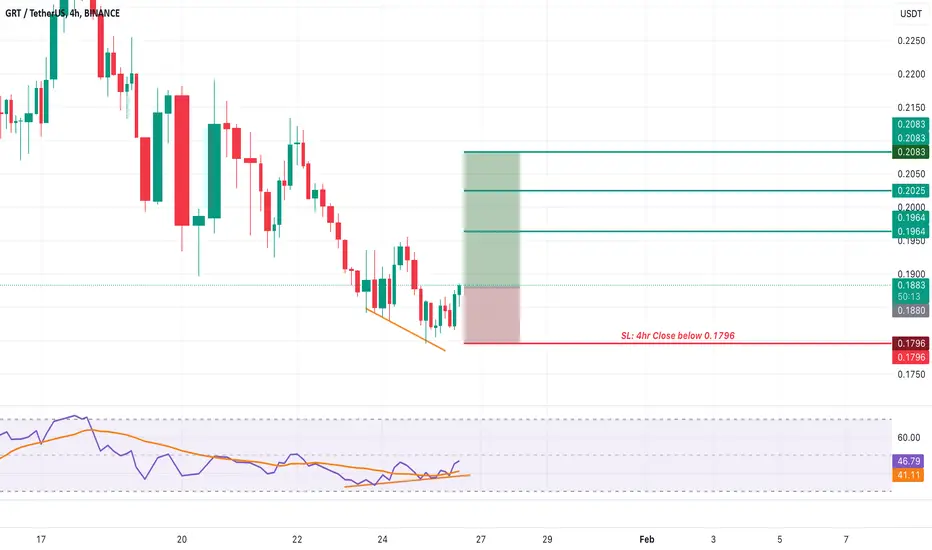
$GRT Spot Buy Setup!JSE:GRT Spot Buy Setup!
📍 Entry: Now
🤔 Why?
- Double Bottom on the 4hr
- RSI Divergence
💰 Targets:
🎯 1) 0.1964
🎯 2) 0.2025
🎯 3) 0.2083
❌ Stop Loss: Close 4hr candle below 0.1796
✅ This is not financial advice; it is just an analysis.
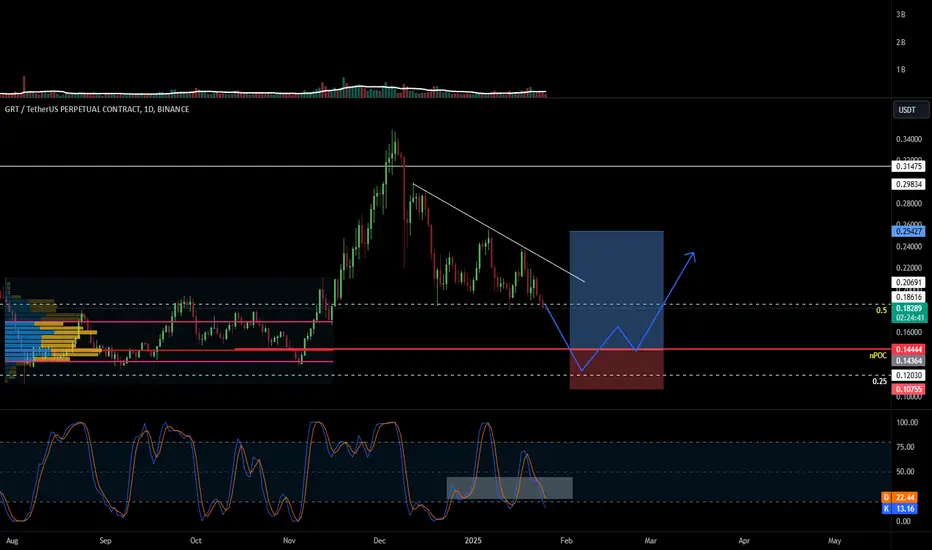
GRT LONG GRT seems to be heading toward the nPOC, considering that the USDT.D chart is also in a support zone, increasing the chances of GRT reaching 0.14. Interestingly, the stochastic RSI also attempted a positive cross but was rejected. Moreover, the price forms a descending triangle. These combined factors make me think there's a 60–70% chance we'll see GRT at a lower price soon.
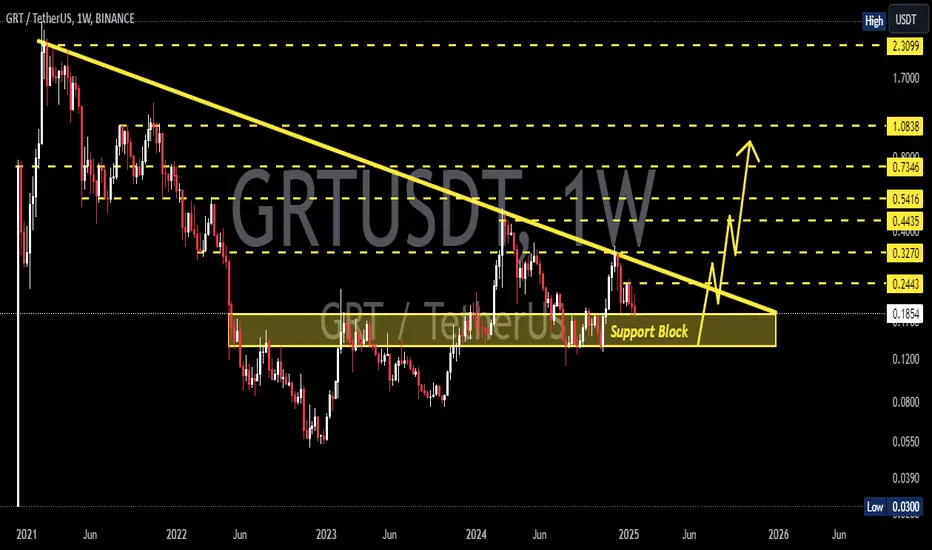
GRTUSDT 1WGRT ~ 1W Analysis
#GRT If you still have Conviction on this coin, this is a very good support block for now. buy from here with a minimum target of 20%+
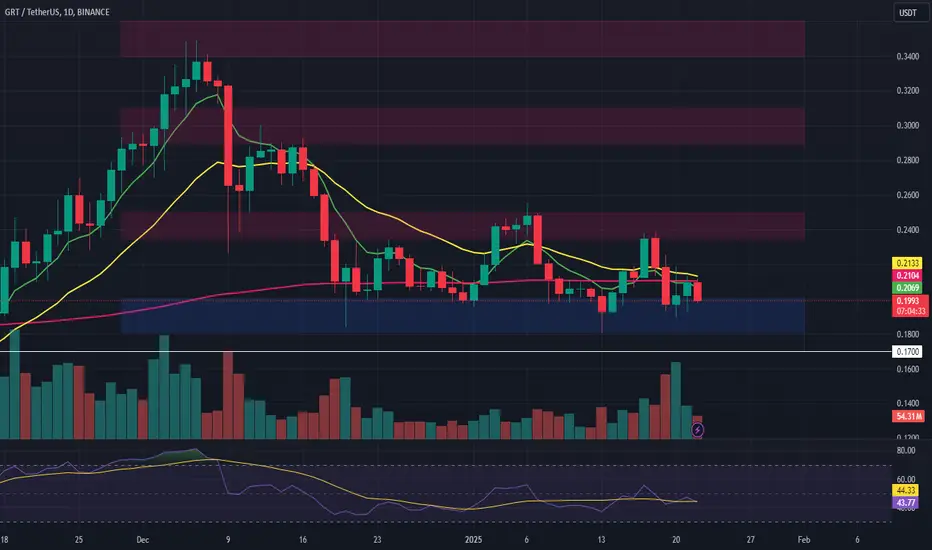
Will #GRT Finally Break Free From Its Falling Wedge? Key LevelsYello, Paradisers! Are we about to witness a bullish breakout for #GRTUSDT, or could this falling wedge formation drag the price further down? Let's look at the latest setup of #TheGraph:
💎#GRT is currently trading within a falling wedge pattern along with a triple bottom pattern established in an 8-hour timeframe chart and showing a high probability of a bullish reversal from its current trajectory. However, patience is key as a breakout confirmation is essential before taking any decisive action.
💎#GRTUSD is approaching a critical resistance zone near $0.239, which aligns with the upper boundary of the wedge. A breakout above this level would signal bullish momentum and could pave the way for a sharp rally toward the $0.32–$0.33 zone, where sellers are likely to step in.
💎On the downside, $0.17 has been acting as a solid support zone, with buyers stepping in to defend this level each time the price approaches it. As long as this support is in place, the bullish scenario will remain valid. However, if this support fails then the asset will fall to the $0.134 support zone where buyers are expected to step in.
💎However, if the price closes below $0.134, the bullish setup would be invalidated, and the price could slide toward $0.12 or even retest the $0.10 zone, where further demand is expected.
Stay focused, patient, and disciplined, Paradisers🥂
MyCryptoParadise
iFeel the success🌴

GRT at crucial supportIf this support holds I expect that GRT will make a bounce back to the previous resistance and then break out and go onto the next resistance. If it doesn't hold I expect we will retest the lower trend line and then bounce back up. I do expect this level to hold as there is major bullish divergence on the rsi. GLTA, NFA! Will be looking for longs if we hold
GRT Long Spot Opportunity Market Context:
GRT is trading at a critical support level, signaling a potential bounce. This area offers a strong foundation for a long trade, supported by historical price action and favorable technical indicators.
Trade Details:
Entry Zone: $0.18 - $0.20
Take Profit Targets:
$0.2350 - $0.25
$0.29 - $0.31
$0.34 - $0.36
Stop Loss: Below $0.17
This trade presents an excellent risk-to-reward ratio, targeting gradual moves toward higher resistance zones. 📈
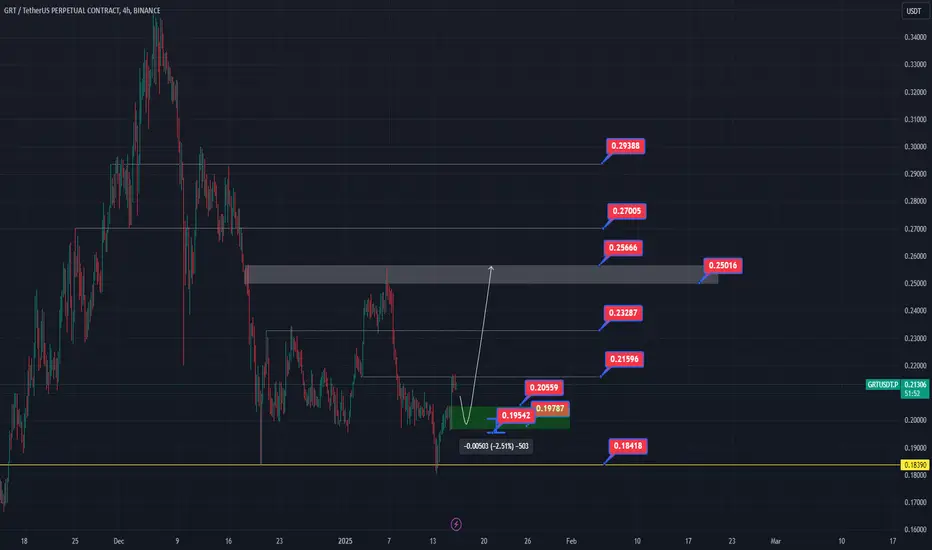
#GRT supports OB for long position.I'll try long if #GRT supports OB. 2.51% stop-loss, 10X for 25,1% gain.
#GRT LONG
ENTRY - 0.20559 - 0.19787
STOPLOSS - 0.19542
TP1 - 0.21596
TP2 - 0.23287
TP3 - 0.25666
TP4 - 0.27005
TP5 - 0.29388
R:R - 8.86
GRT looks bullish#GRT has a nice pattern for a good rise
there is triangle pattern as markets correction wave or wave 2 now we are going to make the 3rd wave so this should raise the market