GRTUSDT trade ideas
GRT. USDTTake Graph seriously.
This project is the backbone of data indexing in the Web 3 world.
Although Graph has a market cap of $10.4 billion, its current price is only $0.093.
Graph organizes complex data for both Aave and Uniswap.
So it will be very easy for Graph to break through the channel and hit $0.11.
" The next targets of the graph will be determined after crossing the price of $0.12 "
GRT Main trend. 23 02 2025Logarithm. Main trend. Time frame 1 week (no need for less). Hype will be when they promote everything related to artificial intelligence. It may go against the general trend in this regard.
But, at the moment, behind the market, which is logical. I imposed dynamic support/resistance zones of the Gann fan for orientation with the intersection of ordinary key levels (as everyone sees). I showed formations that can be formed and key reversal zones, percentages to them.
Previous closed trading idea +311% / +890%
1️⃣exactly in the designated zones of the planned first “hamster pump” +311%
2️⃣and the maximum pump (planned dump zone) 700-900%
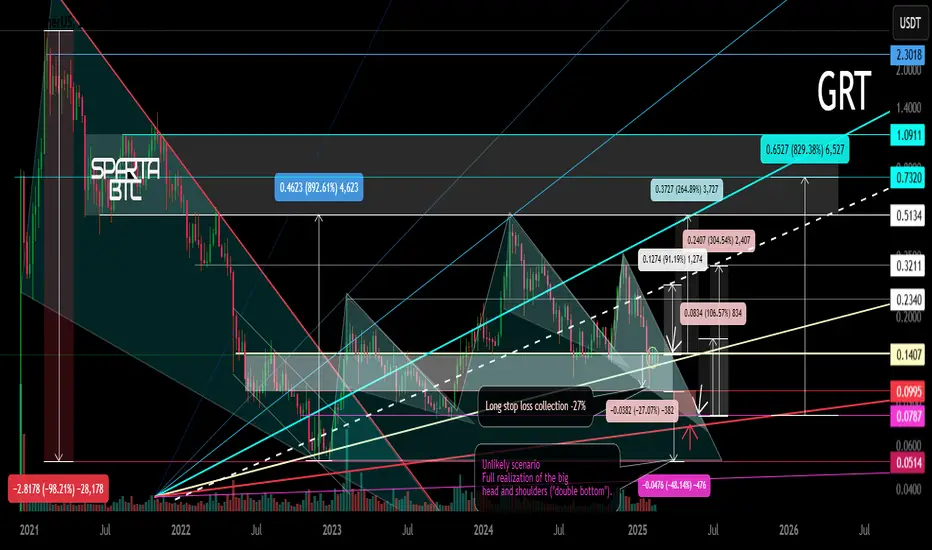
GRT/USDT Main trend. Descending wedge. 8 02 2023
Local trading situation now.
Locally, after collecting long stop-loss at a large % (-27), this zone is held. If the market as a whole is positive, then this zone with 3 trend support points will be the main support for the development of the upward trend.
If this zone is broken, and the price consolidates below the “neck” level, then a decline to the 0.78 zone, that is, the formation of a descending wedge in the secondary trend. There will be a “double bottom” globally. Then, a breakthrough of the wedge resistance, and aggressive pumping under the hype of all that sort of thing.
Scam. Unlikely . Lower declines (implementation of "head and shoulders" without a squeeze) — the likelihood of a scam, that is, tales of hacking and "closure of the project". What is unlikely is how the project is traded in the US on Coinbase, and for this there are consequences for the creators.
GRT/USDT Weekly Analysis — “Life or Death Zone” for The Graph!🟡 🔥 Critical Zone: Demand Area in Play!
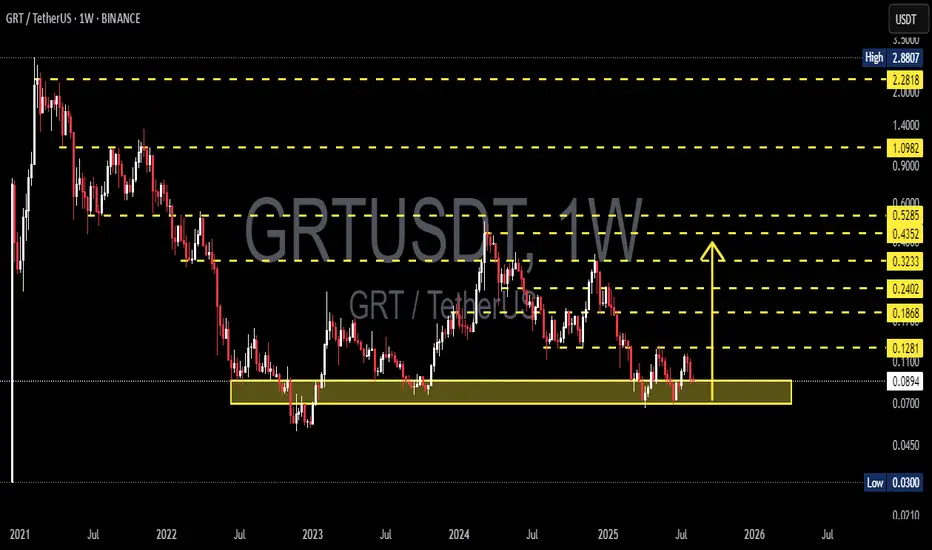
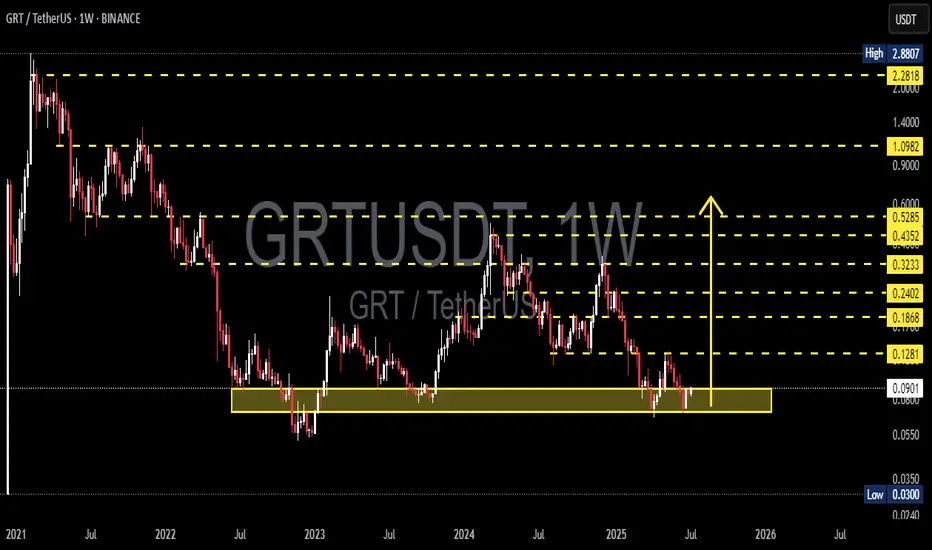
The Graph (GRT) is retesting one of its most critical historical demand zones — the $0.0700 to $0.0897 area — a level that has acted as strong support multiple times since mid-2022.
> This zone is not just a support — it’s a make-or-break level that has defined the survival of the GRT trend on the higher timeframes.
The current price action shows hesitation, low volatility, and potential accumulation — all classic signs that a major move is brewing.
---
📊 Technical Structure & Price Behavior
GRT has been trading in a wide sideways channel after a long-term downtrend, with multiple bounce attempts off this demand zone.
No higher highs have been confirmed since the last rally towards $0.24.
Volume appears to be declining, indicating compression before expansion.
Price has failed to break and sustain above key resistance levels, hinting that buyers are cautious — or waiting for macro confirmation.
---
🐂 Bullish Scenario: Accumulation & Breakout Potential
If buyers continue to defend the $0.0700–$0.0897 zone, and GRT can break above short-term resistance at $0.1281, this could confirm a reversal structure or at least a mid-term relief rally.
🎯 Potential Bullish Targets:
1. $0.1281 – minor local resistance
2. $0.1868 – structural breakout level
3. $0.2402 – previous rejection zone
4. $0.3233 – historical supply
5. $0.4352 & $0.5285 – macro targets if momentum builds
> A breakout above $0.1868 with volume could kickstart a trend reversal towards the $0.30–$0.50 region.
---
🐻 Bearish Scenario: Breakdown Below Demand
However, if GRT loses the $0.0700 key support, this would invalidate the accumulation thesis and potentially trigger panic selling.
⚠️ Bearish Breakdown Targets:
$0.0450 – intermediate support
$0.0300 – all-time low and last line of defense
> A breakdown would likely signal a return to macro bearish sentiment and a reset of the entire structure.
---
🔄 Market Psychology: The Calm Before the Storm?
We are in a classic zone of indecision, where both bulls and bears are waiting for a confirmation. This setup is often followed by high-volatility breakout or breakdown moves.
Traders and investors alike should be watching this area very closely.
---
📌 Strategic Summary:
Strategy Type Action
Long-term Investors Accumulation with strict stop below $0.0700
Swing Traders Wait for breakout of $0.1281 with confirmation
Risk-Averse Traders Avoid until direction is clear above $0.1868 or below $0.0700
#GRT #GRTUSDT #CryptoAnalysis #AltcoinUpdate #TechnicalAnalysis #SupportAndResistance #CryptoBreakout #DemandZone #AltcoinWatchlist #CryptoReversal #TheGraph
GRTUSDT Triangle Coil Tension Builds Bullish Breakout in FocusGRTUSDT is forming a clean symmetrical triangle with price rebounding from the lower trendline which brings an encouraging signal for potential continuation to the upside.
As long as the structure holds, we anticipate a breakout above the triangle, which could ignite strong bullish momentum. The external demand zone remains ideal for strategic accumulation, while the internal supply area should be monitored for signs of short-term rejection.
If buyers absorb pressure at that level, GRT could rally toward the crucial upper supply zone, which marks the next major area for distribution. Let’s see how this unfolds, feel free to share your perspective.

GRT/USDT at a Crossroads: Golden Pocket Retest or Breakdown?The GRT/USDT chart is currently at a critical technical juncture, presenting a high-probability setup for both breakout continuation or breakdown rejection. Here’s a breakdown of the key elements visible on the chart:
---
📐 1. Major Downtrend Breakout
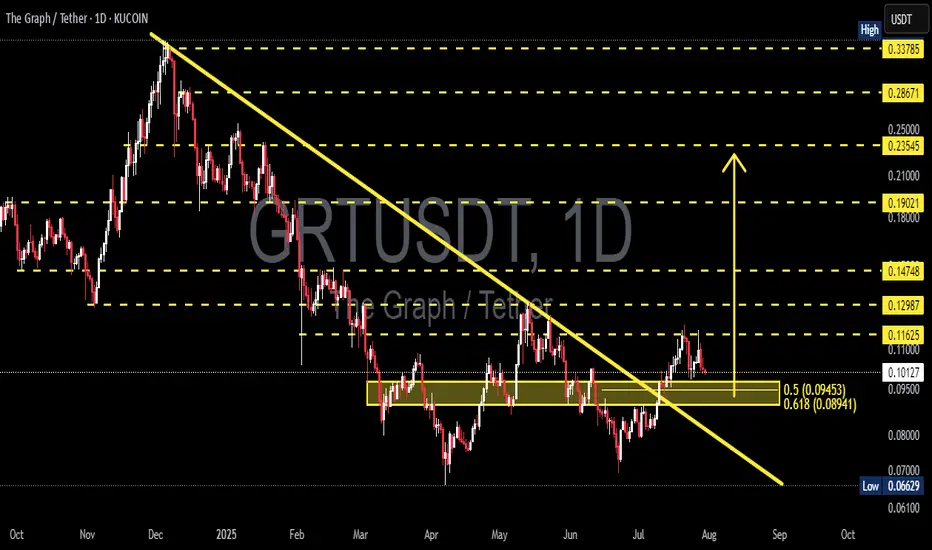
GRT has been in a long-term downtrend since its peak in late 2024, with a well-respected descending trendline acting as resistance.
In mid-July 2025, the price broke above this trendline, signaling a potential trend reversal from bearish to bullish.
While volume was moderate, the breakout is technically valid.
---
📊 2. Golden Pocket Fibonacci Retest
Price is currently retesting the critical Fibonacci retracement zone:
0.5 = $0.09453
0.618 = $0.08941
This range is widely known as the “Golden Pocket”, a high-probability bounce zone during bullish continuation setups.
Price is currently sitting inside this zone, which makes this a potential low-risk entry area.
---
🧱 3. Key Historical Consolidation Zone
The area between $0.089 and $0.095 is not only the golden pocket but also aligns with a strong historical consolidation zone from April to June 2025.
This level acted as both support and resistance, making it a key technical and psychological level.
---
⚔️ Potential Price Scenarios
---
📈 Bullish Scenario (Upside Potential):
If price holds and bounces from the $0.089 – $0.095 support zone:
1. Initial resistance targets:
$0.10185 to $0.11000
2. Followed by breakout targets:
$0.11625
$0.12987
$0.14748
3. Medium-term bullish targets if trend continues:
$0.19021
$0.23545
📌 Bullish Confirmation Signs:
Bullish engulfing or strong reversal candle on the daily close.
Increased volume on the bounce.
RSI recovery from neutral (30–50) zone.
---
📉 Bearish Scenario (Downside Risk):
If price fails to hold above the $0.08941 Fibonacci level:
1. A breakdown below support may trigger further selling pressure.
2. Key downside targets:
$0.08000 (minor support)
$0.06629 (previous swing low)
📌 Bearish Confirmation Signs:
Daily close below $0.089 with strong bearish volume.
RSI drops below 30.
Strong rejection from resistance with bearish structure.
---
🧠 Pattern and Market Structure Insights
Breakout + Retest: Classic setup where price breaks a long-term trendline and returns to retest the breakout zone.
Fibonacci Confluence: The golden pocket aligns with previous price structure, reinforcing its strength.
Hidden Double Bottom (Potential): If price holds, this may also form a subtle double bottom structure — a bullish continuation signal.
---
📚 Conclusion & Trading Strategy
GRT/USDT is currently showing a technically strong setup, with a clean breakout followed by a meaningful retest at a key demand zone.
💡 If you're looking for a strategic long entry, this area offers low risk, high reward potential, provided you manage your stop-loss correctly.
---
🎯 Trade Idea & Risk Management
Potential Entry: $0.089 – $0.095
Conservative Stop Loss: Below $0.088
Initial Target Zone: $0.101 – $0.116
Mid-term Target: $0.19 – $0.23
#GRT #GRTUSDT #TheGraph #AltcoinAnalysis #CryptoBreakout #TechnicalAnalysis #CryptoTrading #FibonacciLevels #TrendlineBreak #GoldenPocket #BullishSetup #BearishBreakdown #CryptoEducation #Altcoins
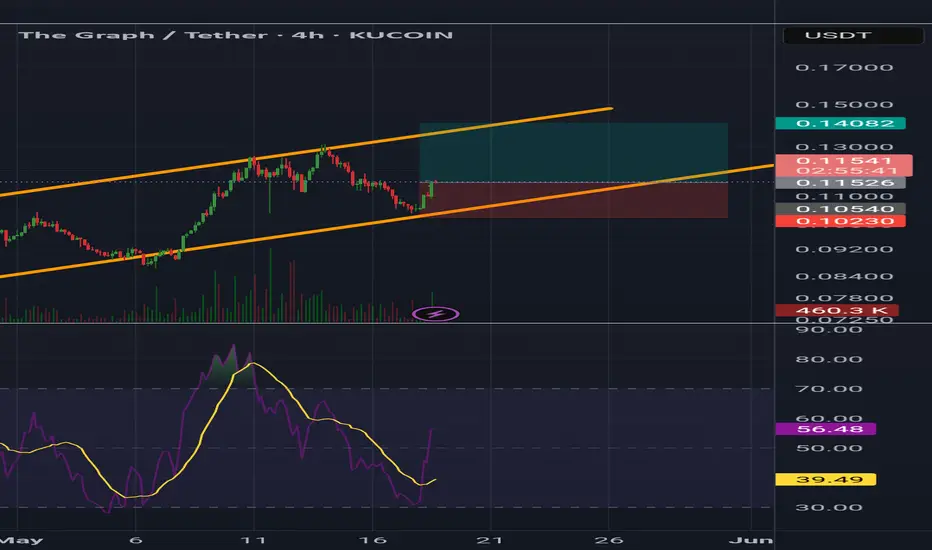
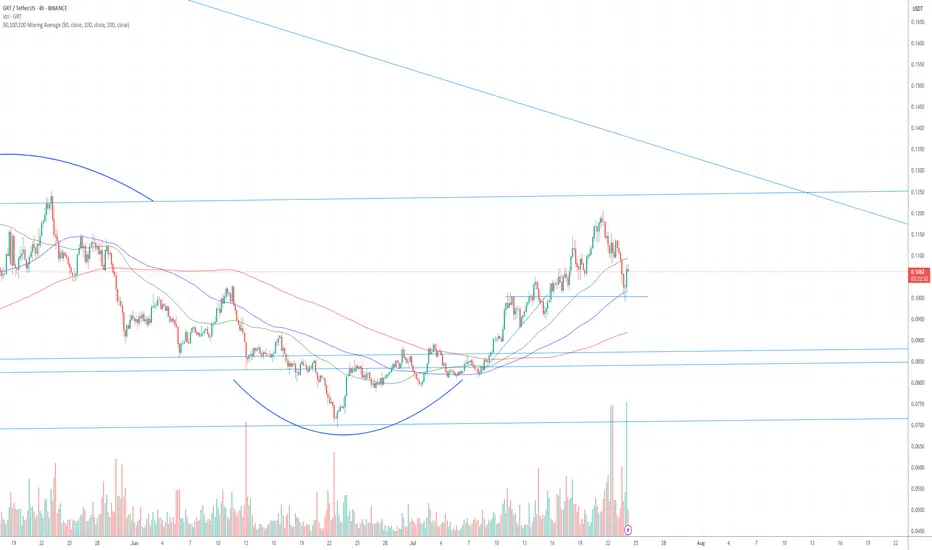
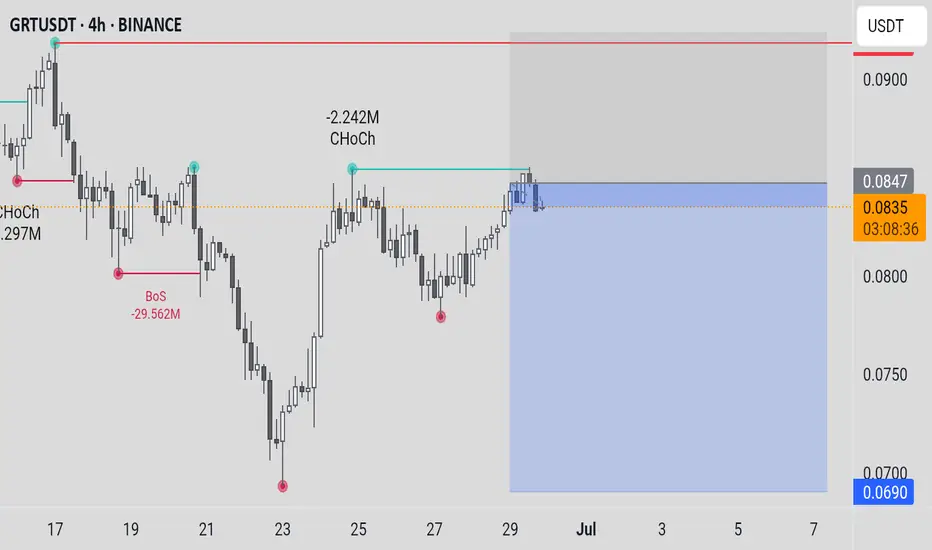
Nice Bounce for GRT - What's next? *4 Hour Charting*I re-entered a trade at the 50ma (on the 4-hour) for a significantly smaller position than my previous trade where I went 40x long. There is no leverage here - not because I lack confidence in the trade, but because risk management is the single most important think you can do to protect yourself... and the best way to risk manage is to POSITION SIZE CORRECTLY.
I bought a traunch (about 1/6 the size of my 40x trade), using all of the profits from from my prior trade. I entered at .102 and feel pretty confident we won't go lower. Thus far we have seen a 7% bounce off the 100ma retest.
If we go lower, the 200ma will act as major support around 0.092 ... If that happened, I would probably re-enter on leverage knowing that this is going to re-test the .12-.13 level again.
Something to note... other coins got crushed much harderr and have yet to rebound...
GRT's rebound shows relative strength - and the higher than normal volume supports his thesis.
Short-Term capitulation likely occurred today with people taking profits and avoiding additional risk.
I will exit this trade on a retest of .12, but as you all know, the more we re-test, the higher the probability we break through it, so I might not actually exit the trade depending on the price action. The longer it takes to hit .12, the less likely I am to close the trade. If we see a re-test to the upside in the next 72-hours, I would likely exit this particular trade.
I have a large core position here that I've been holding since 2021 that I don't intend to sell until we see alt-season in full bloom
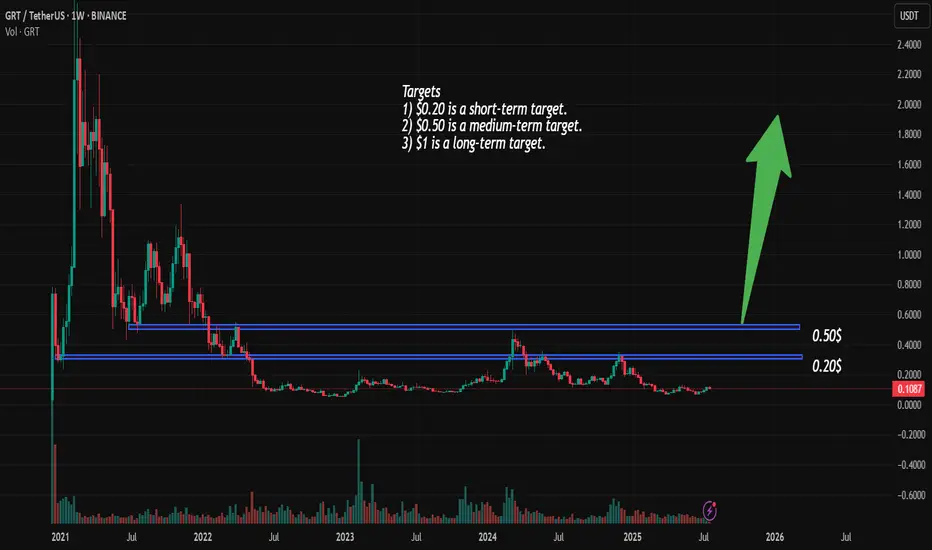
GRT. USDTThe Graph(GRT) is a Web 3 project that is used to search data from other platforms, such as Ethereum.
Similarly, AI (Artificial intelligence) developers can use it to promote their services.
And it has been in a neutral trend for a long time after a sharp correction.
Therefore, the probability of price growth of this project is very high.
The first target is $0.2.
The next targets are $0.5 and $1.
GRT Short Term BullishOverall this crypto is very weak. Most alts are weak, with few exceptions. The Graph has actually been non-stop building even though the coin has bled out for 4+ years. I doubt the long-term trend is bullish, but on the short term, it looks like a standard head and shoulders pattern on the 1-hour. On the 4-hour we have a golden cross - although every other time frame is so bearish.
I started buying some on the left shoulder while it fell in the target zone; I loaded the trade fully on 40x leverage after the right shoulder completed and broker through the zone of resistance.
Looking to see a break of $0.13, which is the top of the head pattern. If we see blow off top in crypto, it should break through decisively over the next 30 days and we could see low .20s
Anything is possible but I may be out of this trade by the time you read this. Not Financial Advice. Probably completely random nonsense.
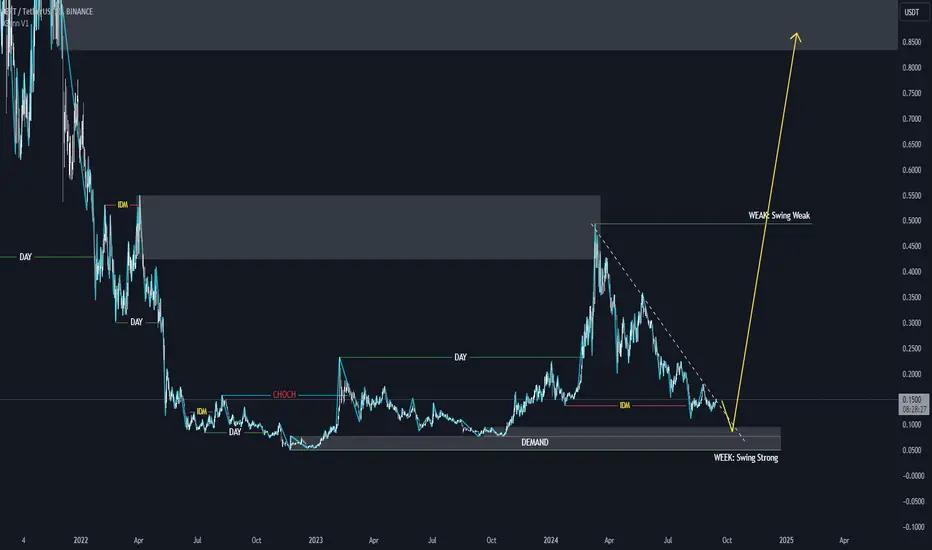
Wave structure of GRT coin in week time frame- Week is swing bullish => current is pullback.
- Day is swing bullish => current is pullback.
- We can look for buying opportunities when there is a reversal signal on the 4-hour time frame or the price reaches the demand zone of the daily frame.
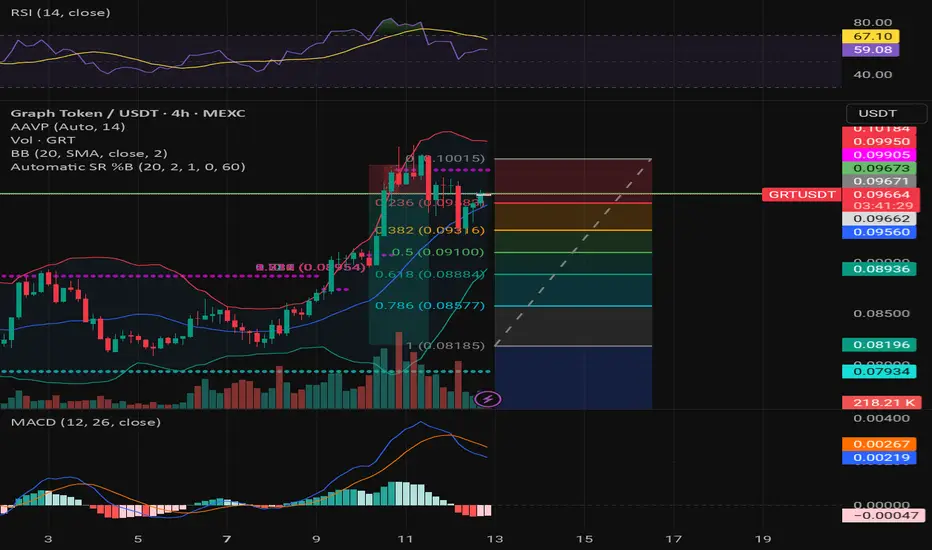
GRT/USDT Short Setup – Fib Reversal Play + Divergence Signals Targeting a short entry on GRT/USDT after key signs of exhaustion and overextension.
🔹 Fib Tool anchored from local bottom at ~$0.08185 to top ~$0.10015
🔹 Currently testing 0.236 retracement at ~$0.09650 after rejection near top of BB
🔹 Bearish divergence forming on RSI (Lower High) vs. price (Higher High)
🔹 MACD histogram flipping red, signal line curling
🔹 Volume declining, suggesting weakness in bullish momentum
🔹 Entry just under $0.097 with tight SL at ~$0.101 (above previous wick)
TP Zones:
• 25% at 0.382 ($0.0910 / ~$0.0888)
• Optional deep catch at 0.786 if market momentum collapses
This idea is designed around structure breaks, mean reversion, and a weakening bullish impulse.
Always DYOR – sharing this for community refinement and feedback.
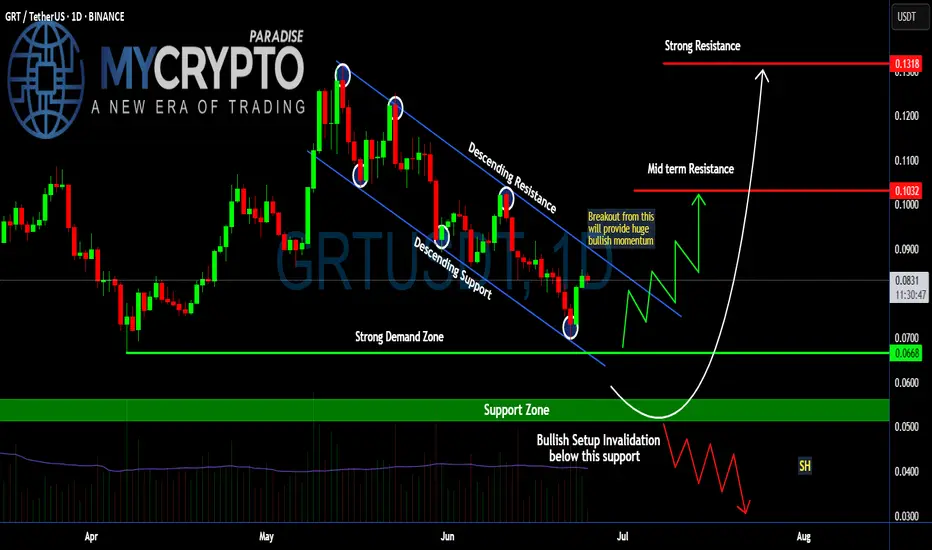
Is a Breakout Imminent for #GRT or Another Bull Trap is Ahead?Yello, Paradisers! Are we looking at a clean breakout setup that could send #GRT flying or is this the perfect trap to wipe out early bulls? Let's see the latest #GRTUSDT moves:
💎The daily chart on #GRTUSD is showing a perfectly formed descending channel, with price now hovering just above the lower boundary—a zone that has consistently held as strong descending support. After multiple rejections from the upper boundary and rebounds off the lower trendline, the price has now shown its first serious signs of momentum since bottoming in the strong demand zone
💎This structure has been in play since early May for #TheGraph, with each bounce from the support line giving temporary relief, only for the price to get slapped down at the descending resistance. But this most recent bounce looks different—it’s happening directly above a well-defined demand zone between $0.0668–$0.0700, a level that has historically attracted strong buyer interest.
💎A breakout above the descending resistance trendline, ideally with a strong daily close above $0.085–$0.090, would invalidate the bearish pressure and likely trigger a sharp leg up. The mid-term resistance sits around $0.1032, and clearing that would open the door to a retest of $0.1318, a level that previously acted as a strong rejection zone.
💎If the price fails to reclaim the descending channel and rolls over again, especially losing $0.0668 on a daily close, the bullish structure would be invalidated. That would shift focus toward the support zone at $0.053, and if that breaks, the next target becomes $0.0300—a brutal drop that would liquidate most late longs and signal deeper downside.
Stay disciplined. The next big opportunity will come to those who wait, not those who chase.
MyCryptoParadise
iFeel the success🌴
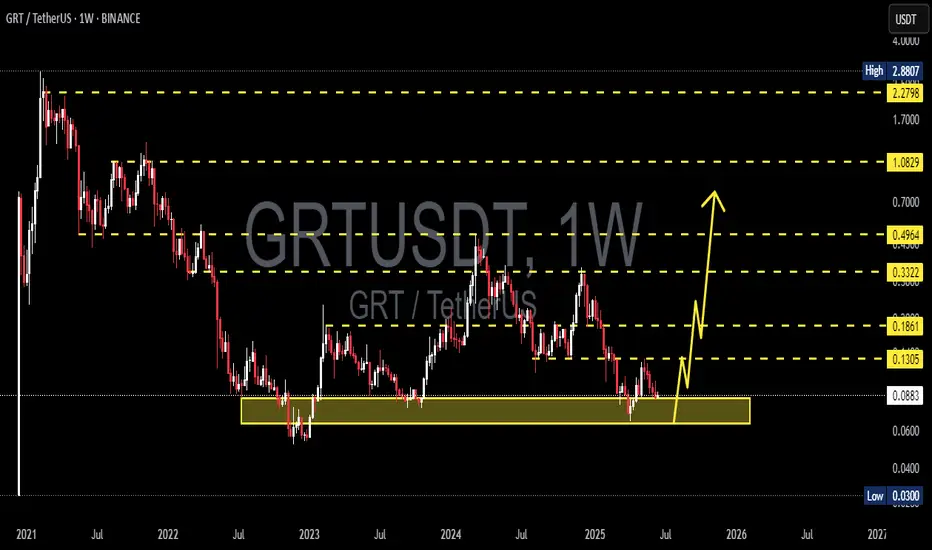
GRT/USDT at a Critical Point! Reversal Structure or Breakdown?📊 Full Technical Analysis – GRT/USDT (1W Timeframe)
🔎 Overview:
GRT is currently positioned at one of the most critical technical levels in its long-term structure. After a prolonged downtrend from the $2.88 all-time high, price is once again testing the historical demand zone between $0.07 – $0.09, which has repeatedly acted as a strong support level since mid-2022. This area represents a major accumulation zone, where smart money may be silently positioning.
🧠 Structure & Pattern Formation:
✅ Historical Demand Zone (Major Support Area):
The $0.07 – $0.09 range has been tested over 5 times in the last 2 years, showing strong demand.
This zone also acts as the potential base of a double bottom pattern, indicating a possible macro reversal.
🟡 Double Bottom Potential (Reversal Pattern):
Two nearly equal lows forming around this demand area hint at a classic double bottom formation.
Confirmation comes if price breaks and holds above $0.1281 resistance.
🔻 Declining Selling Pressure:
Sellers appear to be losing momentum, as seen in the declining weekly volume.
This could signal distribution is ending and accumulation is underway.
📈 Bullish Scenario:
If GRT holds this critical support and breaks above key resistance, a strong mid-term rally may follow:
1. Breakout Confirmation:
Valid if the weekly candle closes above $0.1281.
2. Upside Targets (Fibonacci + Historical Resistance):
🎯 $0.1868 → minor resistance / past consolidation zone.
🎯 $0.2402 → previous rejection area.
🎯 $0.3233 → key Fibonacci retracement level.
🎯 $0.4352 → strong horizontal resistance.
🎯 $0.5285 → mid-term bullish target.
3. Ideal Bullish Conditions:
Bullish divergence on the weekly RSI.
Increasing volume on breakout confirmation.
📉 Bearish Scenario:
If the support fails to hold, GRT could face further downside:
1. Breakdown Below $0.07 – $0.09 Zone:
⚠️ $0.0550 → minor support.
⚠️ $0.0300 → All-Time Low and psychological support.
2. Deeper Risk:
If panic selling occurs or broader market sentiment worsens, GRT may print new lows, continuing its long-term bearish trend.
🧭 Conclusion & Strategy:
> GRT is in a highly interesting accumulation phase from a technical perspective.
The risk-to-reward from this support zone is attractive, with signs of a potential reversal building. However, traders should wait for confirmation and always use proper risk management.
Entry Strategy:
Speculative entry: inside the $0.08–$0.09 zone (tight stop-loss below $0.07).
Confirmed entry: after breakout and weekly close above $0.1281 (targeting levels mentioned above).
#GRT #TheGraph #GRTUSDT #CryptoReversal #DoubleBottom #SupportZone #AltcoinSetup #BullishCrypto #BearishRisk #TechnicalAnalysis
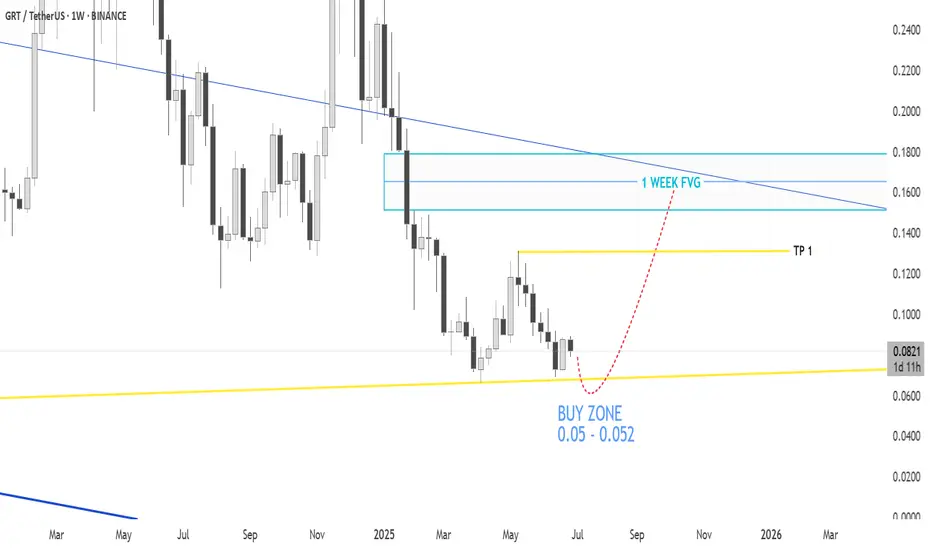
GRT/USDT: The Graph's Phoenix Rising - A Technical Deep Dive🎯 The Trading Strategy : ⚠️ The Reality Check
Let's be honest - this trade isn't without risks...
Entry Strategy:
The Golden Support Zone : 0.05-0.055 (ALL TIME LOW levels)
⚡Target 1: $0.11
⚡Target 2: $0.13
⚡Target 3: midlle of 1W FVG
🔥 Risk/Reward: 4:1 🔥
_________________
Risk Management:
Stop Loss: 0.048 (Below major support)
Trade smart, trade safe, and may the charts be ever in your favor! 🚀
🚨 RISK WARNING 🛡️ DYOR 🚨 DISCLAIMER - JUST FOR EDUCATION PROPOSAL ⚠️
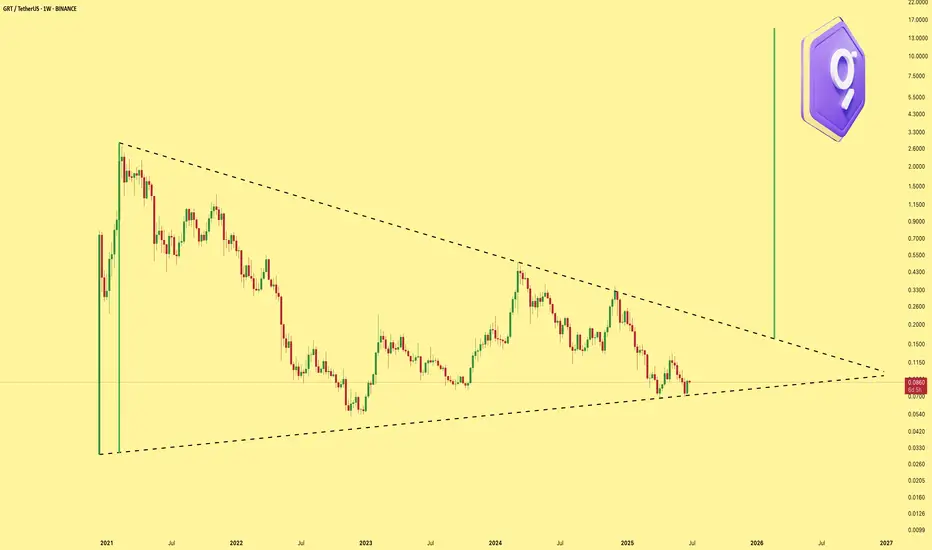
GRTJSE:GRT has formed a symmetrical triangle. Measuring the triangle’s range to its breakout gives a target around $15. This one is often called the Google of DeFi
GRTUSDTCryptocurrency Futures Market Disclaimer 🚨🚨🚨
Trading cryptocurrency futures involves high risks and is not suitable for all investors.
Cryptocurrency prices are highly volatile, which can lead to significant gains or losses in a short period.
Before engaging in crypto futures trading, consider your risk tolerance, experience, and financial situation.
Risk of Loss: You may lose more than your initial capital due to the leveraged nature of futures. You are fully responsible for any losses incurred.
Market Volatility: Crypto prices can fluctuate significantly due to factors such as market sentiment, regulations, or unforeseen events.
Leverage Risk: The use of leverage can amplify profits but also increases the risk of total loss.
Regulatory Uncertainty: Regulations related to cryptocurrencies vary by jurisdiction and may change, affecting the value or legality of trading.
Technical Risks: Platform disruptions, hacking, or technical issues may result in losses.
This information is not financial, investment, or trading advice. Consult a professional financial advisor before making decisions. We are not liable for any losses or damages arising from cryptocurrency futures trading.
Note: Ensure compliance with local regulations regarding cryptocurrency trading in your region.
thanks for like and follow @ydnldn
GRTUSDT 1W AnalysisGRT ~ 1W Analysis
#GRT Buy back gradually from here with a short term target of at least 20%+ from this support.
The altcoin cycle is loading… don’t get caught chasing!Why It Might Be a Good Time to Start Building Your Nest Now 🥚🐣💸
If history’s taught us anything, it’s this: the best opportunities usually show up before everyone’s talking about them. 📈 Every cycle, whether it’s stocks, crypto, or real estate, rewards the people who start stacking early, not the ones waiting for a perfect moment (spoiler: it rarely comes).
A lot of people sit on the sidelines thinking they’ll “jump in later” … but by the time it feels safe, the big moves have usually already happened. 👀💨
Of course, this isn’t financial advice, just something to think about. 🤝 The ones who build their nest patiently, stay consistent, and prepare ahead of time tend to be the ones who win when the cycle really kicks off. 🛠️
Moral of the story: Start now, stay ready. Your future self will thank you. 🚀🫡

Maintaining support is necessary, not essential, for the climb.Hello friends🙌
🔊Given the price drop, you can see that the support we identified has worked well for you so far and buyers have supported the price.
Now, given the heavy price drop and disappointment in the market, we can expect a rise until the targets are set.
Don't forget capital and risk management, friends.🙏
🔥Join us for more signals🔥
*Trade safely with us*

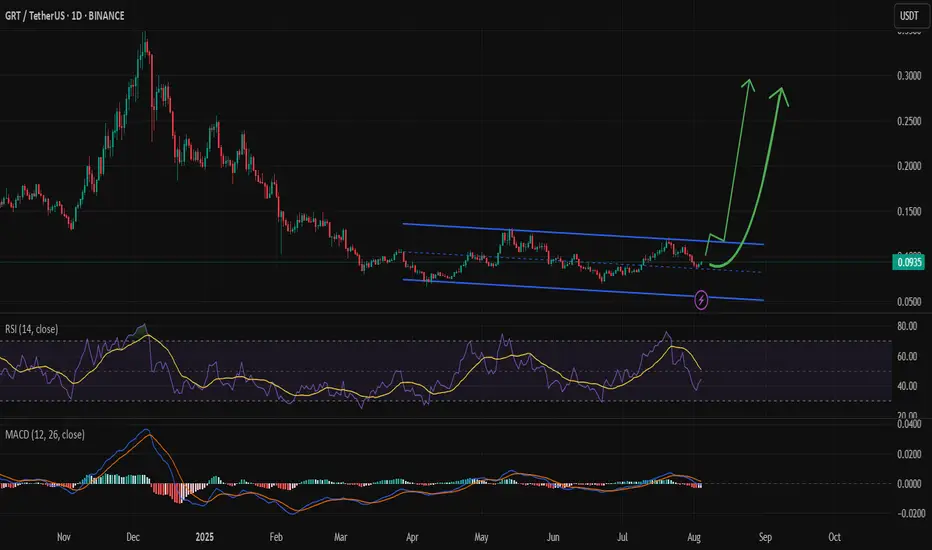
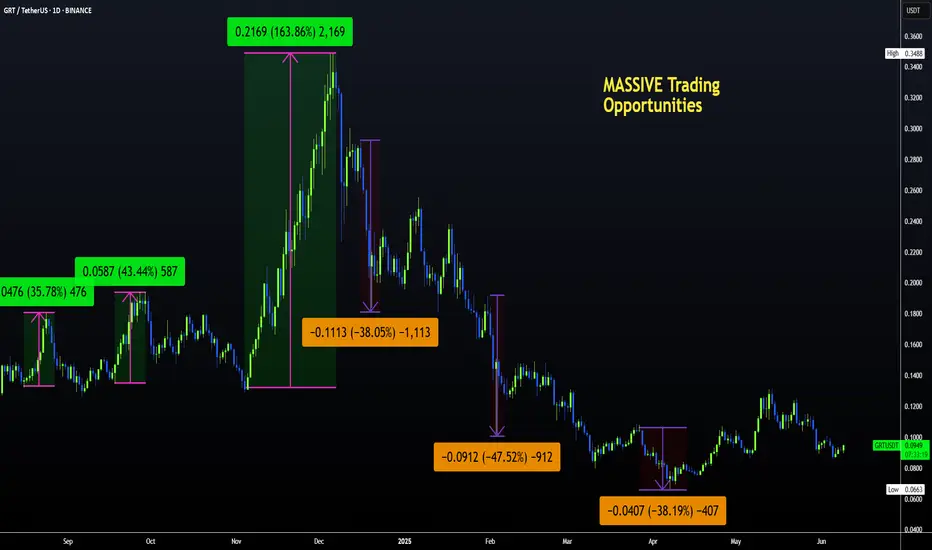
GRT | Altcoins | MASSIVE UPSIDE Potential on The GraphAnother altcoin that has great upside potential is the Graph BINANCE:GRTUSDT
The Graph from a weekly perspective may seem like there's not much action, but if you zoon in to the daily timeframe we see a different picture.
WEEKLY:
VS DAILY:
We can see anything from a +40% increase to a -30% dip in just a few days; a picture that is lost when we look at the weekly. This is IDEAL for swing trading.
Once you've established the general direction from the MACRO, swing trades become very viable (spot). If your patient enough to wait for a few days, a +30% could easily be achieved within a two week timespan.
______________________
BINANCE:GRTUSDT
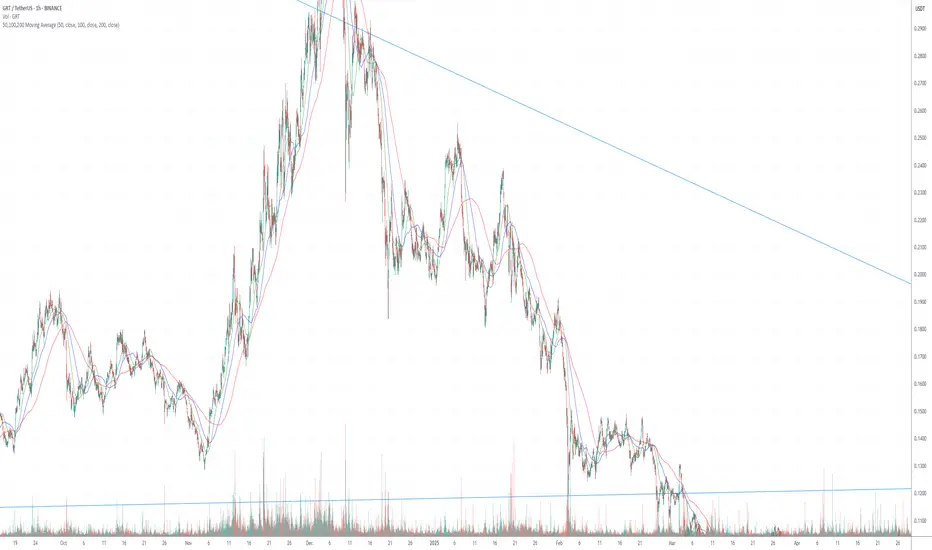
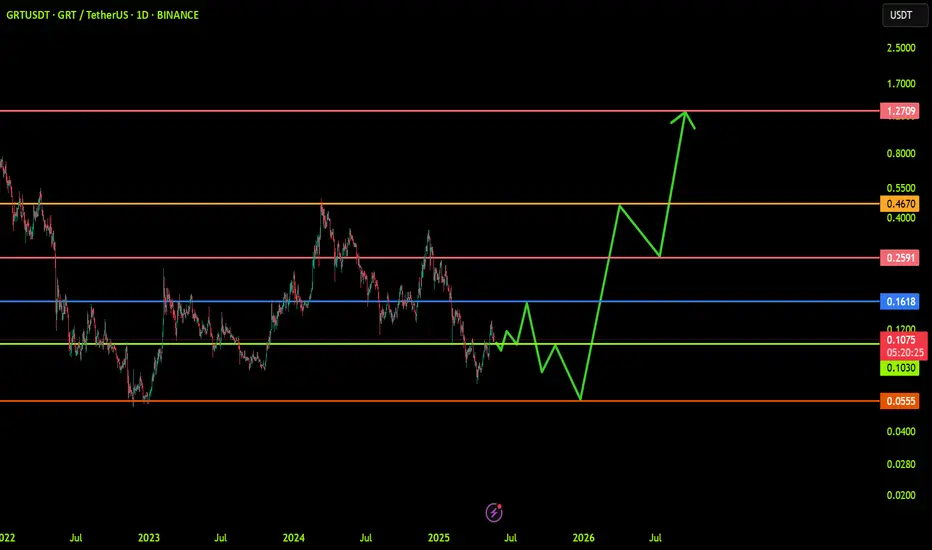
GRTUSDT: Trend in daily time frameThe color levels are very accurate levels of support and resistance in different time frames, and we have to wait for their reaction in these areas.
So, Please pay special attention to the very accurate trend, colored levels, and you must know that SETUP is very sensitive.
Be careful
BEST
MT
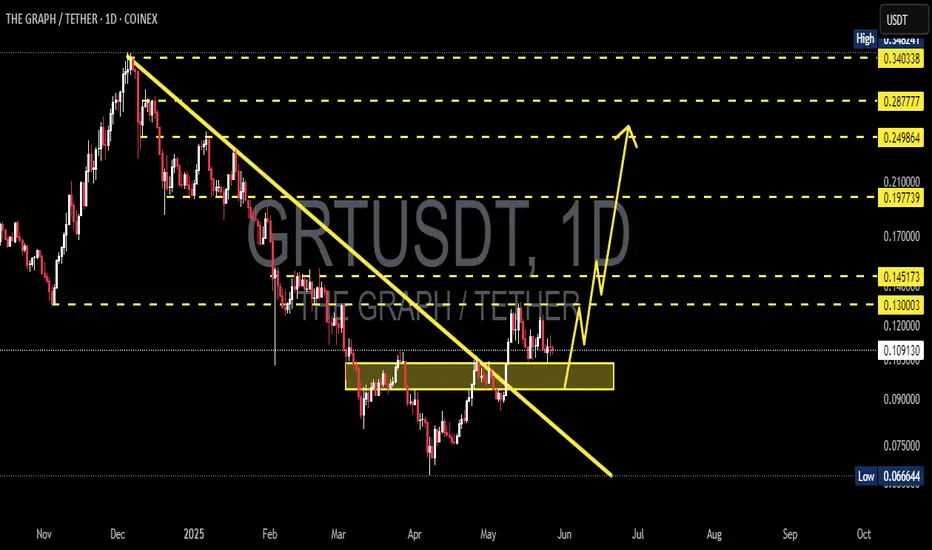
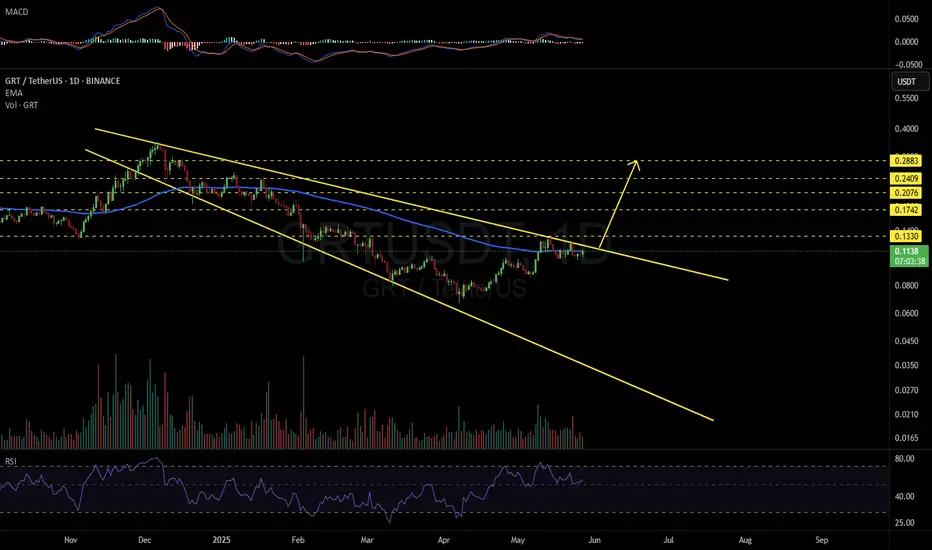
GRTUSDT 1D#GRT is moving inside a Descending Broadening Wedge on the daily chart and is now on the verge of breaking out above both the EMA100 and the wedge resistance. 📈
In case of a successful breakout, the targets are:
🎯 $0.1330
🎯 $0.1742
🎯 $0.2076
🎯 $0.2409
🎯 $0.2883
⚠️ Don’t forget to use a tight stop-loss to manage risk effectively.
GRTUSDT 1D AnalysisGRT ~ 1D Analysis
#GRT On the 1D time frame the selling pressure has stopped.. Buy on this support block with a short term target of at least 10%+ from here.