#GTC/USDT#GTC
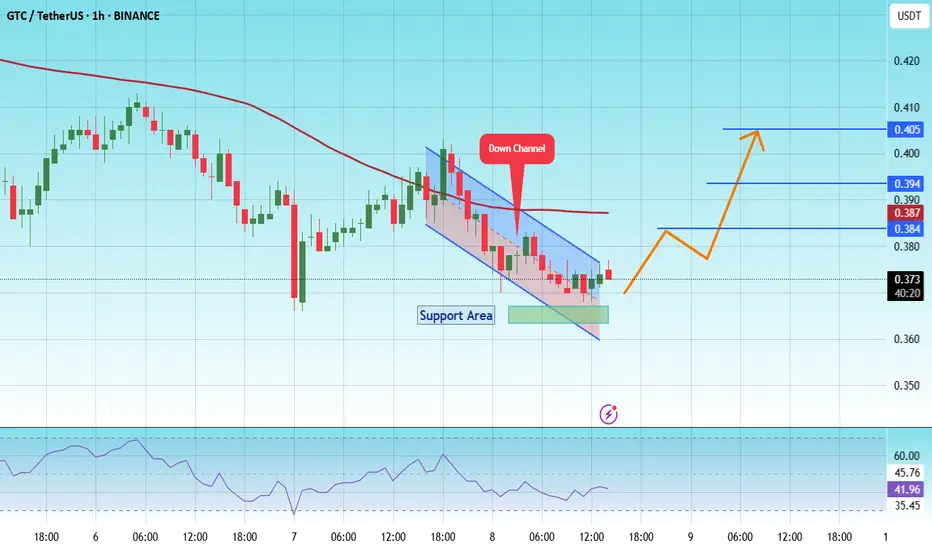
The price is moving within a descending channel on the 1-hour frame, adhering well to it, and is heading towards a strong breakout and retest.
We are seeing a bounce from the lower boundary of the descending channel. This support is at 0.224.
We have a downtrend on the RSI indicator that is a

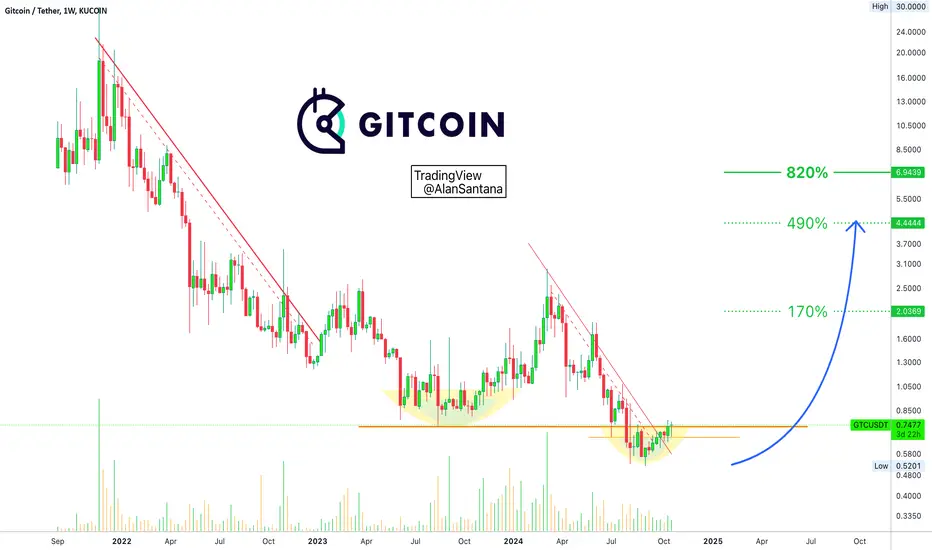
GTC Eyes Reversal from Accumulation Base GTC/USDT is bouncing off a long-term descending channel’s base, showing possible signs of accumulation. A move toward the $0.55–$0.75 supply zone is expected, with a potential breakout targeting $2.23 if momentum sustains. We must pay a close attention to a breakdown below $0.248 which will open a

#GTC/USDT#GTC
The price is moving in a descending channel on the 1-hour frame and is expected to continue upwards
We have a trend to stabilize above the moving average 100 again
We have a descending trend on the RSI indicator that supports the rise by breaking it upwards
We have a support area at the low
2.0 RRInteresting option, looks to be a strong UR, strong support on multiple TFs which should have a bounce!

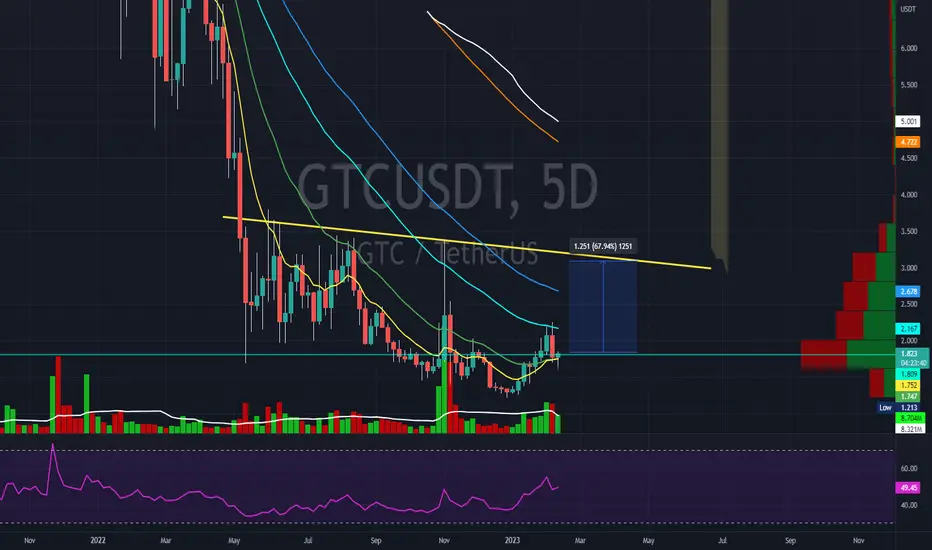
GTCUSDT.1DThe daily chart of GTC/USDT shows an interesting pattern of recovery after a significant downtrend, marked by a descending resistance line that has recently been breached. This analysis will focus on the current breakout, resistance, and support levels, alongside indicators to understand the ongoing

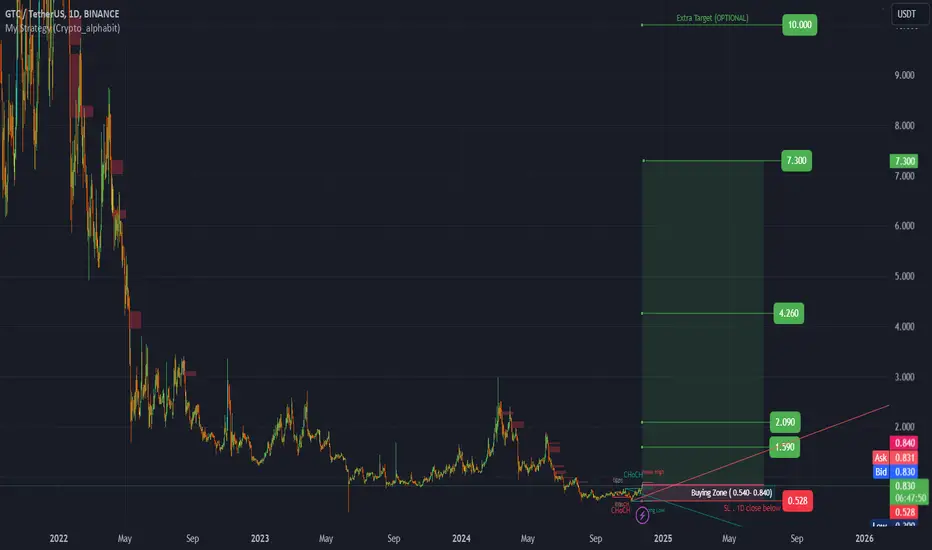
#GTC (SPOT) entry ( 0.540- 0.840) T.(7.3 ) SL(0.528)BINANCE:GTCUSDT
entry range ( 0.540- 0.840)
Targets ( 1.59 - 2.09 - 4.26 - 7.3 )
1 Extra Targets(optional) in chart, if you like to continue in the trade with making stoploss very high.
SL .4H close below (0.528)
______________________________________________________________
Golden Advices.
****
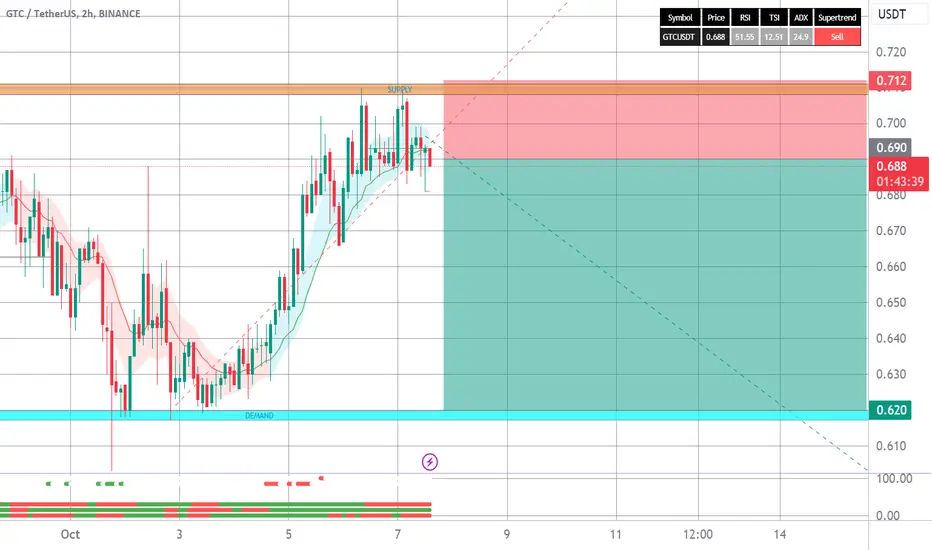
Trade Signal for GTCUSDT PairAttention Traders,
We have a fresh trading signal for the GTCUSDT pair. Based on a thorough analysis utilizing the EASY Quantum Ai strategy, we predict a bearish movement for this pair. Let's delve into the specifics of this signal:
Direction: Sell
Enter Price: 0.683
Take Profit: 0.649

Gitcoin To The Moon: 800%+ Liquidity Hunt ExplainedYou could say that the only reason why Gitcoin is bullish now is because recently it produced a new All-Time Low. Imagine the new huge difference: a pair trading near its All-Time High and another one trading near its All-Time Low, opposite poles.
➖ GTCUSDT bottomed, hitting the lowest ever, 2-Sept
GTC inverted head and shouldersVery nice patter is forming... price should hit neckline on the chart, then consolidate a bit and go higher with good market conditions. GL
NOT A FINANCIAL ADVICE + USE STOPLOSS + MANAGE YOUR RISK
GTCUSDTThis short position on GTCUSDT aims to capitalize on potential downside momentum in the market. The trade is built around a clear bearish outlook, with entry, Take Profit, and Stop Loss levels in place to ensure effective risk management. The strategy is designed to take advantage of selling pressur
See all ideas
Summarizing what the indicators are suggesting.
Oscillators
Neutral
SellBuy
Strong sellStrong buy
Strong sellSellNeutralBuyStrong buy
Oscillators
Neutral
SellBuy
Strong sellStrong buy
Strong sellSellNeutralBuyStrong buy
Summary
Neutral
SellBuy
Strong sellStrong buy
Strong sellSellNeutralBuyStrong buy
Summary
Neutral
SellBuy
Strong sellStrong buy
Strong sellSellNeutralBuyStrong buy
Summary
Neutral
SellBuy
Strong sellStrong buy
Strong sellSellNeutralBuyStrong buy
Moving Averages
Neutral
SellBuy
Strong sellStrong buy
Strong sellSellNeutralBuyStrong buy
Moving Averages
Neutral
SellBuy
Strong sellStrong buy
Strong sellSellNeutralBuyStrong buy
Displays a symbol's price movements over previous years to identify recurring trends.