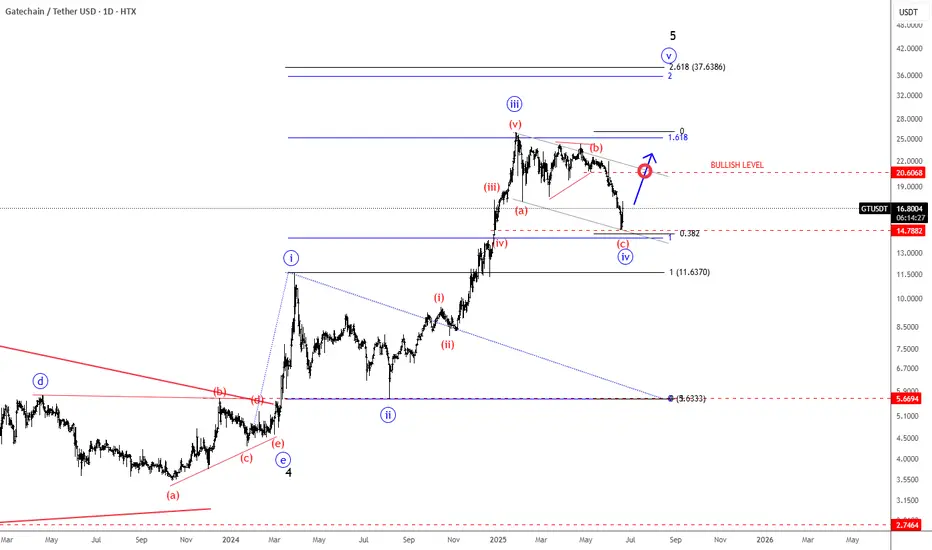
GateChain Slows Down Within An Impulsive Bullish TrendGateChain with ticker GTUSD came slightly lower, but we still see it trading in a higher degree wave »iv« correction that can resume the bullish trend for wave »v«. It can be actually finishing final subwave (c) of a three-wave (a)(b)(c) corrective decline, so keep an eye on strong support here at
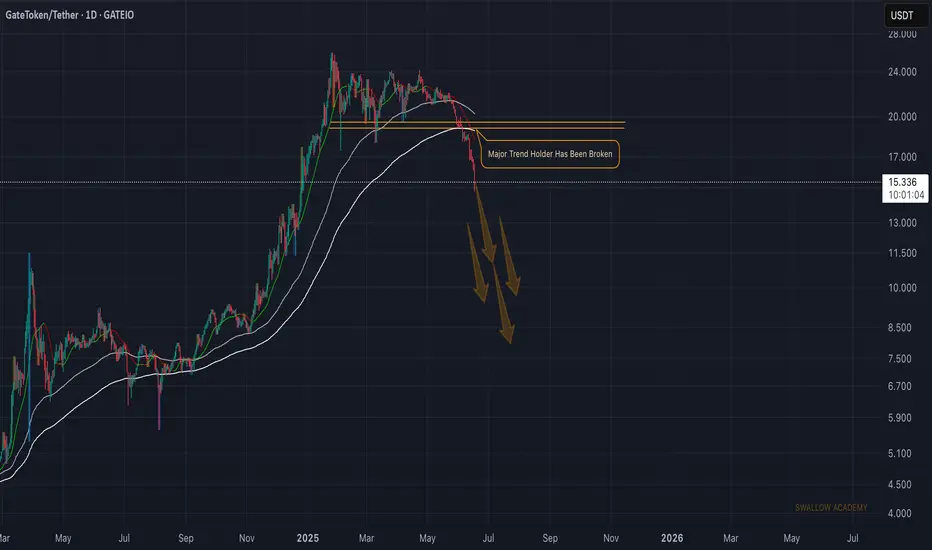
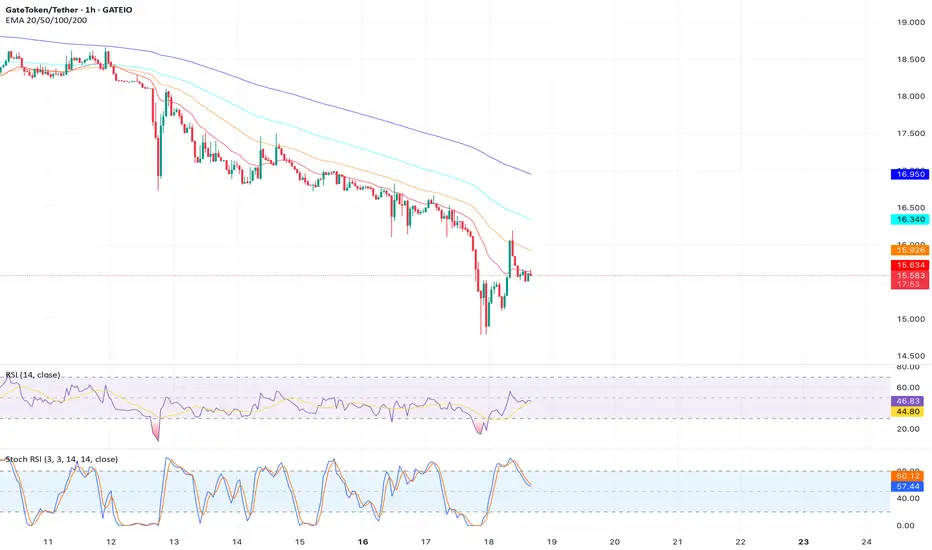
GateToken (GT): Major Trend Holder 200EMA Has Been BrokenGatecoin seems to be doomed, where we have had a market structure break (MSB), which then led to a break of the 200EMA.
Now if we do not see any foundation to form here (in form of support), then we are doomed, and price can dip as low as $9.20
Swallow Academy
$GT’s Inverted Adam & Eve Pattern Targets $13.50Analysis: On the weekly chart, NASDAQ:GT is forming an inverted Adam & Eve pattern, a bearish reversal signal. The price is below the 20-week SMA ($15.90), and trading volume is decreasing on rebounds, indicating reduced buyer interest. A break below $15.30 could trigger a sharp decline.
Key Level
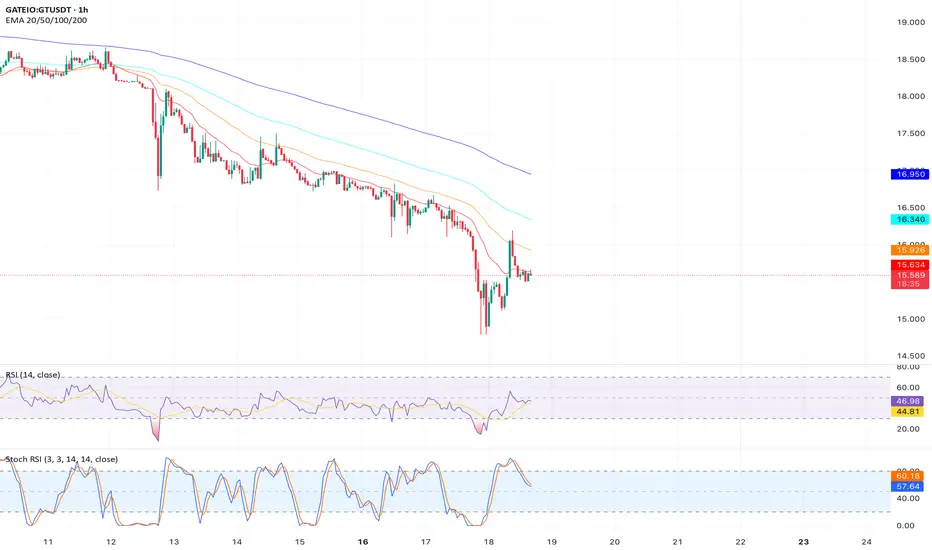
$GT’s Break Below 200-EMA Signals $14.00 TargetAnalysis: NASDAQ:GT has broken below the 200-day EMA ($15.50) on the daily chart, a significant bearish signal. The price is forming a bearish flag pattern, with the RSI at 42 trending downward. Recent posts on X highlight NASDAQ:GT ’s weak market structure, supporting a bearish bias.
Key Levels

$GT’s Bearish Channel Targets $13.80 SupportAnalysis: NASDAQ:GT is trading within a descending channel on the daily chart, with the price rejecting the upper trendline at $16.00. The RSI is at 40, nearing oversold but with room for further downside. Volume is higher on bearish candles, indicating seller dominance.
Key Levels:
Support: $14.5

$GT’s Lower Highs Confirm Bearish Trend to $14.2Analysis: On the 4-hour chart, NASDAQ:GT is forming lower highs, signaling a bearish trend. The price is below the 50-period SMA ($15.75), and the ADX is rising, indicating strengthening bearish momentum. Support at $15.30 was breached, setting up a move toward the next key level.
Key Levels:
Supp

$GT’s Failure at $16.00 Resistance Targets $13.5Analysis: NASDAQ:GT failed to break the $16.00 resistance on the daily chart, forming a bearish shooting star candle. The price is below the 50-day SMA ($15.80), and the MACD is showing a bearish crossover. Declining volume indicates fading bullish conviction, aligning with broader altcoin weaknes
$GT’s Overbought RSI Signals Pullback to $14.5Analysis: The 1-hour chart shows NASDAQ:GT trading near the upper Bollinger Band ($16.20) with an RSI of 78, indicating overbought conditions. A bearish divergence is forming, as the RSI declines while price tests resistance at $15.80. Low volume on recent highs suggests fading momentum.
Key Level

$GT Forms Bearish Head and Shoulders, Eyes $14.00Analysis: On the 4-hour chart, NASDAQ:GT is forming a head and shoulders pattern with a neckline at $15.50. The price is trading below the 20-day SMA ($15.70), and the Stochastic Oscillator is in overbought territory, signaling a potential reversal. A breakdown below $15.50 could accelerate sellin
$GT Bearish Breakdown Below $15.30 Targets $13.80Analysis: NASDAQ:GT has broken below the 50-day SMA ($15.80) on the daily chart, confirming a bearish shift in market structure. The RSI at 45 is trending downward, and declining volume on rebounds suggests weak buying interest. A retest of the broken support at $15.30 failed, aligning with a bear
See all ideas
Summarizing what the indicators are suggesting.
Oscillators
Neutral
SellBuy
Strong sellStrong buy
Strong sellSellNeutralBuyStrong buy
Oscillators
Neutral
SellBuy
Strong sellStrong buy
Strong sellSellNeutralBuyStrong buy
Summary
Neutral
SellBuy
Strong sellStrong buy
Strong sellSellNeutralBuyStrong buy
Summary
Neutral
SellBuy
Strong sellStrong buy
Strong sellSellNeutralBuyStrong buy
Summary
Neutral
SellBuy
Strong sellStrong buy
Strong sellSellNeutralBuyStrong buy
Moving Averages
Neutral
SellBuy
Strong sellStrong buy
Strong sellSellNeutralBuyStrong buy
Moving Averages
Neutral
SellBuy
Strong sellStrong buy
Strong sellSellNeutralBuyStrong buy
Displays a symbol's price movements over previous years to identify recurring trends.
Curated watchlists where GTUSDT.P is featured.

Up-and-coming crypto: New kids on the block
30 No. of Symbols
See all sparks