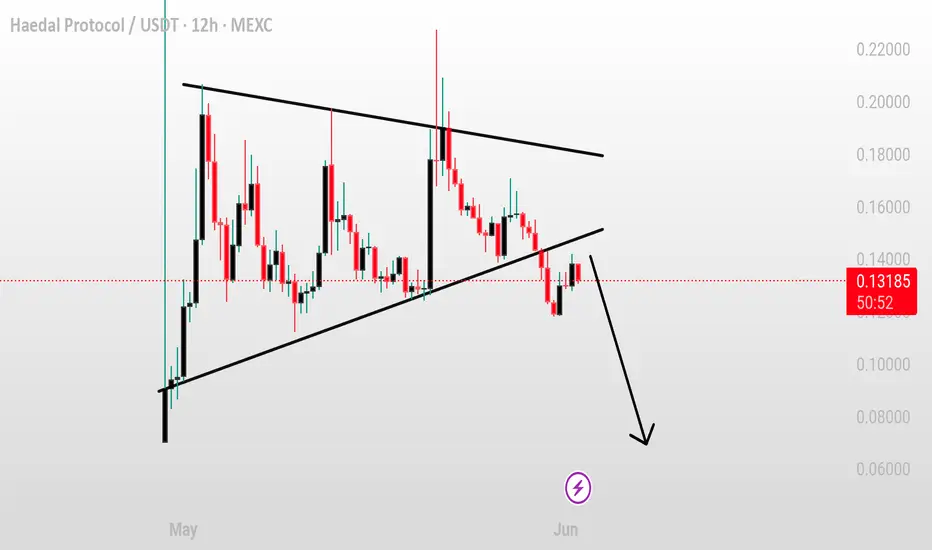
HAEDALUSDT breakdown alertHAEDALUSDT breakdown alert
HAEDALUSDT has broken down from a triangle pattern and appears to have completed a retest of the breakdown zone. If the retest holds and price continues to reject that level, it may confirm bearish momentum and open the way for further downside.
Key levels to watch:
– Br
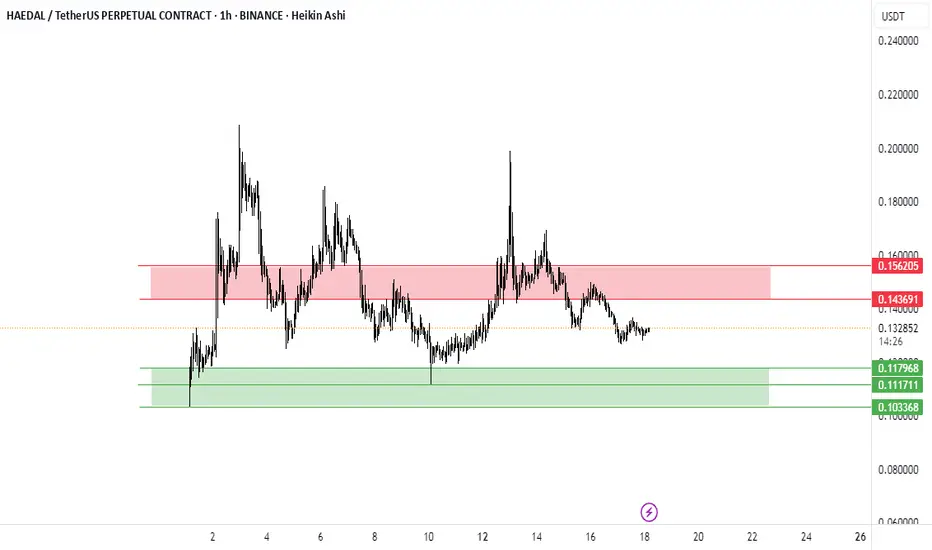
$HAEDAL/USDT Analysis (4H Chart):
The chart is showing a falling wedge pattern, typically a bullish reversal setup. The price is currently testing the upper boundary of the wedge near 0.131 USDT.
🔸 Key Support Zone at 0.125 - 0.110:
This green zone has acted as a strong demand area historically and is being respected again.
🔸 Up

HAEDAL/USDT Volume surge !!!Box Formation with Strong Volume Surge
Big Buyers Stepping In?
Over the past 22 days, we've seen a well-defined box formation
This kind of setup often precedes a breakout, especially when supported by strong volume. DCA on green box for potential 70% up move — a confirmed breakout with volume co

HAEDAL Analysis (4H)The HAEDAL correction has started from the point marked with the red arrow on the chart.
This correction appears to be a diametric pattern. The green zone is where the price correction may complete, and the price could enter wave F.
The targets are marked on the chart.
A daily candle closing belo


See all ideas
Summarizing what the indicators are suggesting.
Oscillators
Neutral
SellBuy
Strong sellStrong buy
Strong sellSellNeutralBuyStrong buy
Oscillators
Neutral
SellBuy
Strong sellStrong buy
Strong sellSellNeutralBuyStrong buy
Summary
Neutral
SellBuy
Strong sellStrong buy
Strong sellSellNeutralBuyStrong buy
Summary
Neutral
SellBuy
Strong sellStrong buy
Strong sellSellNeutralBuyStrong buy
Summary
Neutral
SellBuy
Strong sellStrong buy
Strong sellSellNeutralBuyStrong buy
Moving Averages
Neutral
SellBuy
Strong sellStrong buy
Strong sellSellNeutralBuyStrong buy
Moving Averages
Neutral
SellBuy
Strong sellStrong buy
Strong sellSellNeutralBuyStrong buy