Hbar to 0.236 fib for backtest?@Dogg561 Hii
Here an update,
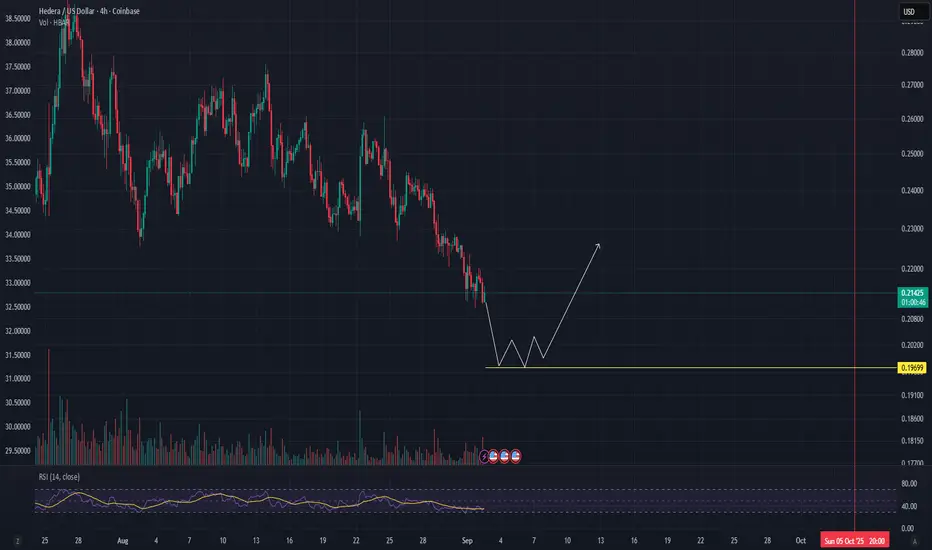
Hbar did a beautifull 5 move up. After this its likely it wil make an abc correction. For now just need to see a pull down for the wave A (doesnt matter where it goes), after that it needs to make a Wave B (also doesnt matter where it goes) Afther those 2 waves (A&B) y
Key stats
About Hedera Hashgraph
Related coins

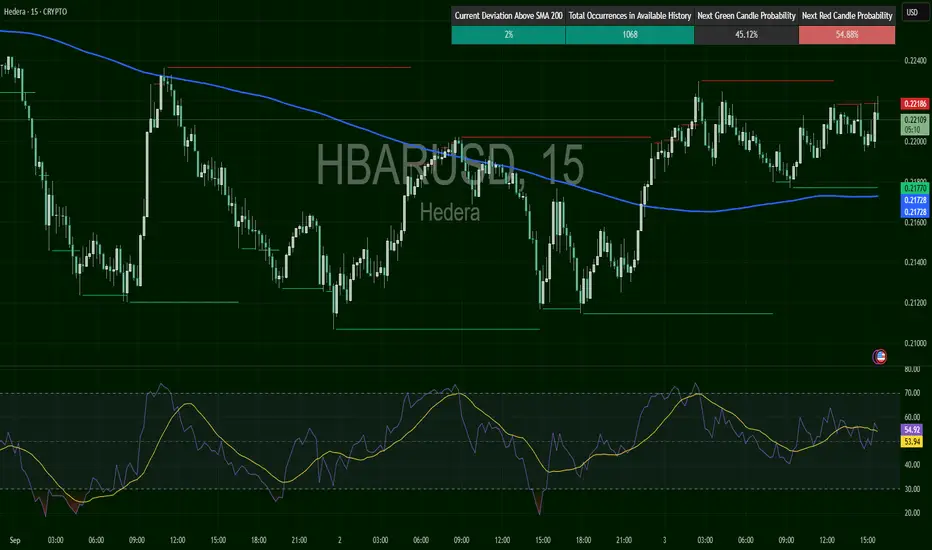
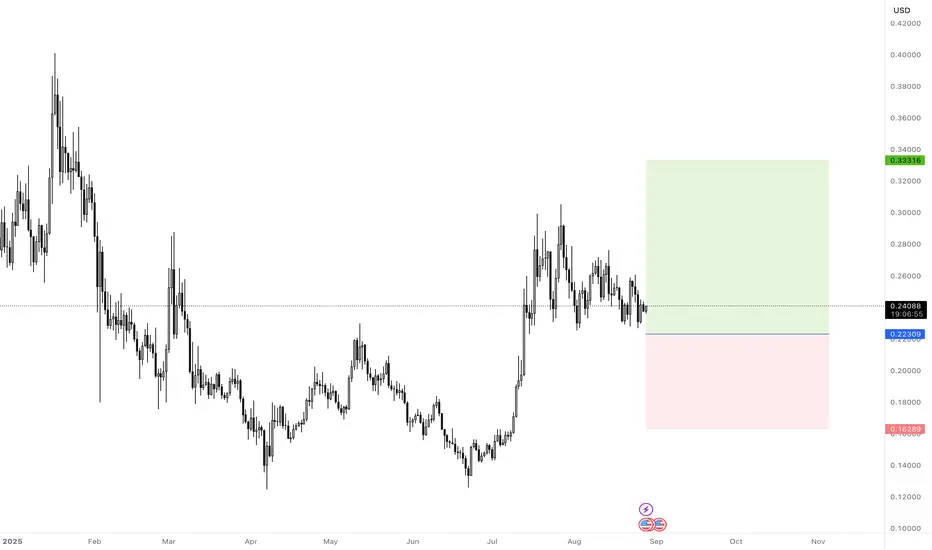
HBAR/USD – Testing Resistance🔴 SHORT below $0.2219 – target $0.2172
Hedera trades at $0.2214, under resistance at $0.2219. The 200 SMA ($0.2177) provides support. RSI at 54 shows moderate strength, but probabilities tilt bearish. Failure at $0.2219 could bring a pullback toward $0.2172.
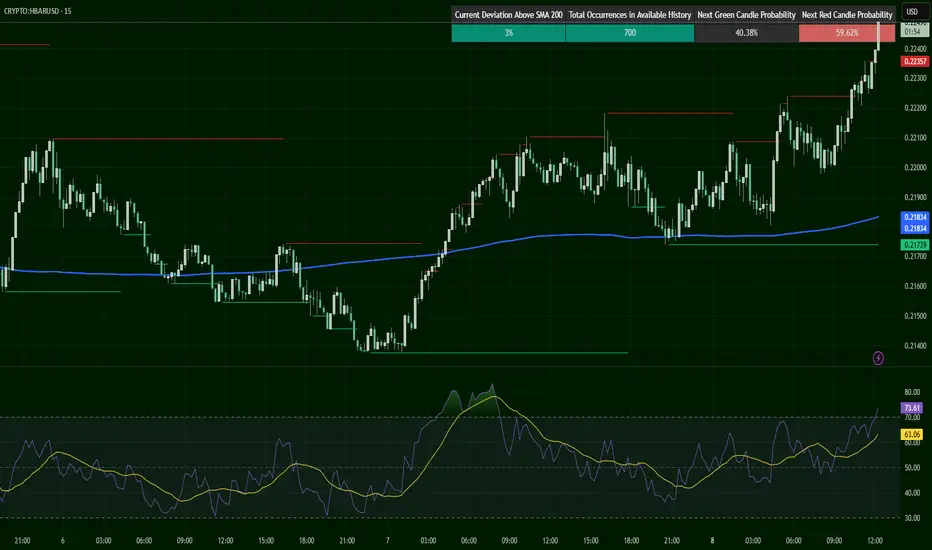
HBAR/USD – Into Overbought Zone🔴 SHORT below $0.2235 – target $0.2174
Hedera trades at $0.2237, well above SMA200 ($0.2182). Resistance: $0.2240, support: $0.2174. RSI hot at 68, near overbought. Rally looks stretched — rejection risk high if $0.2240 fails to break.
📊 Keywords: #HBARUSD #Hedera #CryptoShort #Overbought #Resista
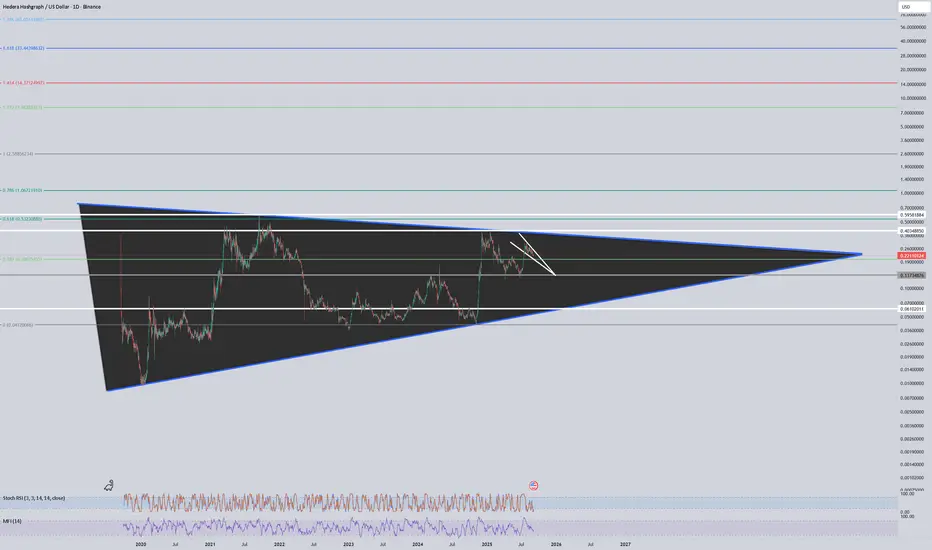
Squeeze is in the works. Stay tuned for the next move. Barring a major crash in the crypto sector, 40 cents is the next likely move for HBAR.
If it crosses and sustains above 40 cents, then a move to its all-time high (57 cents) is very likely.
If it breaks below the wedge, then 13 cents is the next target. 0.8 cents below that.
LONG-TERM, THIS HAS
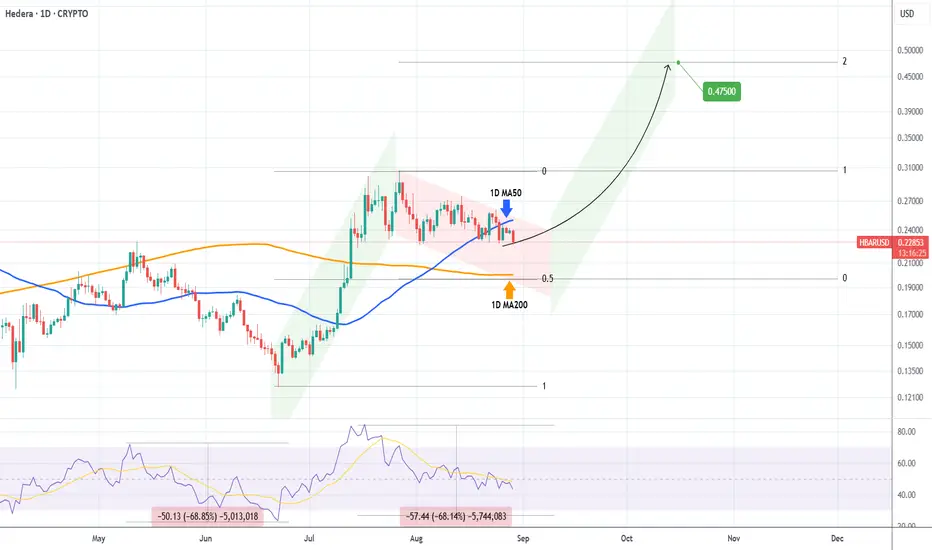
HBARUSD Is this a Bull Flag to 0.47500?Hedera (HBARUSD) is trading below its 1D MA50 (blue trend-line) along with the majority of the market and has found itself within a Channel Down (red) on this correction.
This correction may simply be a technical pull-back in the form of a Bull Flag. As long as the 1D MA200 (orange trend-line) hold
HBAR/USD Still WeakHBAR/USD looks like it's heading towards .19-.20 for now. Will be followed by a big rally after
HBARUSD Long setupHi everyone.
This Hedera idea is good for investors.
This entry level is based on the weekly FVG area.
Let's see how the market reacts...
Dear traders, please support my ideas with your likes and comments to motivate me to publish more signals and analysis for you.
Best Regards
Navid Nazarian
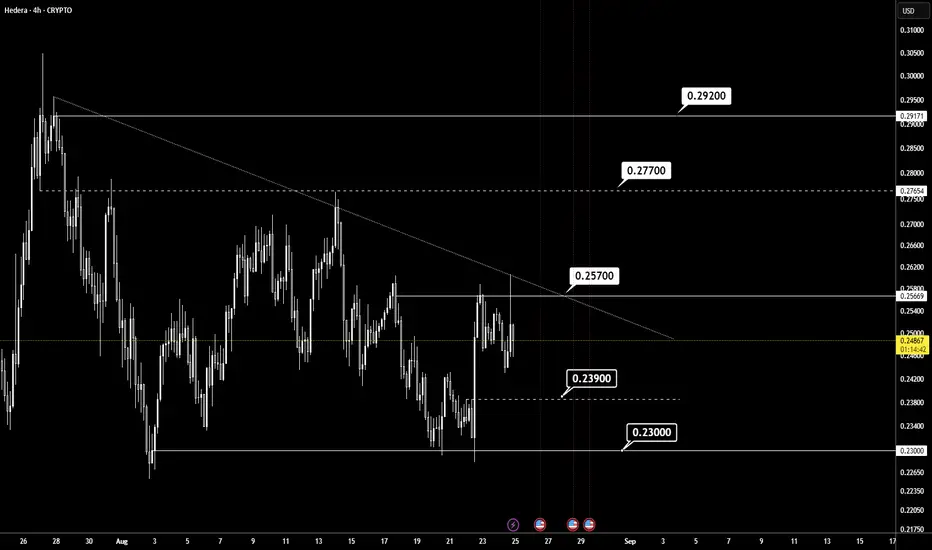
HBARUSDCOINBASE:HBARUSD try to break 0.257$ but we hope up-trend in last reaction to 0.257$ an break this level.
Best support: 0.239 - 0.230
Best resistance: 0.257 - 0.277 - 0.292
Please control risk management⚠️
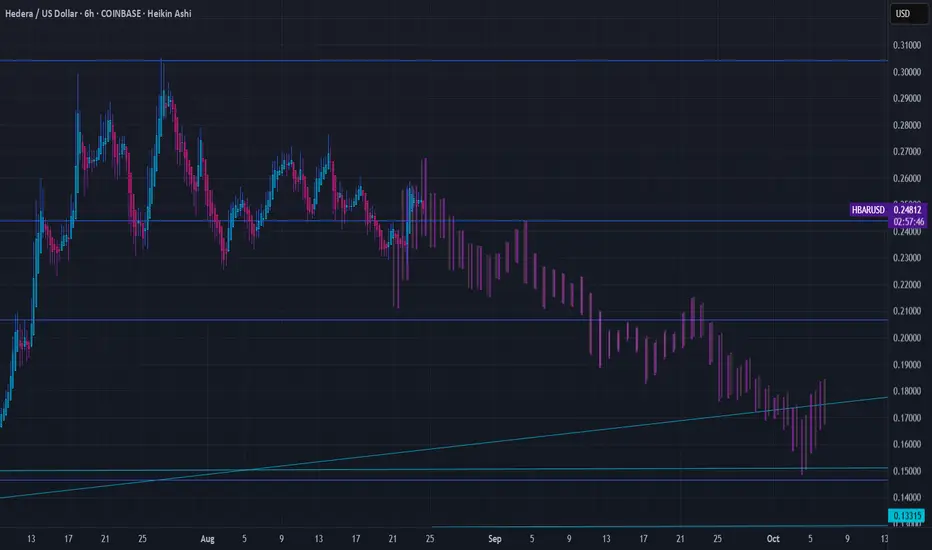
▒H▒ HEDERA FORECAST | 6HR ▒H▒
CRYPTOCAP:HBAR
Someone was screaming about HBAR in the Cryptocurrency chat so I took a look. I am not trading this nor other ALTS. I may with a tiny amount of money here and there. I fundamentally and strongly believe in BTC and BTC only as the King. With that being said I do realize there is
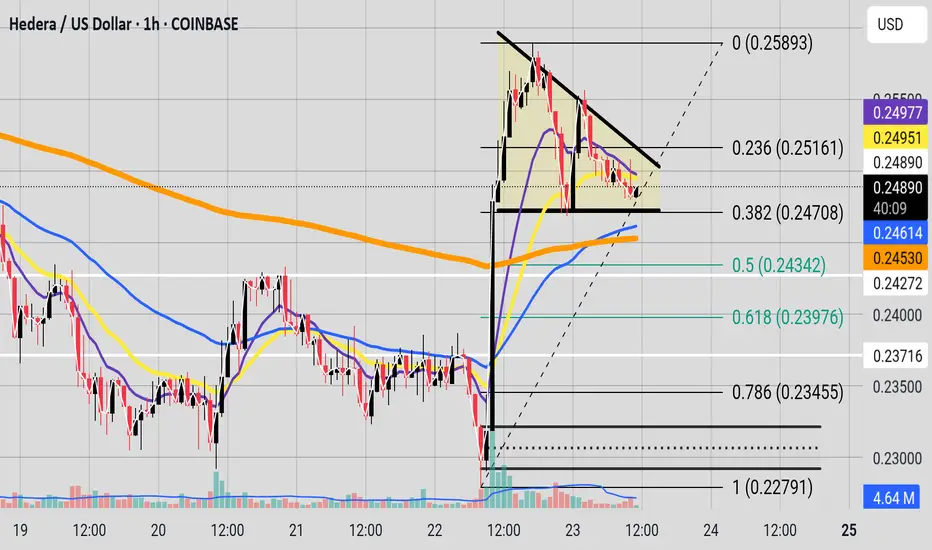
Descending TriangleDescending triangle forming on the hourly.
Price pull back to the 0.382 Fibonacci Zone; and then started to make a descending triangle.
We have a EMA stack, and recently the 50 EMA crossed over the 200 EMA. Let us keep an eye on the descending triangle, and watch out for the direction of the Breako
See all ideas
Summarizing what the indicators are suggesting.
Oscillators
Neutral
SellBuy
Strong sellStrong buy
Strong sellSellNeutralBuyStrong buy
Oscillators
Neutral
SellBuy
Strong sellStrong buy
Strong sellSellNeutralBuyStrong buy
Summary
Neutral
SellBuy
Strong sellStrong buy
Strong sellSellNeutralBuyStrong buy
Summary
Neutral
SellBuy
Strong sellStrong buy
Strong sellSellNeutralBuyStrong buy
Summary
Neutral
SellBuy
Strong sellStrong buy
Strong sellSellNeutralBuyStrong buy
Moving Averages
Neutral
SellBuy
Strong sellStrong buy
Strong sellSellNeutralBuyStrong buy
Moving Averages
Neutral
SellBuy
Strong sellStrong buy
Strong sellSellNeutralBuyStrong buy
Displays a symbol's price movements over previous years to identify recurring trends.
Curated watchlists where HBARUSD is featured.

Eco-friendly crypto tokens: Green cryptocurrencies
14 No. of Symbols

Top altcoins: Choose your alternatives carefully
28 No. of Symbols
See all sparks
Frequently Asked Questions
The current price of Hedera Hashgraph (HBAR) is 0.22498568 USD — it has risen 0.84% in the past 24 hours. Try placing this info into the context by checking out what coins are also gaining and losing at the moment and seeing HBAR price chart.
The current market capitalization of Hedera Hashgraph (HBAR) is 9.54 B USD. To see this number in a context check out our list of crypto coins ranked by their market caps or see crypto market cap charts.
Hedera Hashgraph (HBAR) trading volume in 24 hours is 166.10 M USD. See how often other coins are traded in this list.
Hedera Hashgraph price has risen by 0.96% over the last week, its month performance shows a −15.88% decrease, and as for the last year, Hedera Hashgraph has increased by 350.45%. See more dynamics on HBAR price chart.
Keep track of coins' changes with our Crypto Coins Heatmap.
Keep track of coins' changes with our Crypto Coins Heatmap.
Hedera Hashgraph (HBAR) reached its highest price on Sep 16, 2021 — it amounted to 0.58391228 USD. Find more insights on the HBAR price chart.
See the list of crypto gainers and choose what best fits your strategy.
See the list of crypto gainers and choose what best fits your strategy.
Hedera Hashgraph (HBAR) reached the lowest price of 0.00932203 USD on Jan 14, 2020. View more Hedera Hashgraph dynamics on the price chart.
See the list of crypto losers to find unexpected opportunities.
See the list of crypto losers to find unexpected opportunities.
The current circulating supply of Hedera Hashgraph (HBAR) is 50.00 B USD. To get a wider picture you can check out our list of coins with the highest circulating supply, as well as the ones with the lowest number of tokens in circulation.
Hedera Hashgraph has the limit of 50.00 B coins. No matter how the currency evolves, no new coins will be released after this number is reached.
The safest choice when buying HBAR is to go to a well-known crypto exchange. Some of the popular names are Binance, Coinbase, Kraken. But you'll have to find a reliable broker and create an account first. You can trade HBAR right from TradingView charts — just choose a broker and connect to your account.
Crypto markets are famous for their volatility, so one should study all the available stats before adding crypto assets to their portfolio. Very often it's technical analysis that comes in handy. We prepared technical ratings for Hedera Hashgraph (HBAR): today its technical analysis shows the neutral signal, and according to the 1 week rating HBAR shows the buy signal. And you'd better dig deeper and study 1 month rating too — it's strong buy. Find inspiration in Hedera Hashgraph trading ideas and keep track of what's moving crypto markets with our crypto news feed.
Hedera Hashgraph (HBAR) is just as reliable as any other crypto asset — this corner of the world market is highly volatile. Today, for instance, Hedera Hashgraph is estimated as 2.30% volatile. The only thing it means is that you must prepare and examine all available information before making a decision. And if you're not sure about Hedera Hashgraph, you can find more inspiration in our curated watchlists.
You can discuss Hedera Hashgraph (HBAR) with other users in our public chats, Minds or in the comments to Ideas.