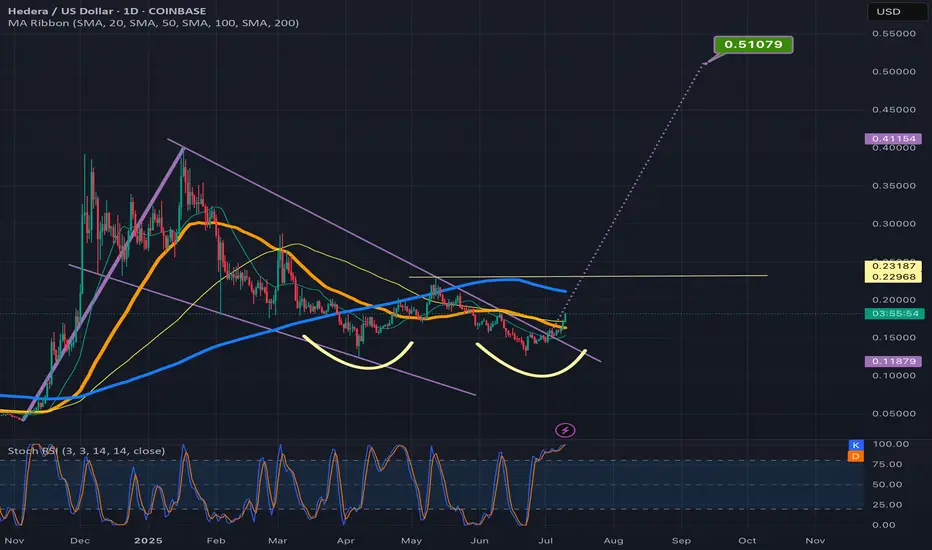
Hbar going good???On bigger timeframe it touched the 0.5 fib 2 times. On smaller timeframe im hoping to see a Reversal pattern and jump in when the price is 0.1545. Then trade 5 waves up. Correct and go for that bigger trade of a 2000% . Well dont jump in like yolo, just find the pattern first. And use a stoploss man
Key stats
Related pairs
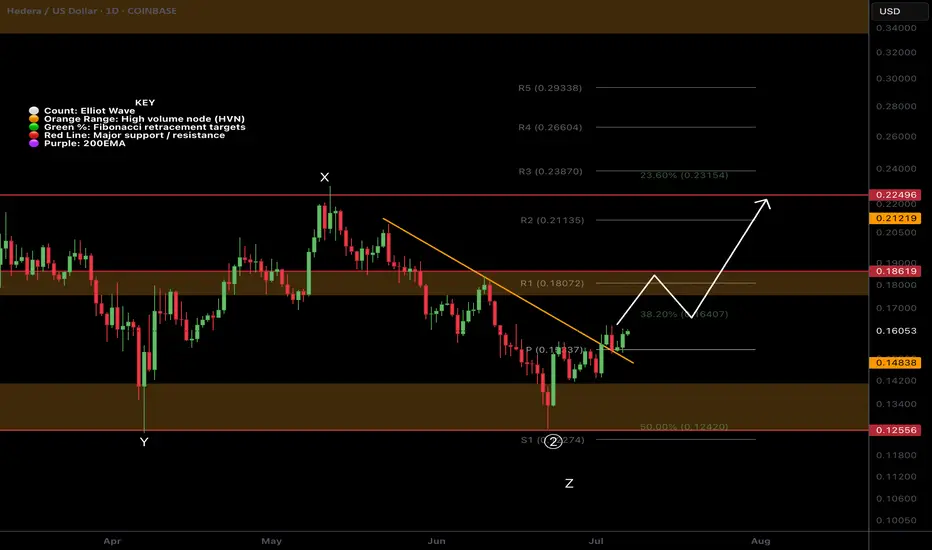
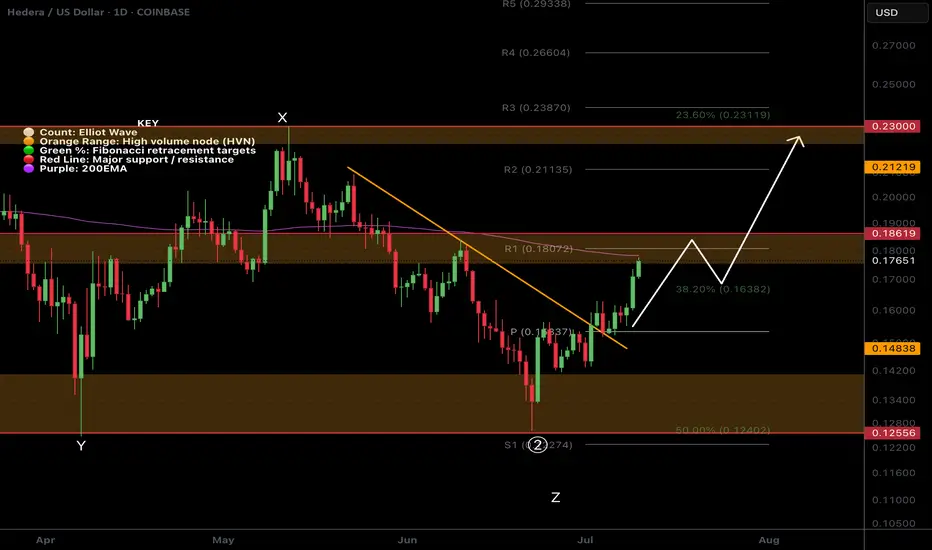
$HBAR Ready for a move up?CRYPTOCAP:HBAR appears to have completed its wave 2 WXYXZ complex correction
It has broken its descending resistance & daily pivot, retested both as support and is approaching the local swing high which would be a bullish long signal.
Cautious traders may want to take partial take profit at the f
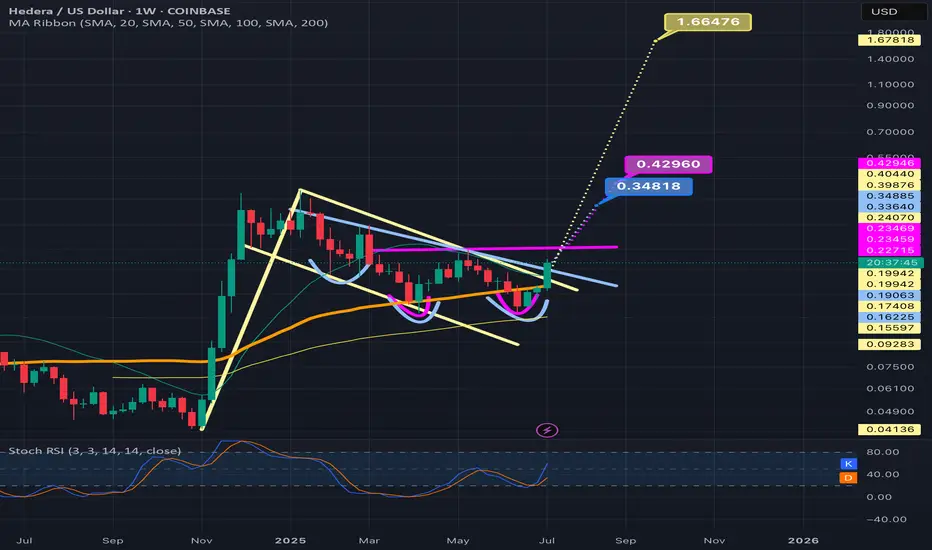
Weekly timeframe version of previous HBARUSD postWanted to show my previous hbar idea which was on the daily time frame on the weekly as well so I could fit the pole of the bullflag in the frame here. I will put a link below to my daily time frame version of this post which goes into slight more detail about each pattern and also the Nvidia hbar n
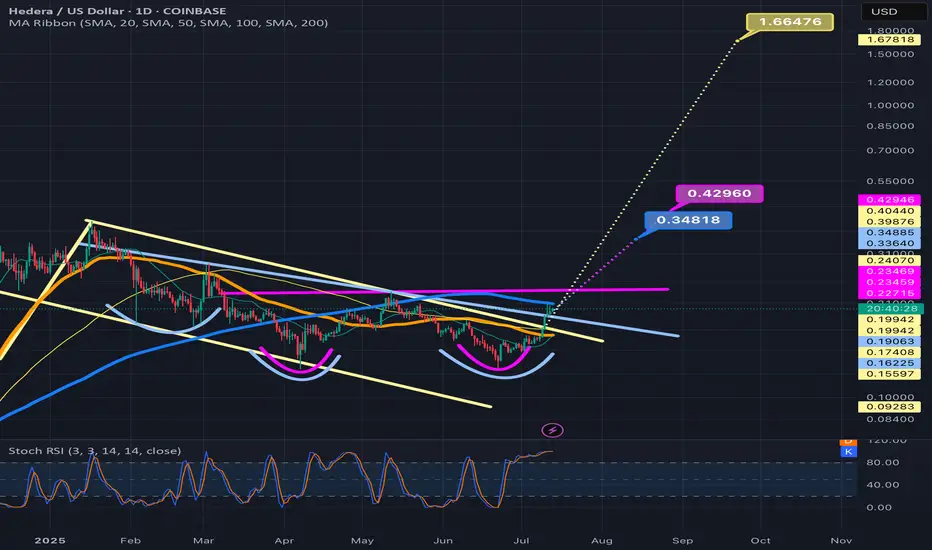
HBAR Descending Triangle, Double bottom, Volume SqueezeHedera Hashgraph is displaying a Descending Triangle, Double bottom, with Volume Squeeze. What more can you ask for?
HBARUSD has 3 bullish patterns stacked on top of eachotherThe inverse head and shoulders in the light blue, the light tan is the bull flag, and the pink is the double bottom. Currently price is above the Bullflag and the Inverse head and shoulders pattern. The bullflag also counts as a descending channel pattern as well. We just recently retested the neckl
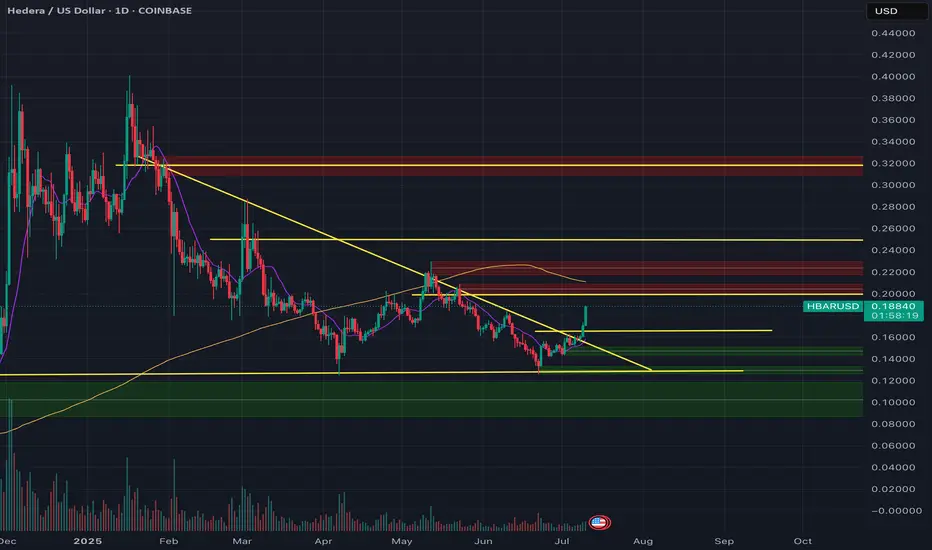
$HBAR Resistance at daily 200EMA!CRYPTOCAP:HBAR analysis continues to play out but should consolidate for a while before moving to the next target at $0.22.
This area should be tough resistance as its the daily 200EMA and major High Volume Node resistance and R1 daily pivot.
The CRYPTOCAP:HBAR signal has now hit take profit #1
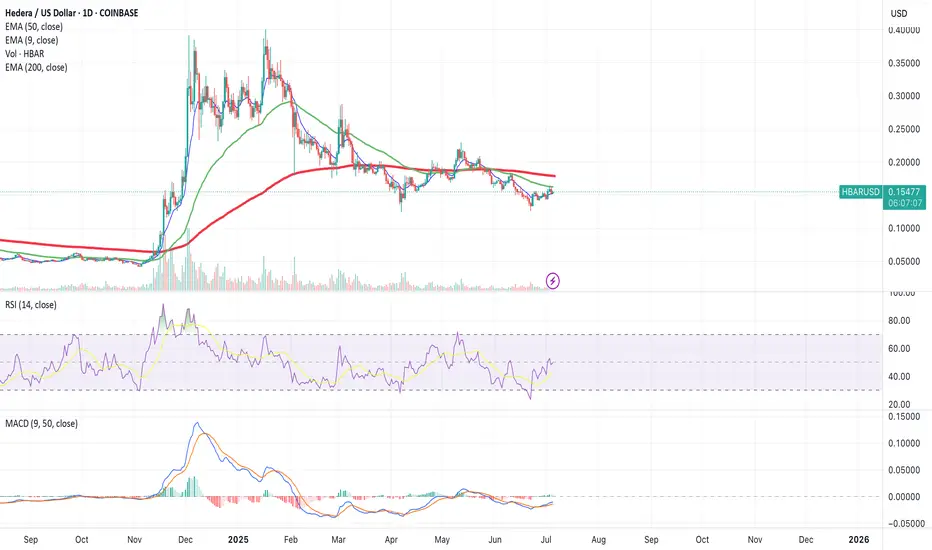
HBAR ChartHi there,
Any insights on the chart please. I believe that because its still below 50 MA, should wait on an entry.
Hbar breaking upwar from fallingwedge/pennantAlso in a smaller double bottom setup here. *not financial advice*
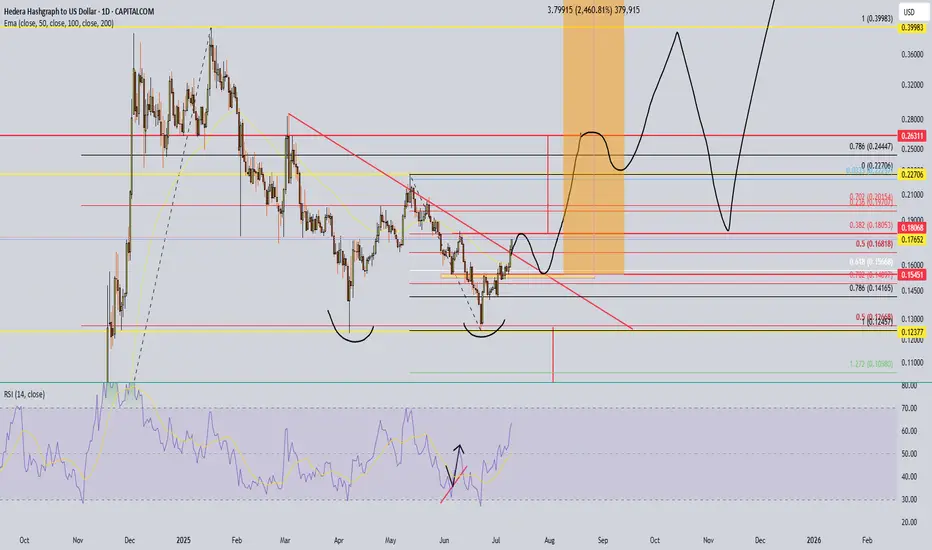
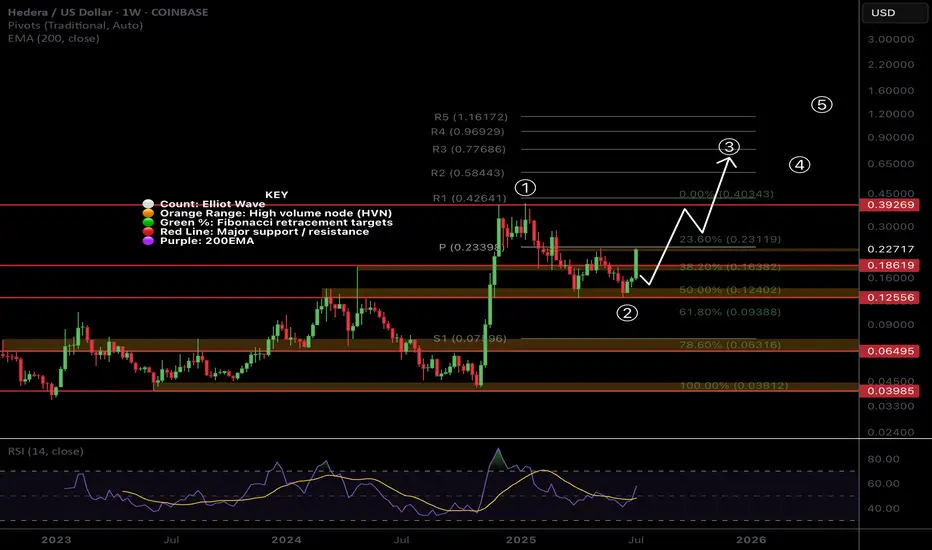
$HBAR Shooting Up in Wave 3CRYPTOCAP:HBAR is flying off the High Volume Node and 0.5 Fibonacci retracement with Elliot wave 3 characteristics keeping the count alive.
Price is testing the weekly pivot point which should act as resistance for the time being but a break straight through will demonstrate a very bullish trend.
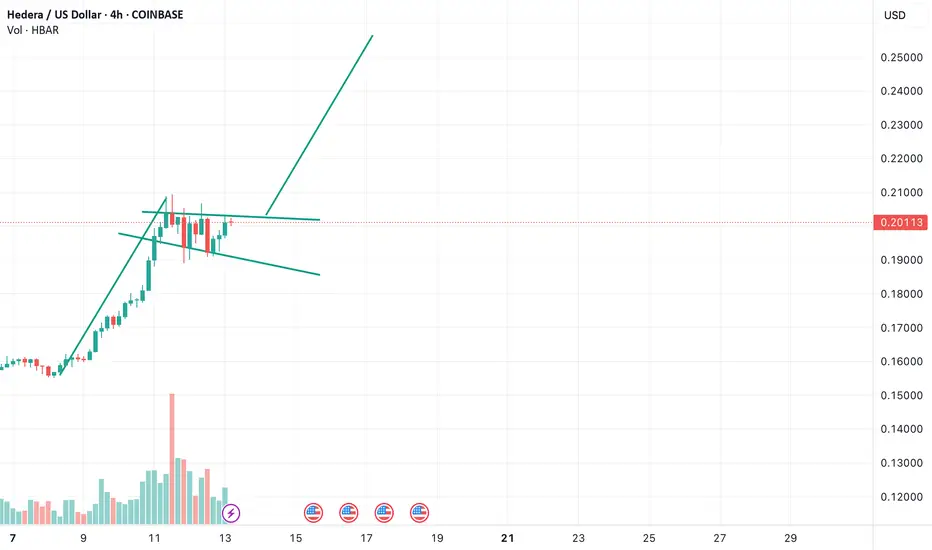
HBAR Flagging- Breakout Soon?Clean bullish flag forming after a strong impulse move. Volume’s cooling off during consolidation, textbook setup.
Break above ~$0.205 could trigger the next leg, with a measured target around $0.26–$0.28 if the flag plays out.
See all ideas
Displays a symbol's price movements over previous years to identify recurring trends.
Curated watchlists where HBARUSD is featured.

Eco-friendly crypto tokens: Green cryptocurrencies
14 No. of Symbols

Top altcoins: Choose your alternatives carefully
28 No. of Symbols
See all sparks
Frequently Asked Questions
Hedera Hashgraph to US Dollar (HBAR) reached its highest price on Sep 16, 2021 — it amounted to 0.57238 USD. Find more insights on the HBAR price chart.
See the list of crypto gainers and choose what best fits your strategy.
See the list of crypto gainers and choose what best fits your strategy.
Hedera Hashgraph to US Dollar (HBAR) reached the lowest price of 0.03521 USD on Dec 31, 2022. View more Hedera Hashgraph to US Dollar dynamics on the price chart.
See the list of crypto losers to find unexpected opportunities.
See the list of crypto losers to find unexpected opportunities.
The safest choice when buying HBAR is to go to a well-known crypto exchange. Some of the popular names are Binance, Coinbase, Kraken. But you'll have to find a reliable broker and create an account first. You can trade HBAR right from TradingView charts — just choose a broker and connect to your account.
You can discuss Hedera Hashgraph to US Dollar (HBAR) with other users in our public chats, Minds or in the comments to Ideas.