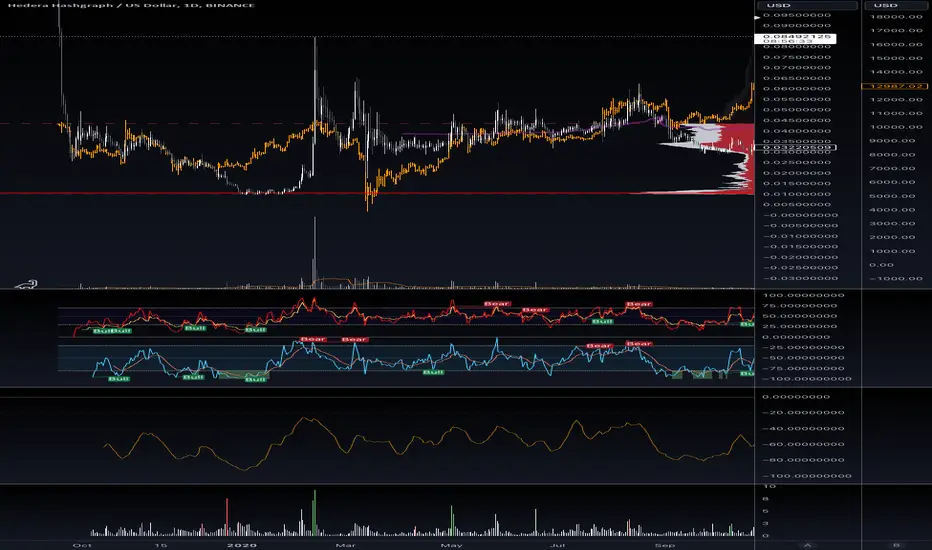
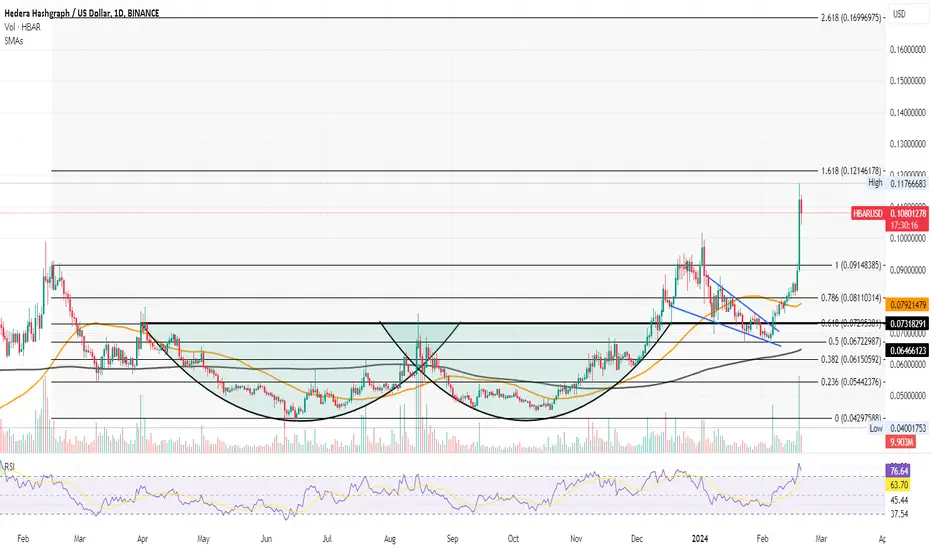
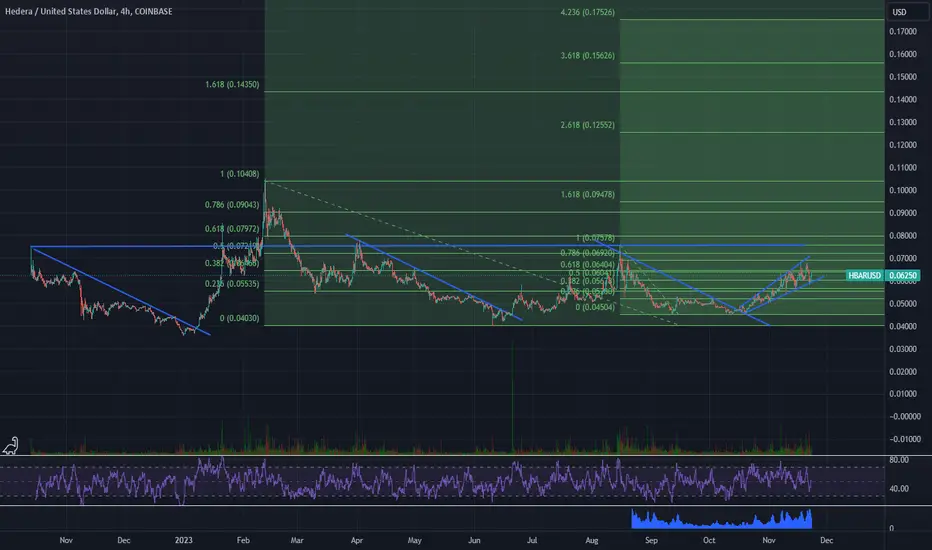
HBAR Weekly/Daily Falling Wedge BreakoutsHBAR is breaking out of the daily bar chart's falling wedge after having already broken out of a weekly line chart's falling wedge, both here on the weekly candle chart.
Initial targets are near top and bottom of weekly resistance. A move down could re-test wedge top, and this weekly candle needs to close above the wedge (already has daily closes but want to see a weekly close above).
See my related idea here, where I think we need to get and hold above 10-12 cents prior to going for weekly resistance:
HBARUSD trade ideas

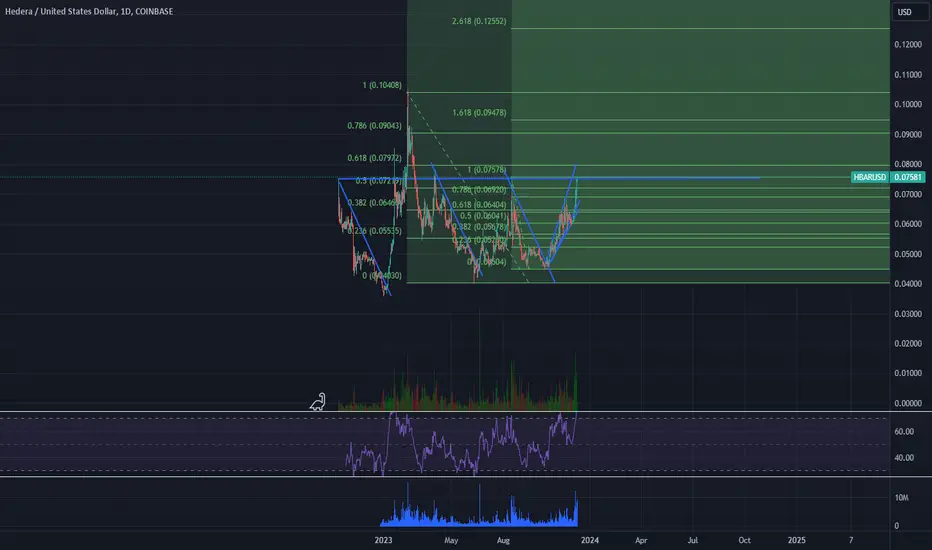
HBAR to Repeat its Prior Move?This is a simple theory that COINBASE:HBARUSD can be divided into two parallel uptrends on the weekly:
one that acts as support
another that acts as resistance
When it first broke out of parallel support, it made a 2.5x measured move up, and then dropped back down near the 1.5x measurement, forming what would become parallel resistance after making a higher set of highs, dropping back down to 1.5x, and then losing it to fall back into parallel support.
After falling into parallel support, it tested the top of it and failed to move above, causing it to drop down to the bottom. When it did this it moved below support's bottom, but when it failed to remain below, it saw a strong and fast move back to the top of parallel support for another attempt to move above. This also failed, leading to a move back down towards the bottom.
Now that it has made 3 attempts at bottom, each attempt weaker than the previous, it should be ready for a 3rd attempt at the top of parallel support.
I expect it will break above it, as it has already failed to break below.
TP 1 and 2 are likely targets if it does this, but we could also see a repeat of its prior move sending COINBASE:HBARUSD back into and towards the top of its parallel resistance.
An example of how they are similar:

Crucial line for HBAR to HOLD!It has passed over this threshold before and has also been rejected, this time based on the current market I am bullish!
HBAR at 1.579 by H2 2024?Just being creative about what could form out of this current price action.

HBAR Long Term StrategyMarket Cap
$2,489,663,131
9.22%
Fully Diluted Market Cap
$15,067,834,183
9.22%
Volume
24h
$657,357,987
63.52%
Volume / Market Cap
0.2634
Circulating Supply
8.26B HBAR
17%
Max Supply
50,000,000,000
Total Supply
50,000,000,000
www.hedera.com
Hedera long term strategy to go with the hype around this coin. I'm not one for fundamentals, as I feel all coins are basically the same. This is purely a high-risk, low capital long term strategy. Much like my TRX play. But I do favor this one more. Anticipating 3 areas of DCA on this.
Technicals: Weekly time frame, Binance. Original fork still an option but favoring modifier for now due to passage of time and symmetry. Currently resistance in upper parallel. However, the longer this goes sideways and remains above 21 Week MA I will be more bullish to the upside. I have marked my areas of potential zones I would prefer to see bounces and levels which I will add to bag. Anticipation of this is 2-4 years so patience is key. Will update upon further market information.
Short term: Anticipating profit taking and return to median line. Also would like to see more passage of time (~eoy 2021). However, any moves back above 40 cents will lead me to believe in more immediate upside.

HBAR to 0.16885Hbar looking bullish on daily, according to trend based FIB extension if 0.09 breaks next target should be 0.1688

Potential Trade Setup for 8% percent gain on HBARLooks like the overall trend for me is clear. Up in some way. I am looking for a structure like this to form and to enter at confirmation points exiting at top level.

HBAR chart looks interestingNon financial advice
We are generating a triangle with the ATH trendline + the current rejection zone. If we beat that trend line in the next few days. If we break above that level, I think we could have some corrections between 0.16 , 0.30 and 0.45.
If ATH is breached, perhaps a new ATH at 0.90 will be reached. In any case, anything around 0.80 will be a good exit point.
I think we can see some candles moving around .70-.90
HBAR is bullishSeems like HBAR is somewhat following XRP path in 2017. In the near term (1-2 months) can visit .77-.8
Long term (1year) can go up pretty high to 2 digits.

HBAR Eyes $0.1699 Amidst Trend Reversal25% Price Jump: HBAR price exhibits a significant increase, breaking past the $0.10 barrier, showcasing strong bullish momentum.
Challenges $0.12 Level: The token's price movement is aligning with the 1.618 Fibonacci level, indicating a potential challenge to the $0.12 resistance level.
Potential for a 50% Upside: With the current bullish breakout, the HBAR price trajectory could reach up to $0.1699, highlighting substantial upside potential.
Impact of DeepTech Venture Studio Announcement: Following Hedera's announcement in Saudi Arabia, HBAR experiences a new wave of bullish momentum, indicating positive market sentiment.
SaucerSwap TVL Growth: The rising Total Value Locked (TVL) in SaucerSwap contributes to the bullish outlook for HBAR, reinforcing its market position.
Surge in Market Activity: A 50% increase in the last two weeks, combined with breakout events and rising trading volumes, underpins the strong performance of HBAR.
Falling Wedge Breakout: A clear trend reversal was signaled with a falling wedge breakout on February 6, emphasizing a bullish trend for HBAR.
Current Trading Price: HBAR is currently trading at $0.107, with a temporary pullback reflecting a consolidation phase after the recent surge.
RSI Indicator Analysis: The RSI indicator entering the overbought zone suggests a very bullish market sentiment, although a minor dip indicates potential short-term consolidation.
Price Target of $1: The market buzz around HBAR reaching $1 is growing, supported by recent developments and market recovery, with immediate resistance observed at $0.12 and $0.1699.
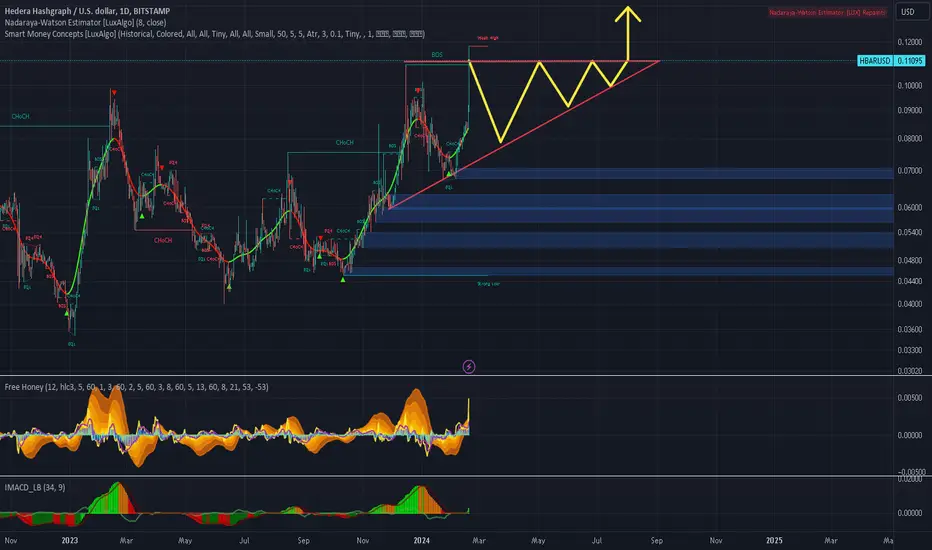
Hbar breaking above 2 different inv h&s patterns. We can see a pink neckline and an off white neckline here that price has broken above. This should take hbar to a measured move breakout target of around 11-12 cents. *not financial advice*
HBAR possibly forming ascending triangle on 1DIt looks like price could be shaping into an ascending triangle should the current push not close above the pattern.

HBAR 1 more dip to.06 and will RIPPHBAR will do what Dogecoin did in 2021 after it retest monthly FVG at 6 Cents.
$HBAR Looks like it will make a nice runAfter recovering from its trends in the past, it always seems to make a nice climb. I would love to see a 30% day.
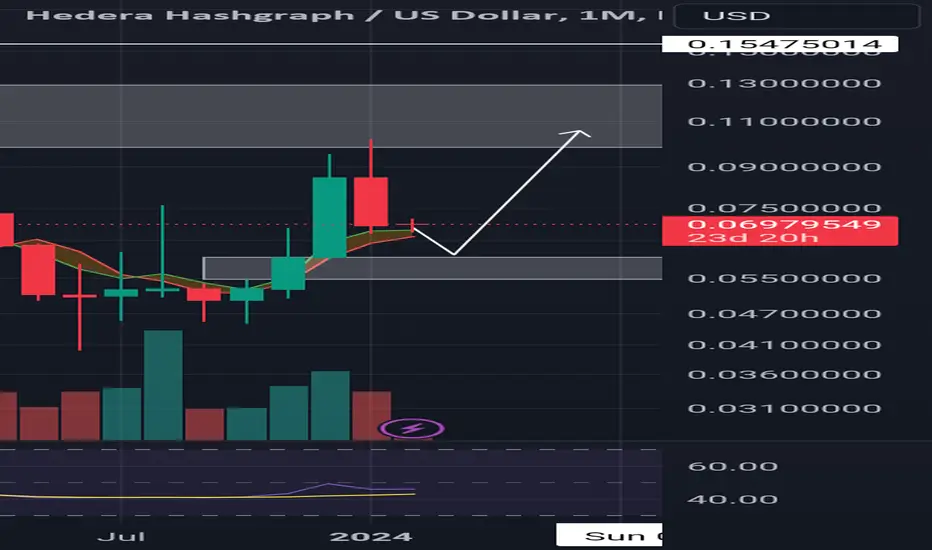
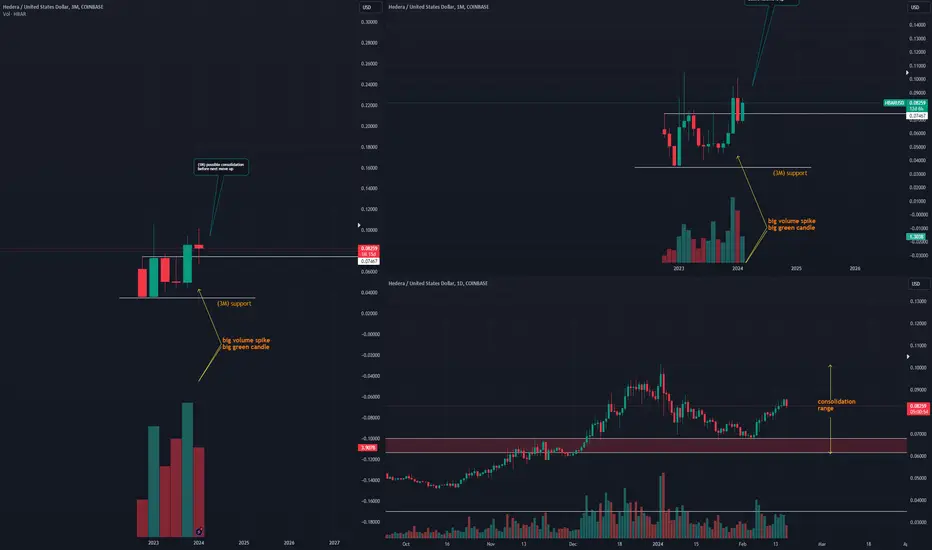
BULLISH IDEA HBAR to 0.105003M chart tells an interesting story:
zooming out, we see a big green candle validated by a big green volume bar, breaking trading range (taking open/close prices only). With 1.5M left in current 3M cycle, I think we'll see a push towards 0.10500 by end of current 3M cycle or in the next.
1M/1D
looking at the 1M chart, the last 3 candles show a spike in price, followed by some consolidation seen by the last two candlesticks. Price is ranging. and probably will continue to do so.
Zooming in, we are able to beter identify the range in which HBAR would need to break (hopefully upside lol): 0.6827 - 0.10178. Pretty big range, but it is what it is and it aint what it aint.
Personally will continue to DCA so long as we dont break downside in the range.
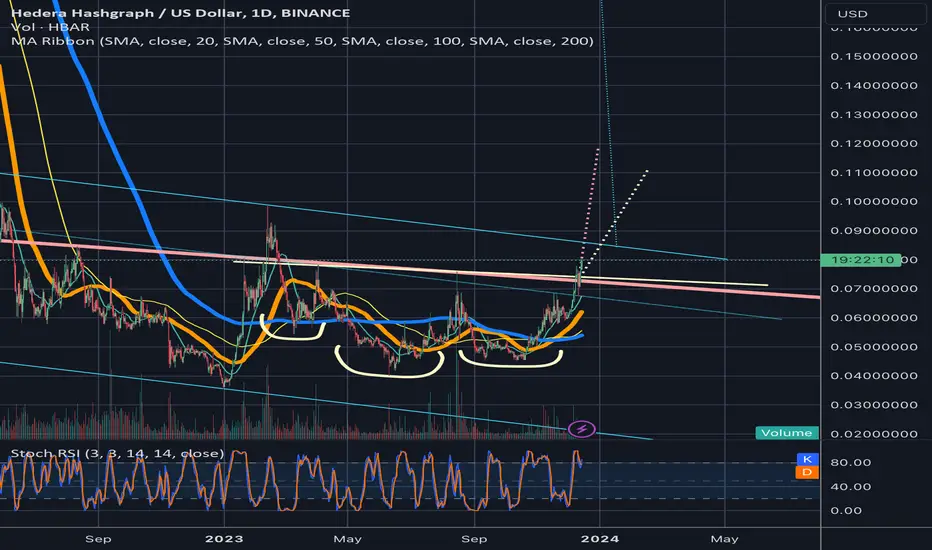
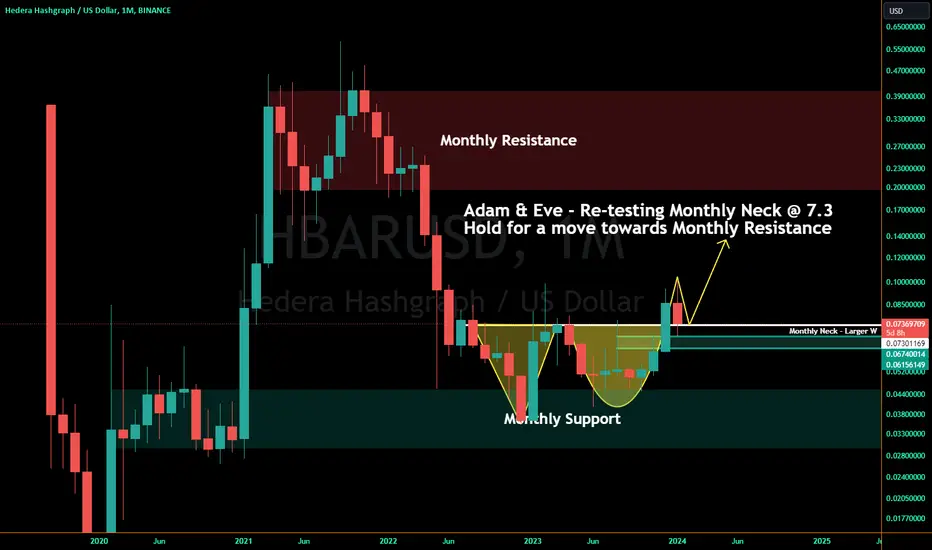
Monthly Adam & Eve Breakout Being Re-testedMonthly close is in a little over 5 days. CRYPTO:HBARUSD formed an Adam and Eve double-bottom on the monthly right at center and top of Monthly Support before breaking out to confirm that pattern and is now re-testing it for final confirmation or denial.
Hold the monthly neckline at 7.3 cents and we can expect a move up towards Monthly Resistance as we get into February and March.
Lose it and we likely will see another test of monthly support instead, which is around a falling wedge top, or this re-test area and/or the 200 day EMA and MA that I have marked and displayed on my weekly chart below.
Note that HBAR also saw a 50/200 day EMA and MA Golden Cross during the last few months of 2023, and is presently sitting back below the 50 EMA and MA. However, it has held above the 200 EMA and MA. So, we also need to see it recover the 50 EMA and MA if and after we see a close above the monthly neckline as well or these areas could be tested again.
Weekly chart showing Golden Crosses and Falling Wedge break / re-test(s) - also shown in related published ideas below, but updated chart pic here:
TL / DR - hold the Adam/Eve double-bottom's monthly neck @ 7.3 cents to continue up, lose it to re-test 200 day EMA/MA and/or the falling wedge re-test area marked on the weekly chart above.
Hedera's Leap Toward $0.10: Fueled by Saudi's DeepTech VentureBullish Momentum: HBAR's recent surge of 7.79% marks a bullish endeavor to breach the 50-day EMA, showcasing potential for further gains.
Retest Phase: Post-surge, the demand wanes, pushing HBAR into a retest phase of the recent wedge breakout, suggesting a consolidation before another leap.
Sustaining Gains: If HBAR can maintain its position above the 50-day EMA, projections see it climbing to the $0.091 threshold, edging closer to the coveted $0.10 mark.
Correction Concerns: Despite a spirited rally to $0.10, HBAR faces challenges in establishing a robust support level, with the 200D EMA becoming a focal point for a potential bullish reversal.
Supply Pressure: The immediate resistance posed by the declining 50D EMA tempers the bullish sentiment, indicating a tug-of-war between buyers and sellers.
Saudi’s Backing: The announcement of Hedera's DeepTech Venture Studio in Saudi Arabia, part of a significant $250 million initiative, injects optimism and potential for HBAR's upward trajectory.
Pattern Breakout: HBAR's price movement within a falling wedge pattern hints at a bullish breakout, underpinned by a 30% decline that sets the stage for a rebound.
Volume Dynamics: A spike in trading volume supports the breakout, although the subsequent retest phase sees a decrease, highlighting the market's hesitancy.
RSI Indicator: The RSI's bullish spike falls short of crossing the midway point, yet the rebound from oversold conditions signals growing demand.
Market Watch: Traders are closely monitoring the 50D EMA breakout as a pivotal entry point, with the $0.10 target within sight, contingent on sustaining the bullish momentum

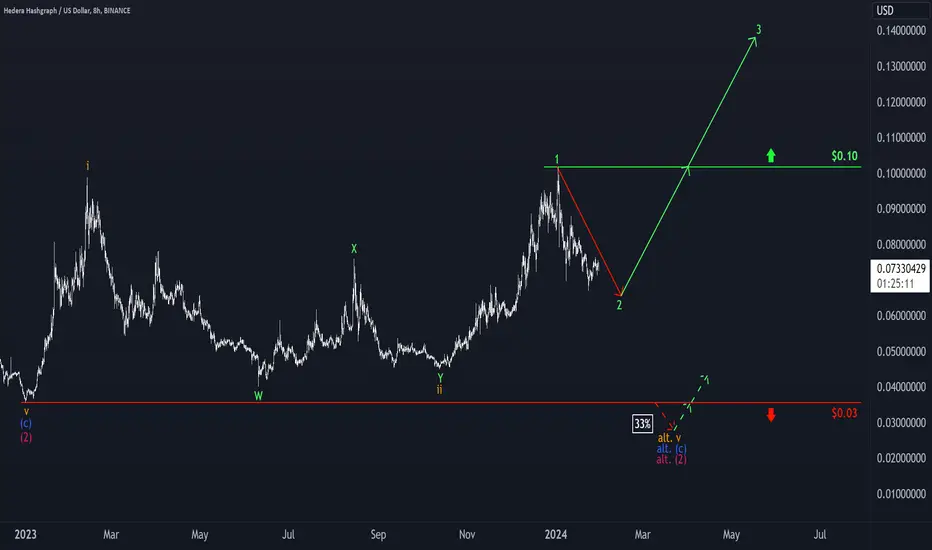
Hedera: Almost done 😮💨Hedera continued to fall in the last week before a bullish counter-reaction occurred. According to our primary expectation, the price still has some room to the downside, but it should not be far to the low of the green wave 2. Once the low is established, a turnaround and a rise above the resistance at $0.10 is on the cards. Only the 33% probable alternative would entail further imminent declines. It would push the low of the magenta-coloured wave alt. (2) below the support at $0.03.
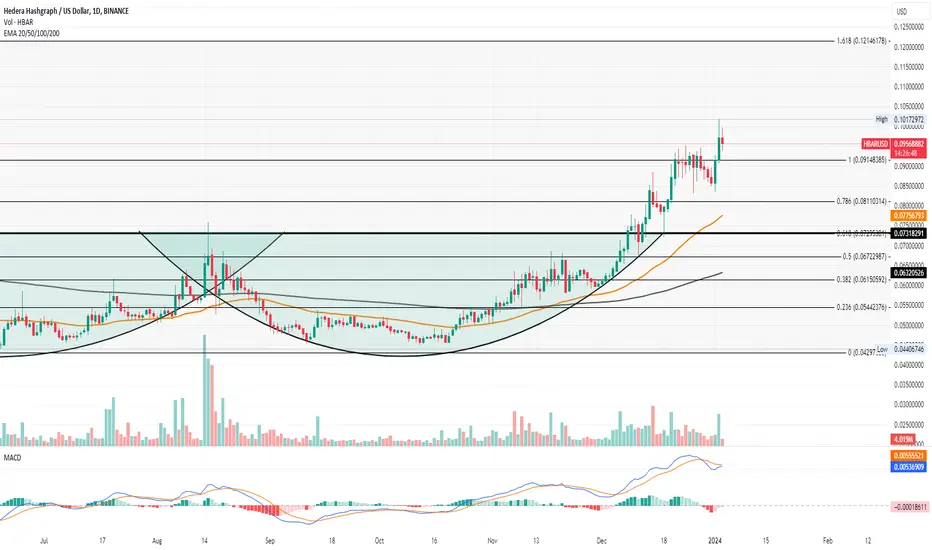
HBAR Price Aiming for $0.10 BreakoutCurrent Momentum: HBAR is experiencing a breakout rally, aiming to hit $0.12.
Psychological Barrier: The focus is on the crucial $0.10 mark, a significant psychological level for HBAR.
Pattern in Play: The rally follows a double bottom breakout in the daily chart, indicating bullish potential.
Weekly Kickoff: The week starts with a 10.86% jump for HBAR, currently trading around $0.0951.
Intraday Observations: A recent 2.07% drop forms a shooting star candle, hinting at resistance near $0.10.
Market Support: Bitcoin’s movement to $45K and a rise in trading volume underpin HBAR’s bullish scenario.
Entry Signal for Traders: A decisive break above $0.10 could be a key entry signal for those on the sidelines.
Technical Indicators:
MACD: Recent crossovers show indecision, but the current positive alignment suggests bullish momentum.
Next Milestones: Breaking $0.10 could lead to a further rally, potentially towards $0.12.
Risk Assessment: Despite bullish signs, failure to maintain momentum could see a pullback to around $0.060.
Overall Outlook: HBAR’s price trajectory is promising, with a strong focus on sustaining the rally above $0.10 for continued bullish momentum.
HBAR - This Quick Idea Could Yield A 100% Gain...Just scanning though the top 50 cryptos and looking for trading ideas.
This one here stuck out as a good timely opportunity..
Entry: At Market.
Stop: 0.07
Target: 0.19
Use your judgement, this is just an idea based on AriasWave.
A methodology I created to replace Elliott Wave because it simply does a better job.

$HBAR #HBAR Lags until $BTC #BTC #Bitcoin topsThis is what I am expecting. Bitcoin moves to pre-halving top at FWB:48K to $50k which is a major point of control and the bear market .618... HBAR will do the same but in a single week or few days time. That puts the prices around .25 to .30 a 3x from here at .09