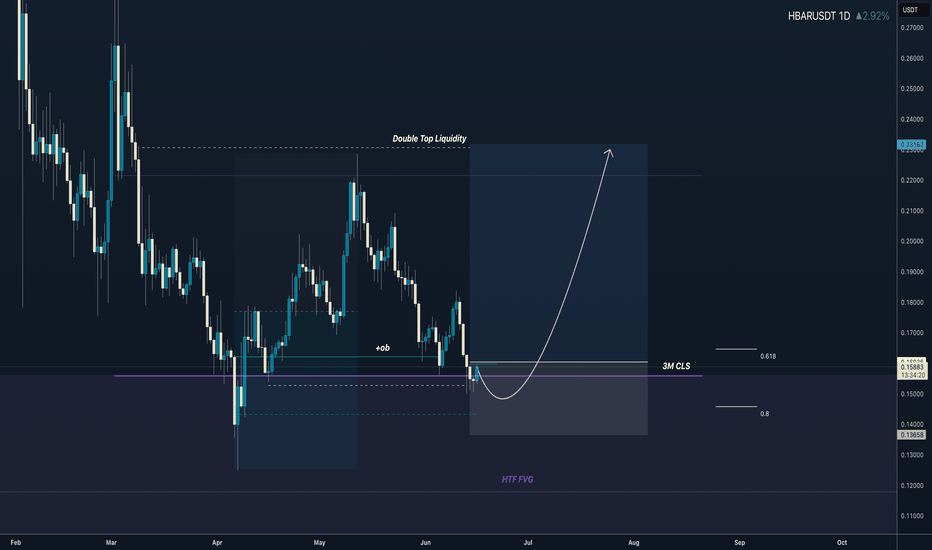
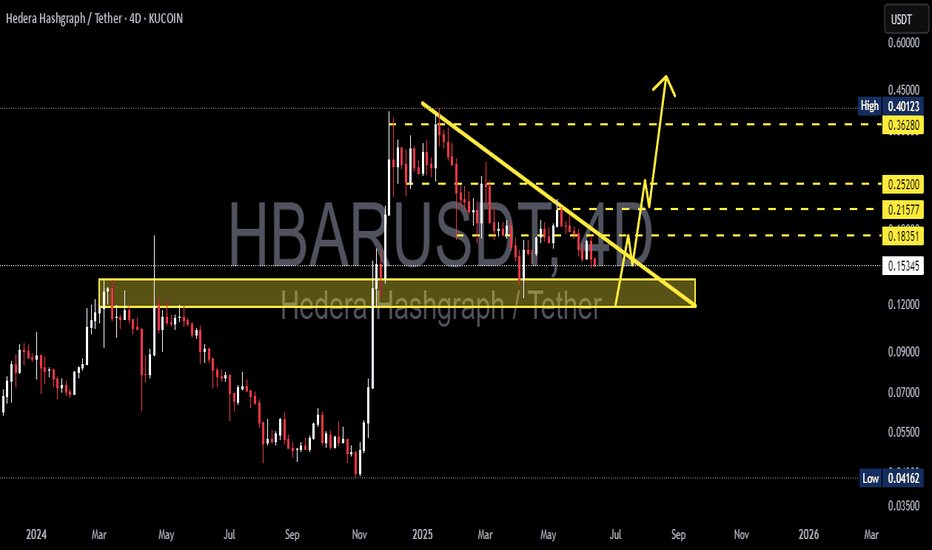
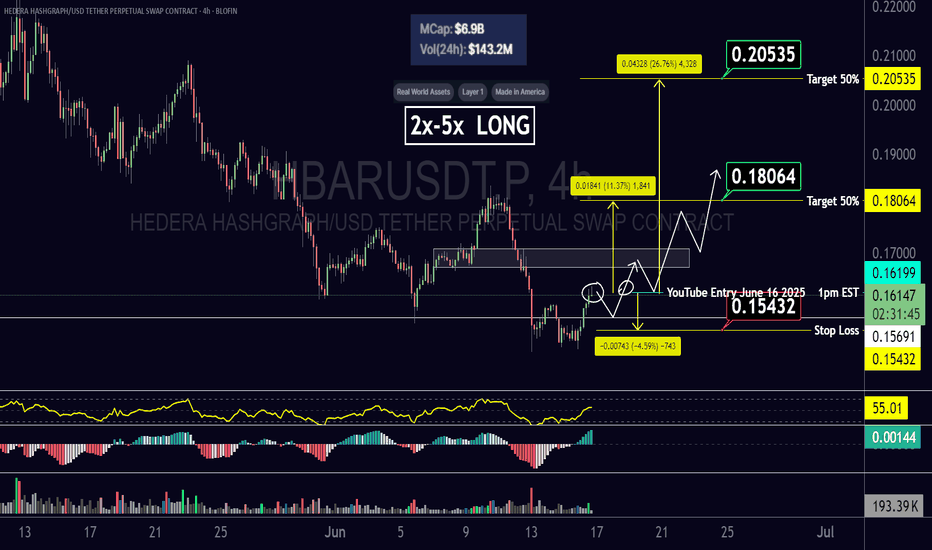
3M CLS I KL - FVG I Model 2 I Target 50% CLSHey, Market Warriors, here is another outlook on this instrument
If you’ve been following me, you already know every setup you see is built around a CLS Footprint, a Key Level, Liquidity and a specific execution model.
If you haven't followed me yet, start now.
My trading system is completely
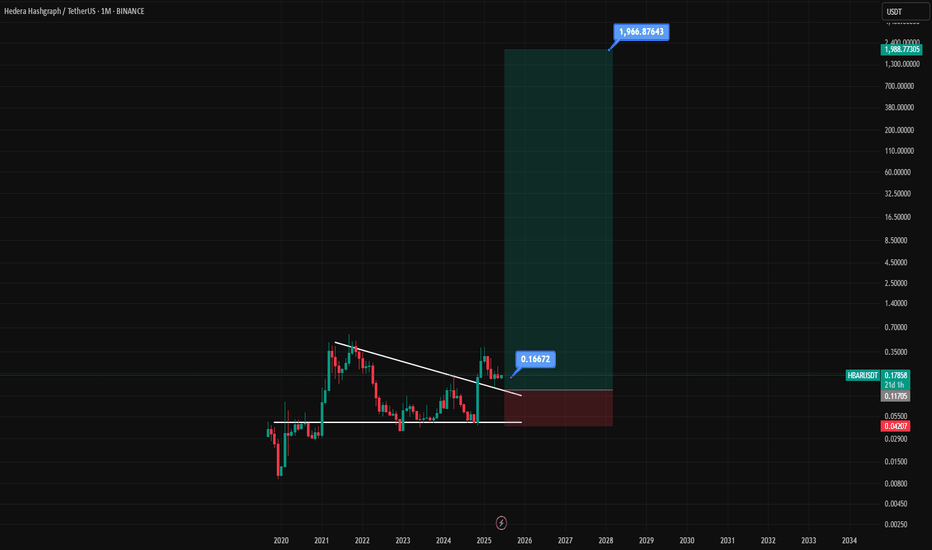
A Colossal Rally Scenario for HBAR to $1,966HBAR is the utility and security token of the Hedera network, a high-performance distributed ledger that aims to be a faster, fairer, and more secure alternative to traditional blockchains, specifically designed to meet the needs of mainstream and enterprise-level applications.
Chart Pattern Analys
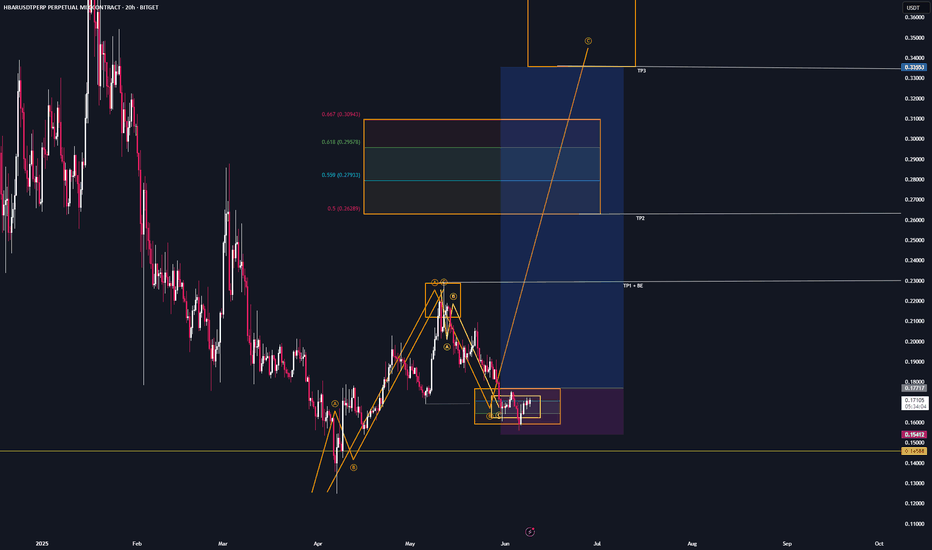
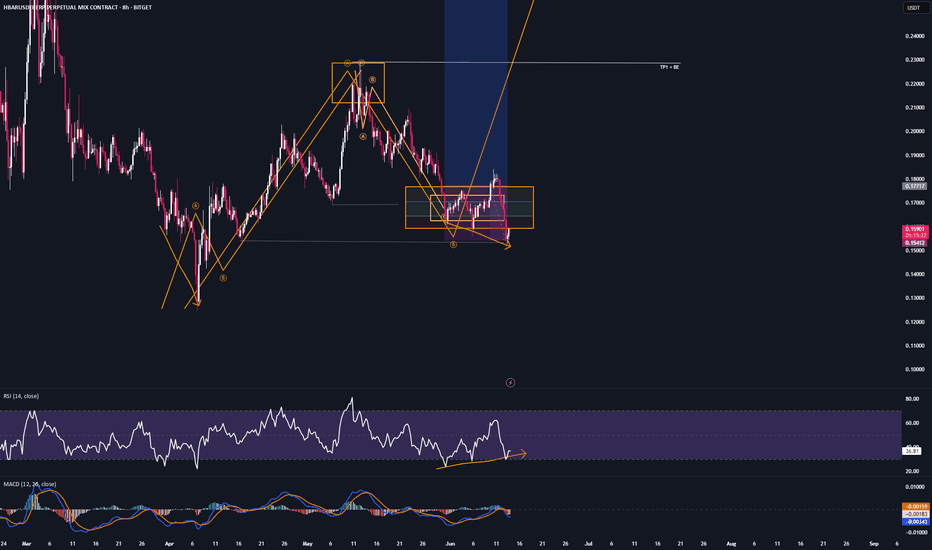
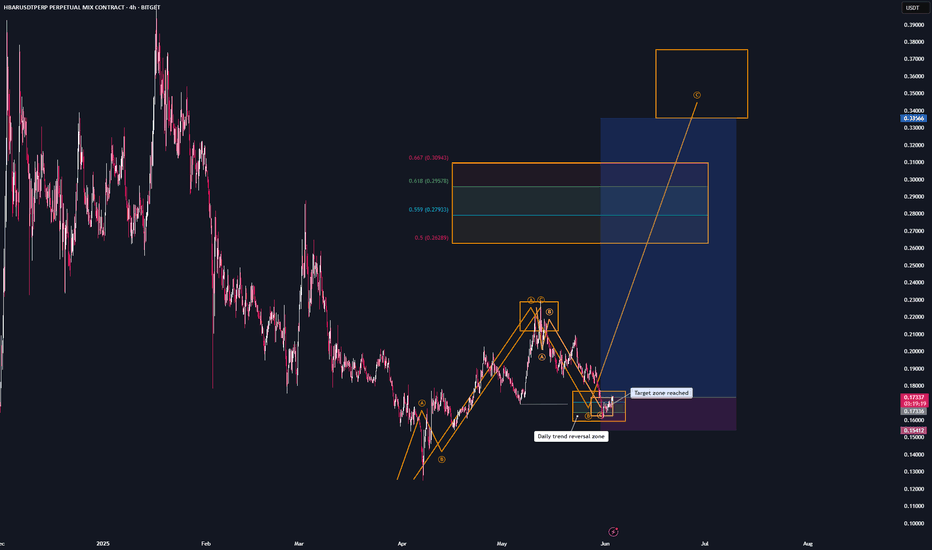
HBAR - setupWe’re still within the bullish trend reversal zone and the bearish target area.
If you’re not positioned long yet, this CRYPTOCAP:HBAR setup is worth considering.
I’m long on this one.
Tp1 + BE : at $0.22 — recent highs
Tp2: at $0.26 — trend reversal area
Tp3: at $0.333— target region
If you
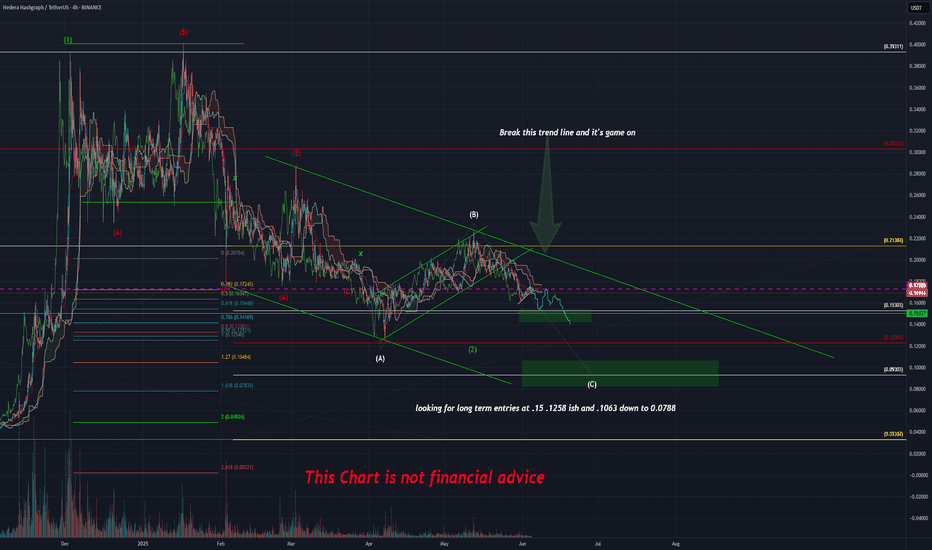
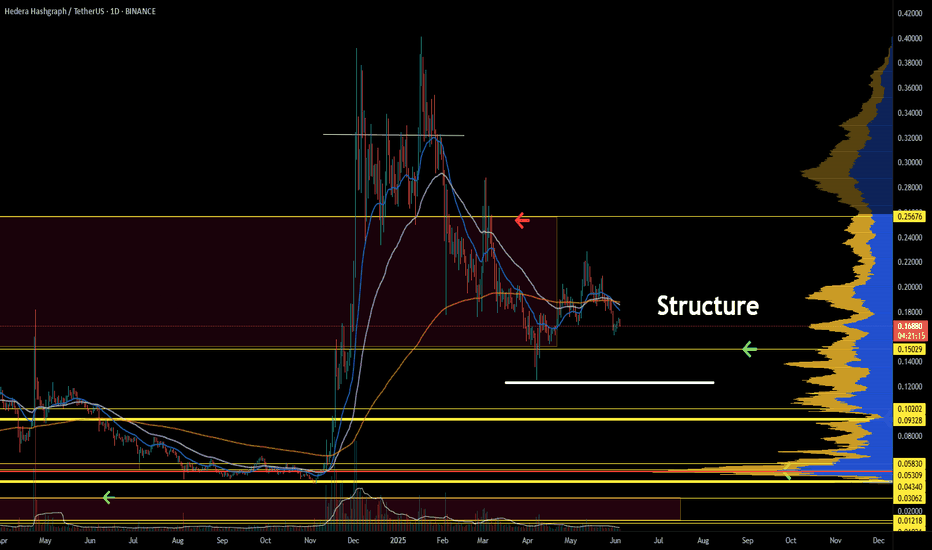
Short time Frame Hbar, NFA just one of the potentials I see Just a quick look at the shorter time frame working hopefully into the next leg up.
Hope to see one more downside movement that will get eaten up good at around the prices mentioned and then maybe we can finally trend up after this 7-9 month correction depending if we end in June or August haha
HBAR - TradeI got stopped out on HBAR,
but I’m still holding multiple long positions on other altcoins.
Most coins seem to be forming bottom structures.
HBAR just swept recent significant lows
and is now showing bullish divergence on the 8H and 20H timeframes — which is typically a strong sign of a bottom.
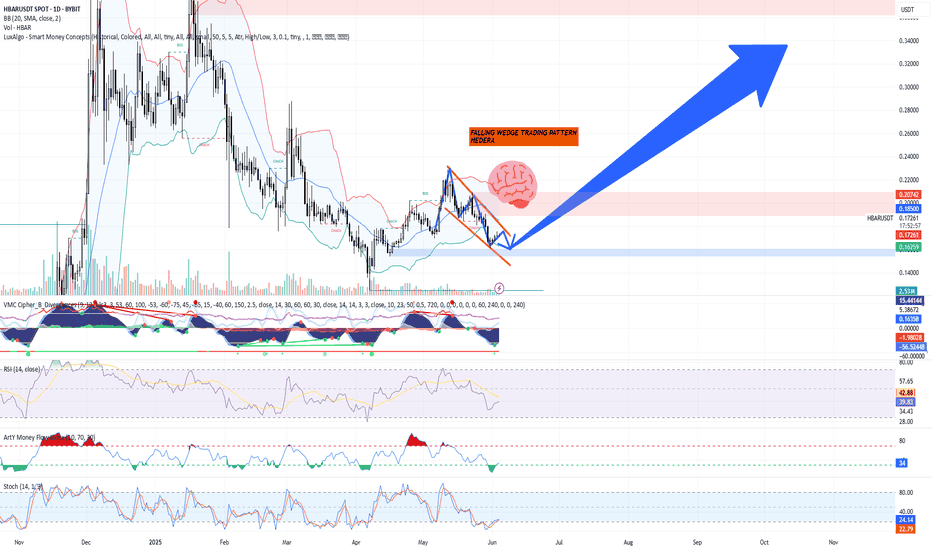
Technical Analysis – HBAR/USDT + TRADE PLANTechnical Analysis – HBAR/USDT (Daily Chart as of June 4, 2025)
Chart Pattern: Falling Wedge (Bullish)
The chart indicates a classic falling wedge pattern, often interpreted as a bullish reversal signal.
This pattern is marked by descending converging trendlines, suggesting declining volatility
See all ideas
Summarizing what the indicators are suggesting.
Oscillators
Neutral
SellBuy
Strong sellStrong buy
Strong sellSellNeutralBuyStrong buy
Oscillators
Neutral
SellBuy
Strong sellStrong buy
Strong sellSellNeutralBuyStrong buy
Summary
Neutral
SellBuy
Strong sellStrong buy
Strong sellSellNeutralBuyStrong buy
Summary
Neutral
SellBuy
Strong sellStrong buy
Strong sellSellNeutralBuyStrong buy
Summary
Neutral
SellBuy
Strong sellStrong buy
Strong sellSellNeutralBuyStrong buy
Moving Averages
Neutral
SellBuy
Strong sellStrong buy
Strong sellSellNeutralBuyStrong buy
Moving Averages
Neutral
SellBuy
Strong sellStrong buy
Strong sellSellNeutralBuyStrong buy
Displays a symbol's price movements over previous years to identify recurring trends.
