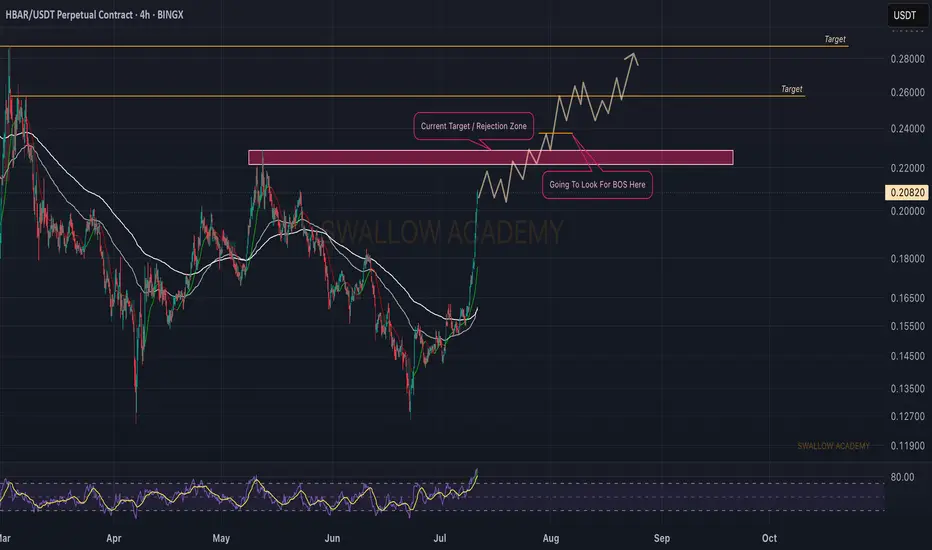
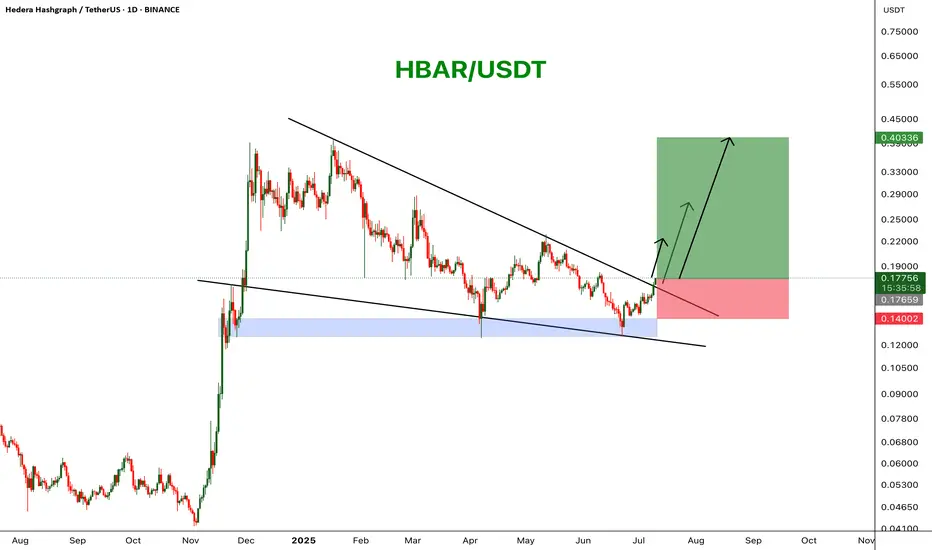
Hedera (HBAR): Looking For Break of Structure (BOS)Hedera is strong where we are seeing a strong upside trend, which might be breaking the local high area (the resistance). As soon as we see it, we are going to look for proper BOS near that area where we will set out a long position.
Now bear in mind, RSI is heavily overbought so we might see some
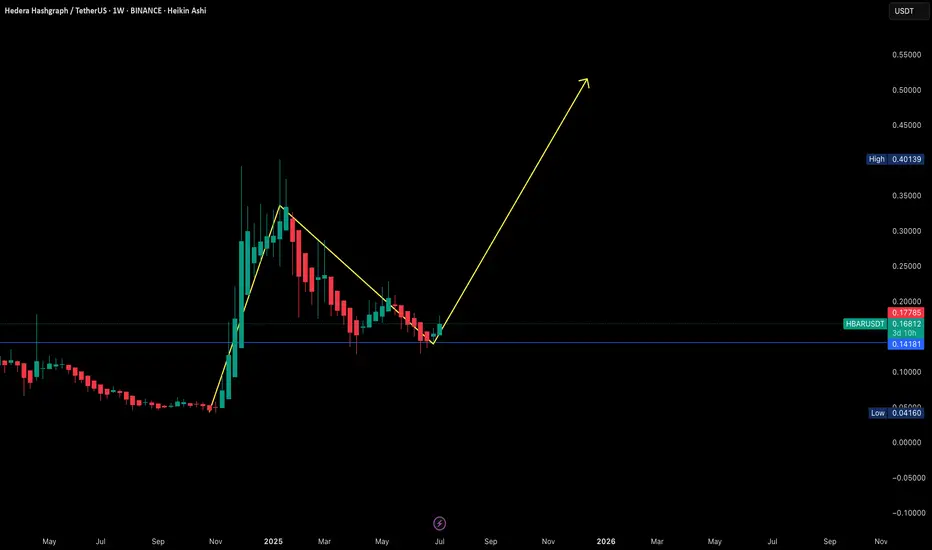
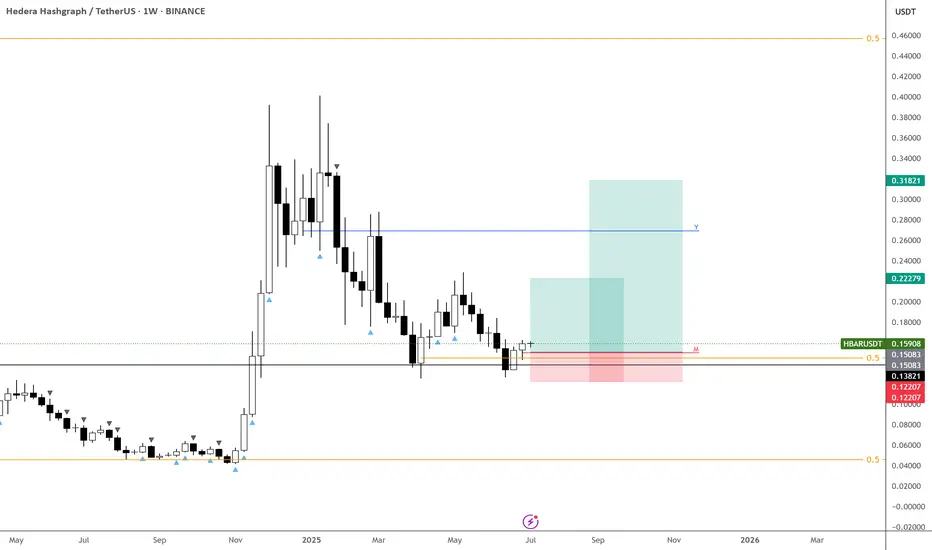
Additional Spot Buy Recommendation (HBARUSDT)Additional Spot Buy Recommendation
Pair: HBARUSDT
Trading Style: Swing (Spot)
Entry (Supplementary): Current price around $0.17 (for those who previously entered at $0.14)
Profit-taking strategy: Follow peaks on Weekly (W) or Monthly (M) timeframes.
Suggested Target: Aim to hold towards $0.
HBARUSDTCryptocurrency Futures Market Disclaimer 🚨🚨🚨
Trading cryptocurrency futures involves high risks and is not suitable for all investors.
Cryptocurrency prices are highly volatile, which can lead to significant gains or losses in a short period.
Before engaging in crypto futures trading, consider
Hedera: How To Catch The Altcoin That Will Move NextWhich one is going to move next? That's the question and here is the answer: Look for those with a confirmed bullish setup.
There are hundreds and hundreds of trading pairs. We go by the saying, "everything will grow." But not everything grows the same day nor at the same time. So which ones are th
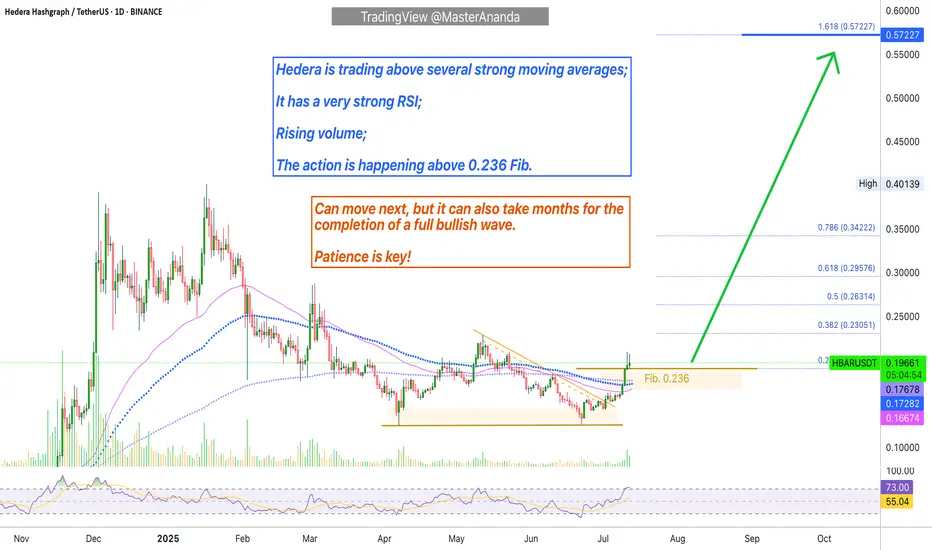
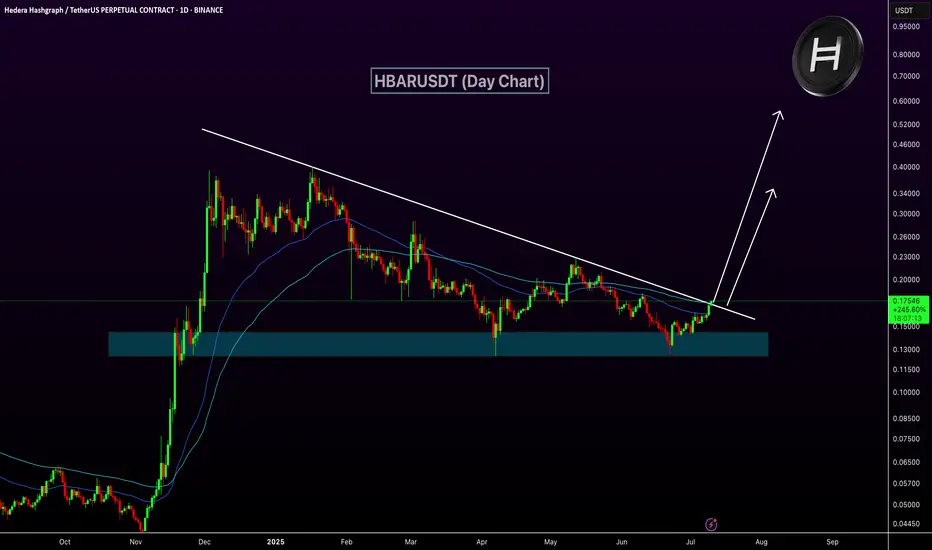
HBARUSDT Wedge BreakoutHBAR has broken out of a falling wedge pattern on the daily chart, signaling a potential bullish reversal. Price is trading above a key support zone and is pushing through descending resistance with strong momentum. A move toward higher targets seems likely if the breakout holds.
Resistance 1: $0.2
HBAR – Key Level Holding, Trend Could Follow
BINANCE:HBARUSDT looks great here around 15c—a strong pivotal area.
As long as this level holds, there’s a real chance we start trending from here.
There’s a clear abyss below, so invalidation is straightforward.
Utility tokens might be next to move—keeping a close eye on this one.
HBARUSDT Trendline Breakout - Target 150%!HBARUSDT is currently attempting a breakout from a long-standing descending trendline on the daily chart. The price has reclaimed a key demand zone and is now trading above both the 50 and 100 EMA, a bullish technical signal suggesting bullish momentum.
If the breakout sustains, HBAR could target t
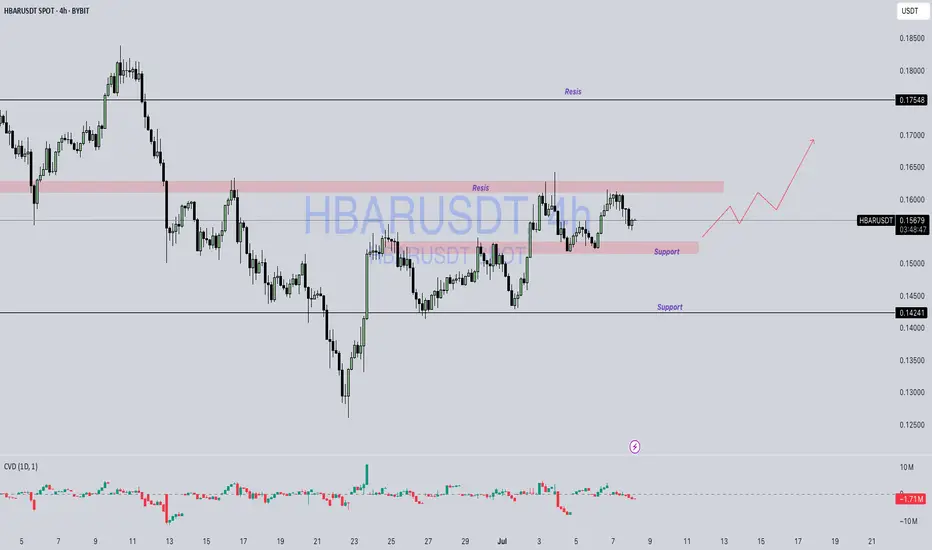
HBAR / USDTBYBIT:HBARUSDT
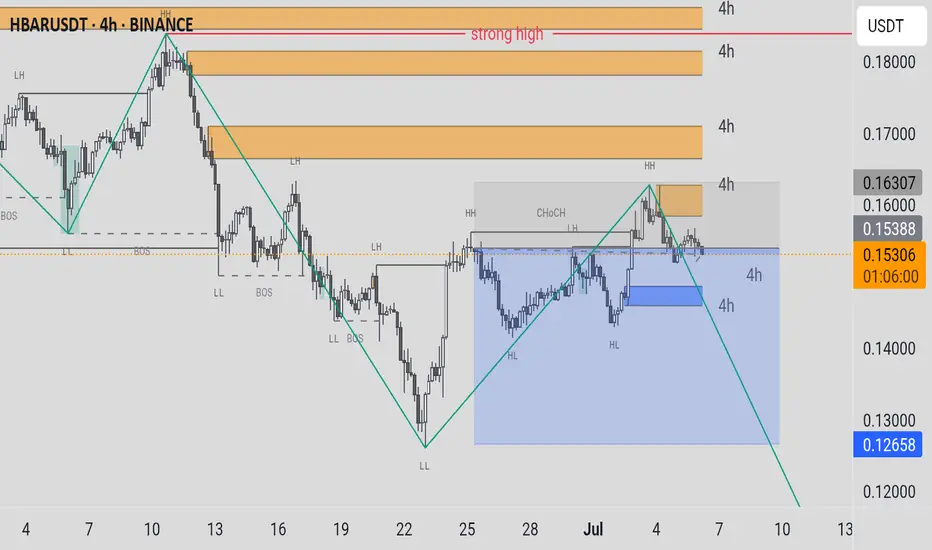
### 📉 **HBAR/USDT 4H Chart Analysis**
*(As of 0.15684 USDT)*
---
### 🔼 **Resistance Zones:**
1. **0.158–0.160 (Local Resistance):**
* Multiple rejections in this zone.
* Price currently struggling to break through.
2. **0.17548 (Major Resistance):**
* Strong histori
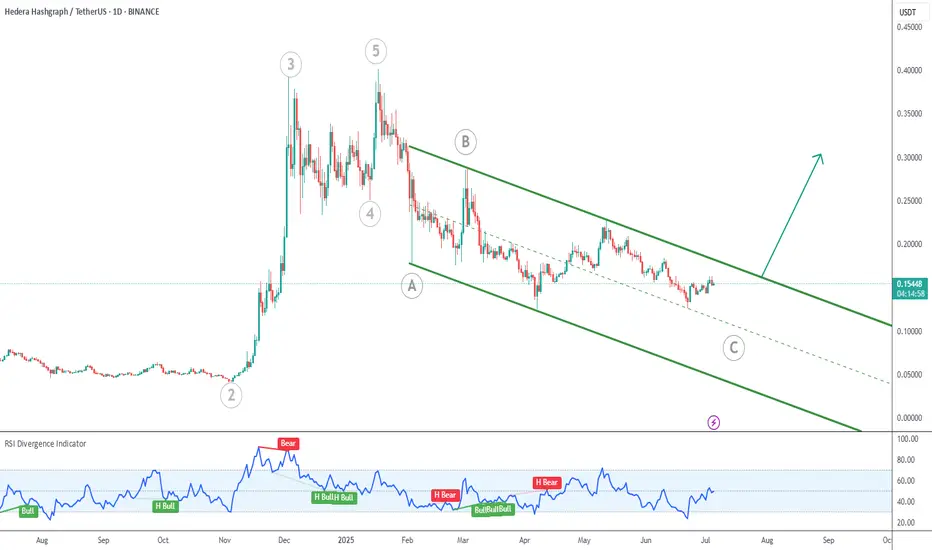
HBAR in Wave C CorrectionThe token is correcting the whole move up which began in early 2023 (at 0.03560).
We are currently in wave C of the correction, so we could see bulls beginning to show up soon.
Price is grinding downwards inside the green descending channel. A breakout from the top of the channel could indicate t
HBAR wait for entryHBAR is a highly volatile crypto that often leads the market during Bitcoin rallies.
Let’s patiently wait for a price dip followed by a bounce from a key support zone.
Disclaimer:
This analysis is based on my personnal views and is not a financial advice. Risk is under your control.

See all ideas
Summarizing what the indicators are suggesting.
Oscillators
Neutral
SellBuy
Strong sellStrong buy
Strong sellSellNeutralBuyStrong buy
Oscillators
Neutral
SellBuy
Strong sellStrong buy
Strong sellSellNeutralBuyStrong buy
Summary
Neutral
SellBuy
Strong sellStrong buy
Strong sellSellNeutralBuyStrong buy
Summary
Neutral
SellBuy
Strong sellStrong buy
Strong sellSellNeutralBuyStrong buy
Summary
Neutral
SellBuy
Strong sellStrong buy
Strong sellSellNeutralBuyStrong buy
Moving Averages
Neutral
SellBuy
Strong sellStrong buy
Strong sellSellNeutralBuyStrong buy
Moving Averages
Neutral
SellBuy
Strong sellStrong buy
Strong sellSellNeutralBuyStrong buy
Displays a symbol's price movements over previous years to identify recurring trends.