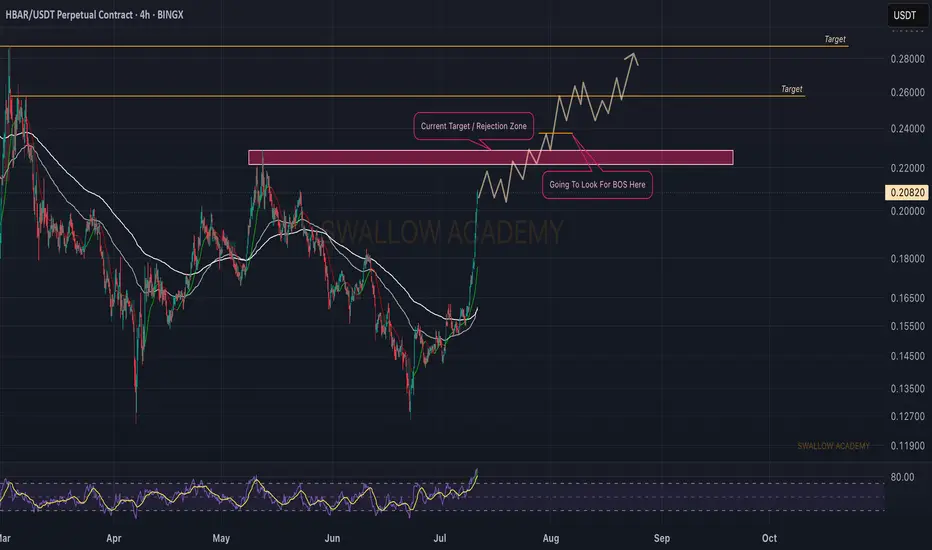
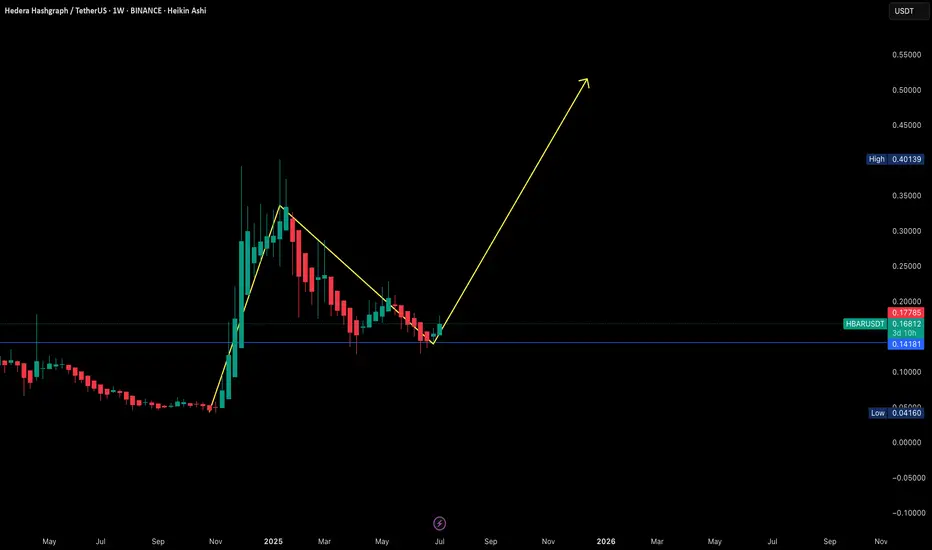
Hedera (HBAR): Looking For Break of Structure (BOS)Hedera is strong where we are seeing a strong upside trend, which might be breaking the local high area (the resistance). As soon as we see it, we are going to look for proper BOS near that area where we will set out a long position.
Now bear in mind, RSI is heavily overbought so we might see some sideways movement or even a proper rejection before that so let's wait patiently.
Swallow Academy
HBARUSDT.P trade ideas
TradeCityPro | HBAR Rebounds Sharply After Trendline Breakout👋 Welcome to TradeCity Pro!
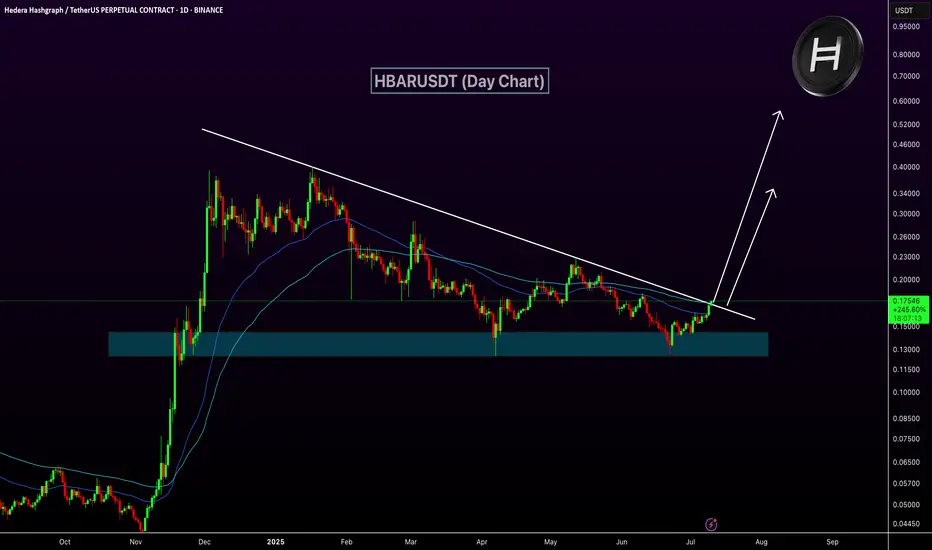
In this analysis, I’m going to review the HBAR coin for you—one of the RWA and Layer1 crypto projects, currently ranked 16 on CoinMarketCap with a market cap of 9.95 billion dollars.
📅 Daily Timeframe
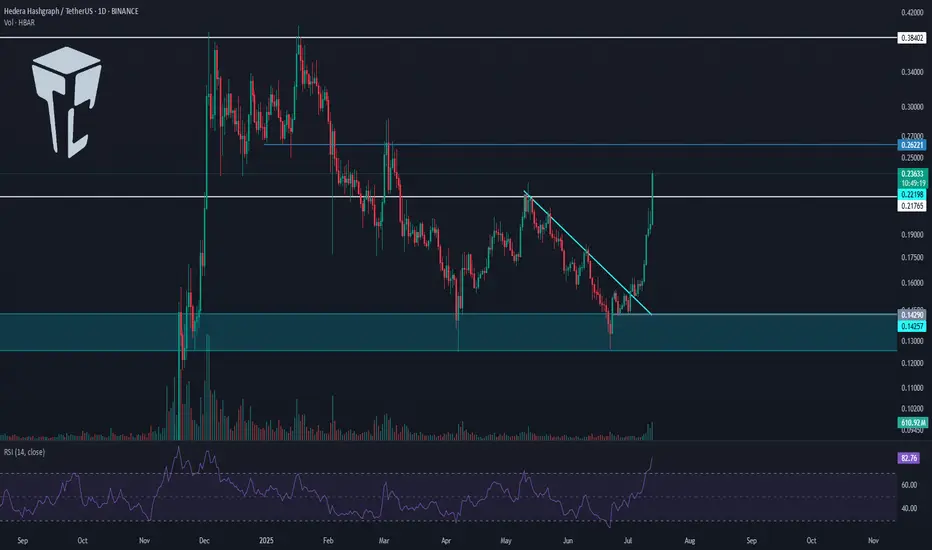
On the daily chart, as you can see, after a bullish rally toward the end of 2024, HBAR entered a corrective phase and is currently still in this correction.
✨ A major support zone (highlighted on the chart) was established, and a range box was formed between this zone and 0.21765 where price had been consolidating.
💥 There was also a descending trendline within this box that the price recently broke through, triggering strong bullish momentum. The price has now even broken above the 0.21765 level.
✔️ A significant increase in buying volume has entered the market, and with RSI entering the Overbuy zone, this move looks poised to continue even more sharply.
🔔 If this bullish momentum persists, the next targets are 0.26221 and 0.38402. If you already have an open position, these levels could be suitable for partial profit-taking.
🛒 If you're looking to buy this coin in spot, the breakout and confirmation above 0.21765 is a decent entry. However, the current stop-loss range is quite wide, so reaching a good risk-to-reward ratio might take longer with this trigger.
📈 The next potential spot triggers are 0.26221 and 0.38402. A breakout above 0.38402 would likely signal the start of a new major bullish leg.
📝 Final Thoughts
This analysis reflects our opinions and is not financial advice.
Share your thoughts in the comments, and don’t forget to share this analysis with your friends! ❤️
Hedera: How To Catch The Altcoin That Will Move NextWhich one is going to move next? That's the question and here is the answer: Look for those with a confirmed bullish setup.
There are hundreds and hundreds of trading pairs. We go by the saying, "everything will grow." But not everything grows the same day nor at the same time. So which ones are the ones more likely to move next?
Here is a simple example: HBARUSDT.
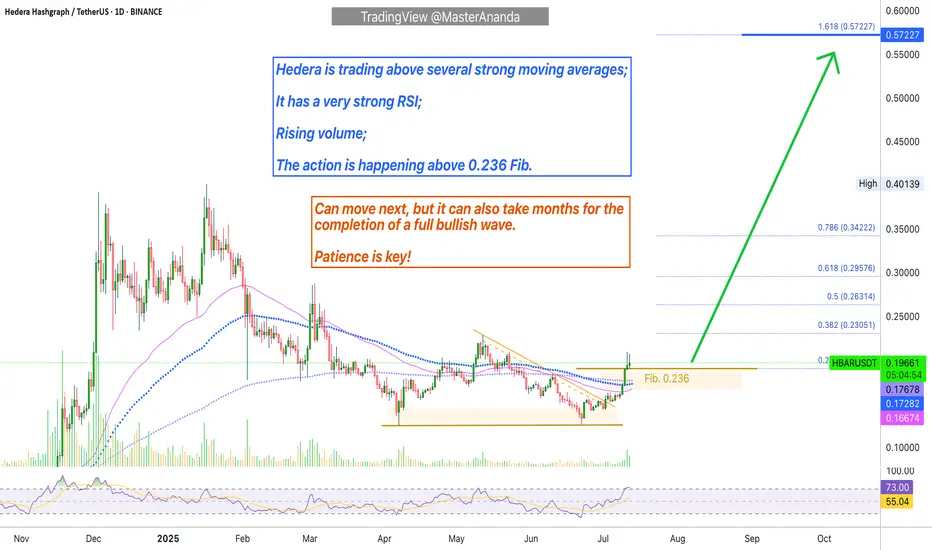
Hedera is trading daily above EMA55, EMA89 and EMA233. While it has already five days green, this one is more likely to move next vs others that are trading below those moving averages. That is what I mean by a confirmed bullish setup.
You can also use MA200 and other indicators such as the RSI and MACD. For example, if the action is happening above a strong Fib. level, this can also be of value. If the RSI is very strong compared to other pairs, this is also good. The more strong bullish signals combined the higher your chances of finding the right one.
My suggestion?
Do not try to catch the next big move. It is better to develop a plan, find the pairs that fit your criteria then buy and hold. Chasing pairs can turn into blind gambling game. It is better to trade on a plan focused on the long-term.
Thank you for reading.
Namaste.
Additional Spot Buy Recommendation (HBARUSDT)Additional Spot Buy Recommendation
Pair: HBARUSDT
Trading Style: Swing (Spot)
Entry (Supplementary): Current price around $0.17 (for those who previously entered at $0.14)
Profit-taking strategy: Follow peaks on Weekly (W) or Monthly (M) timeframes.
Suggested Target: Aim to hold towards $0.50 or according to W/M peak signals.
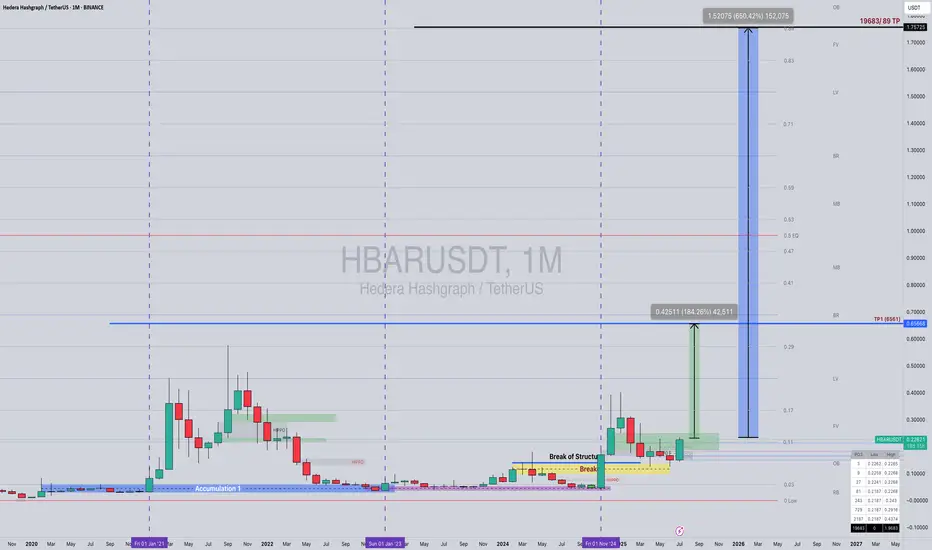
HBAR/USDT Weekly Setup – Lord MEDZ Trading Journal"Where Smart Money Moves, Profits Follow"
This is not financial advice. This post is for personal trading journaling and educational purposes only.
Overview
In this week's market breakdown, I’m sharing my current view on Hedera Hashgraph (HBAR/USDT) using a combination of Smart Money Theory (SMT), Supply & Demand zones, and my proprietary Goldbach Timing Model.
Structure and timing are finally aligning after years of preparation. Based on my analysis, HBAR is showing the potential for a 184% breakout in the near term, with a longer-term projection targeting $1.75 by 2026.
Smart Money Theory (SMT) – From Accumulation to Expansion
HBAR has completed a textbook accumulation cycle, marked by stealth positioning from smart money:
From 2020 to late 2021, price action showed clear signs of Accumulation Phase 1, with suppressed volatility and low-volume accumulation.
In early 2023, HBAR completed its retest phase, holding structural support and rejecting lower demand levels.
A Break of Structure (BOS) occurred in Q4 2024, confirming bullish intent, followed by a clean retest of the Breaker Block (highlighted in yellow on the chart).
According to SMT principles, this BOS confirms that institutional liquidity has re-entered the market—and now, we move toward expansion.
Supply & Demand – Reading the Liquidity Landscape
HBAR is being driven by strong demand and significant inefficiencies above price:
The Breaker Block demand zone between $0.06 and $0.08 held firm, acting as a base for the recent move.
There are large Fair Value Gaps (FVGs) between $0.17 and $0.29, which often act as magnets for price seeking balance.
The next major supply zone sits around $0.65, which also aligns with previous highs and is now my first major target (TP1).
Price is currently reclaiming these inefficiencies, and if momentum holds, we could see rapid continuation toward the upper supply targets.
Goldbach Timing Model – Precision Cycle Forecasting
The Goldbach Cycle Window I use is a proprietary time-based projection model designed to capture cyclical expansions around liquidity events. It has successfully forecasted previous expansions with high precision.
For HBAR, here’s how the model lines up:
November 2024 marked the break of structure and initiation of the current bullish leg.
May 2025 is my forecasted expansion window, when momentum is expected to accelerate further.
The final cycle confluence target is projected to align with $1.75 by 2026, based on historic symmetry and previous expansions.
This alignment of price action and time-based expansion gives me high confidence in the setup.
Trading Plan (as of July 2025)
My personal trading strategy here is structured as follows:
I am currently re-accumulating long positions around $0.22, as price consolidates above the previous range highs. Upon a clean breakout and close above $0.23, I plan to add to my position.
My first target is $0.65, which aligns with a major supply zone and likely liquidity cluster. I intend to take partial profits there.
If market conditions remain favorable and we maintain momentum through the Goldbach window, my final long-term target is $1.75—a projected cycle top based on structural and time confluence.
Final Thoughts
HBAR is no longer in sleeper territory. It’s now a chart with structure, imbalance, and timing on its side.
As always, I remain patient and disciplined. If we see clean continuation through $0.60–$0.65, we enter what I consider clear skies—where price has little resistance on the way to cycle targets.
🙏 Thank you for taking the time to read. I appreciate every like, repost, and follow as I continue journaling these setups.
Grateful for the support!
🔔 Follow Lord MEDZ for more cycle-based Smart Money setups and insights.
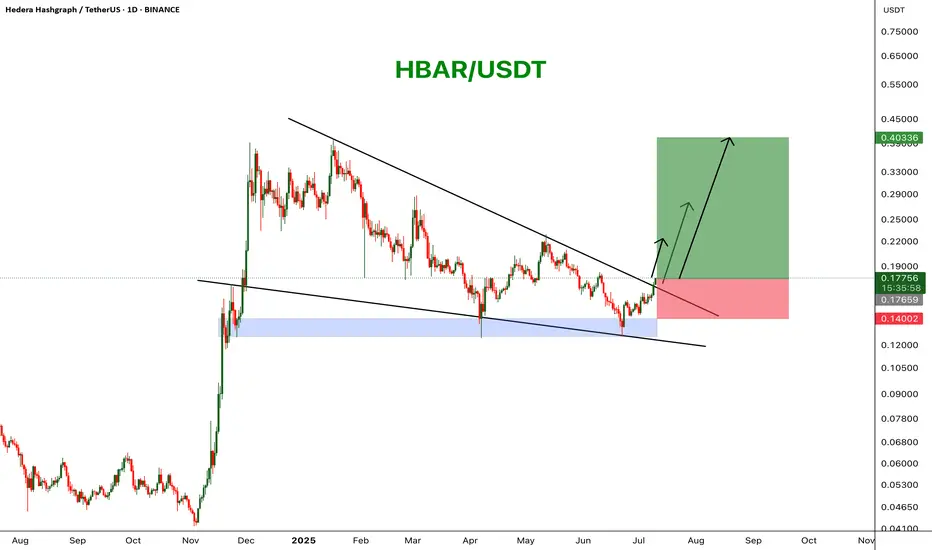
HBARUSDT Wedge BreakoutHBAR has broken out of a falling wedge pattern on the daily chart, signaling a potential bullish reversal. Price is trading above a key support zone and is pushing through descending resistance with strong momentum. A move toward higher targets seems likely if the breakout holds.
Resistance 1: $0.22
Resistance 2: $0.27
Resistance 3: $0.40
Stop Loss: $0.14
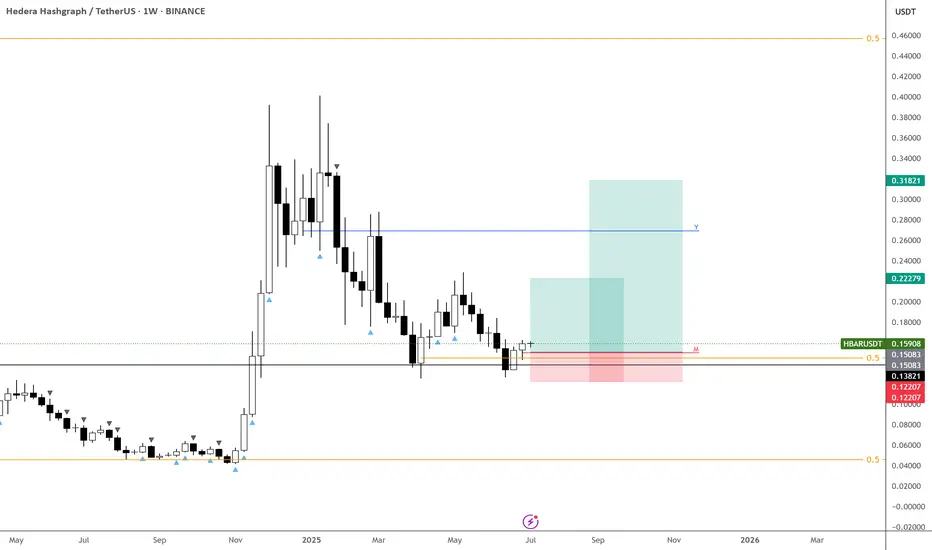
HBAR – Key Level Holding, Trend Could Follow
BINANCE:HBARUSDT looks great here around 15c—a strong pivotal area.
As long as this level holds, there’s a real chance we start trending from here.
There’s a clear abyss below, so invalidation is straightforward.
Utility tokens might be next to move—keeping a close eye on this one.
HBARUSDT Trendline Breakout - Target 150%!HBARUSDT is currently attempting a breakout from a long-standing descending trendline on the daily chart. The price has reclaimed a key demand zone and is now trading above both the 50 and 100 EMA, a bullish technical signal suggesting bullish momentum.
If the breakout sustains, HBAR could target the 0.30–0.55 range in the coming weeks. Holding above the EMAs and trendline retest will be crucial for confirmation.
HBAR wait for entryHBAR is a highly volatile crypto that often leads the market during Bitcoin rallies.
Let’s patiently wait for a price dip followed by a bounce from a key support zone.
Disclaimer:
This analysis is based on my personnal views and is not a financial advice. Risk is under your control.

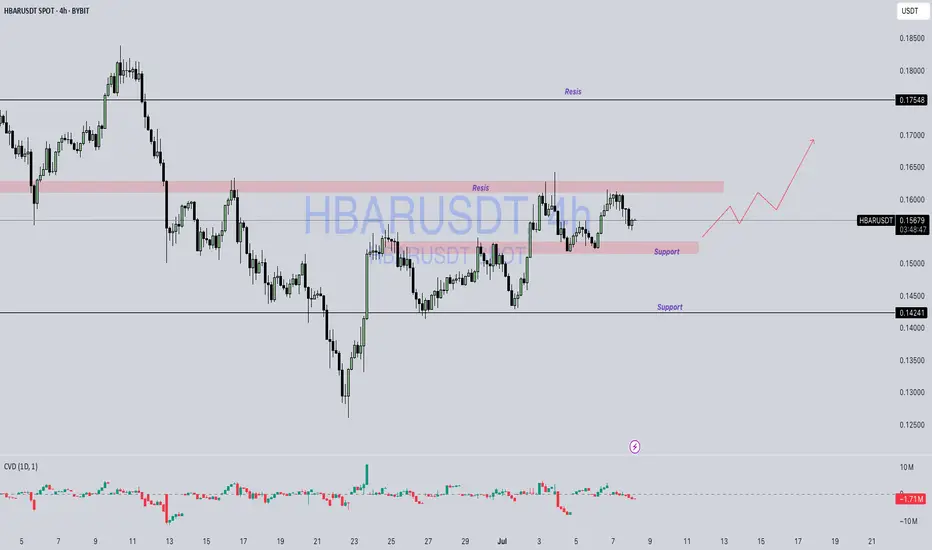
HBAR / USDTBYBIT:HBARUSDT
### 📉 **HBAR/USDT 4H Chart Analysis**
*(As of 0.15684 USDT)*
---
### 🔼 **Resistance Zones:**
1. **0.158–0.160 (Local Resistance):**
* Multiple rejections in this zone.
* Price currently struggling to break through.
2. **0.17548 (Major Resistance):**
* Strong historical level.
* Acted as a turning point previously.
---
### 🔽 **Support Zones:**
1. **\~0.150 (Local Support):**
* Recent reaction area.
* Price found temporary stability here.
2. **0.14241 (Major Support):**
* Strong reversal zone in previous sessions.
* Significant demand was seen historically.
---
### ⚙️ **Price Behavior:**
* Market is in a **sideways consolidation** phase.
* No breakout or breakdown confirmed.
* Structure is developing between support and resistance boundaries.
---
### 📌 **Key Observations:**
* Lower highs forming near resistance may suggest hesitation.
* Consolidation can often lead to stronger moves once direction is confirmed.
* Watching volume and reaction near key levels is critical.
---
> **Disclaimer:**
> This analysis is for educational and informational purposes only. It is **not financial advice**. Always do your own research (DYOR) and consult a professional before making any trading decisions.
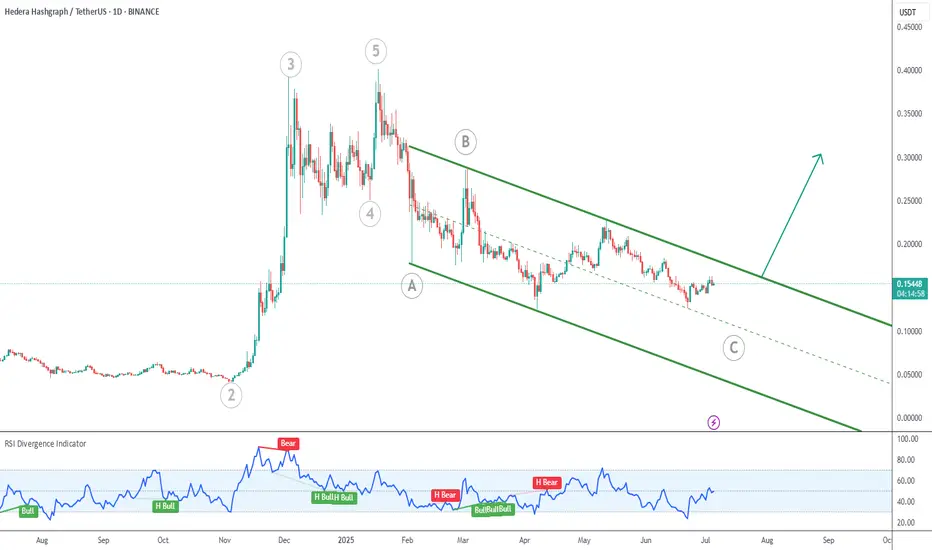
HBAR in Wave C CorrectionThe token is correcting the whole move up which began in early 2023 (at 0.03560).
We are currently in wave C of the correction, so we could see bulls beginning to show up soon.
Price is grinding downwards inside the green descending channel. A breakout from the top of the channel could indicate the correction is over, with a lot of potential upside.
HBARUSDTCryptocurrency Futures Market Disclaimer 🚨🚨🚨
Trading cryptocurrency futures involves high risks and is not suitable for all investors.
Cryptocurrency prices are highly volatile, which can lead to significant gains or losses in a short period.
Before engaging in crypto futures trading, consider your risk tolerance, experience, and financial situation.
Risk of Loss: You may lose more than your initial capital due to the leveraged nature of futures. You are fully responsible for any losses incurred.
Market Volatility: Crypto prices can fluctuate significantly due to factors such as market sentiment, regulations, or unforeseen events.
Leverage Risk: The use of leverage can amplify profits but also increases the risk of total loss.
Regulatory Uncertainty: Regulations related to cryptocurrencies vary by jurisdiction and may change, affecting the value or legality of trading.
Technical Risks: Platform disruptions, hacking, or technical issues may result in losses.
This information is not financial, investment, or trading advice. Consult a professional financial advisor before making decisions. We are not liable for any losses or damages arising from cryptocurrency futures trading.
Note: Ensure compliance with local regulations regarding cryptocurrency trading in your region.
thanks for like and follow @ydnldn to have more information outlook and free signal.
About me :
"I am a passionate swing trader focused on analyzing financial markets to capture profit opportunities from medium-term price movements. With a disciplined approach and in-depth technical analysis, I concentrate on identifying trends, support-resistance levels, and price patterns to make informed trading decisions. I prioritize strict risk management to protect capital while maximizing profit potential. Always learning and adapting to market dynamics, I enjoy the process of refining strategies to achieve consistency in trading."
Hedera (HBAR): Seeing Good Momentum | Eyes on EMAsHedera has formed a nice small uptrend here where buyers recently broke the 200EMA mark on the daily timeframe. As we are seeing some sort of buying volume forming here, we are waiting for a proper bounce from here, which would mean that we would continue the growth in this small trend.
Setup is valid as long as we are above 200EMA
Swallow Academy

HBAR — “Cup and Handle” in Motion: Secondary Trend Unfolding Secondary Trend (Recovery Phase After Capitulation)
After a long accumulation phase at the bottom, the price made a strong impulsive move upward with growing volume. This created a classic “Cup and Handle” formation, where the initial surge was stopped by major resistance near the cup's rim. Currently, the price is finalizing the handle and may be preparing for a potential breakout continuation.
Local Trend (Within the Handle)
The handle has formed a Double Bottom pattern — typically a bullish structure. Since the price has already moved significantly off the lows, this is not the best entry point for short-term trades. However, from a secondary trend perspective, the setup still looks promising.
Target Zones
If the breakout continues, the first significant target lies near the resistance zone of the previous cup top — a key area where sellers previously stepped in. Reaching this zone would confirm the strength of the recovery trend and may lead to a broader reversal.
✅ Not financial advice. Always follow your own trading plan and risk management strategy.
🔍 For more trade setups — find us on Telegram and join the discussion.

Hbar pump to $0.15362 soonEntered a long earlier on hbar. Targeting $0.15362
Taking partial along the way.
Might correct a little bit more before take off but I doubt it be a deep correction.
3-6RR

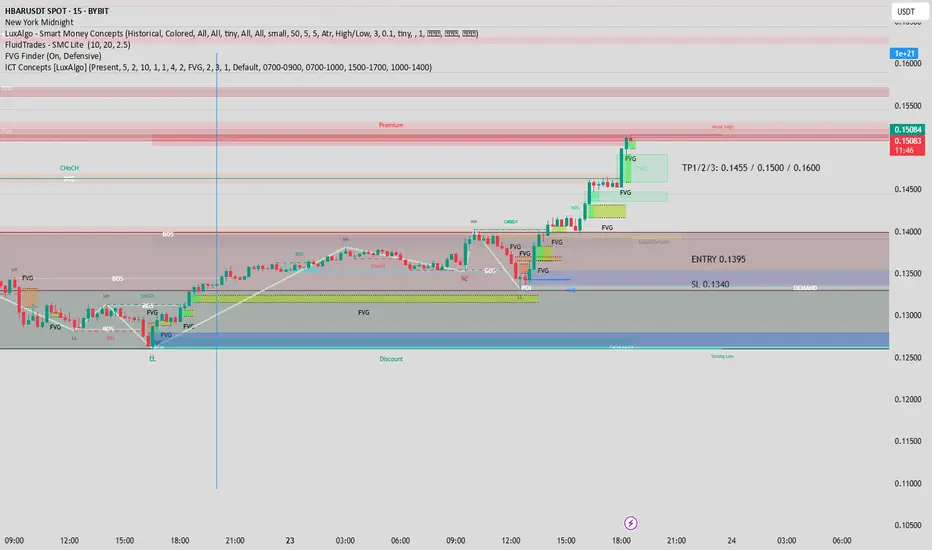
BARUSDT | Bullish SMC Structure – FVG Reentry & Demand ReactionThis idea is based on a bullish market structure shift in HBARUSDT 15m, utilizing ICT/Smart Money Concepts.
Price formed a CHoCH after sweeping sell-side liquidity near 0.1300, followed by multiple bullish BOS confirming a trend reversal. The current structure is forming HHs and HLs.
Price has entered the premium zone, and I am expecting a retracement into the 0.1400–0.1370 Fair Value Gap (FVG), which aligns with a previous BOS zone and equilibrium level. This is a key POI where Smart Money is likely to re-enter.
**Trade Setup**
- **Entry Zone**: 0.1400 – 0.1370 (FVG + EQ)
- **Stop Loss**: Below 0.1340 (under demand zone)
- **TP1**: 0.1455 (previous high hit)
- **TP2**: 0.1500
- **TP3**: 0.1550–0.1600 (supply zone)
I will monitor lower timeframe CHoCH or bullish confirmation within the POI to execute this idea.
This trade plan respects risk management and Smart Money narrative: liquidity grab, displacement, FVG mitigation, and entry from discount pricing.
Hedera (HBAR): Buyers Pushing For Breakout | Good Buy EntryHedera is loading up for a breakout here, which might give us a good R:R trade if executed properly.
What we are looking for is a proper breakout where buyers maintain the dominance in that region, after which our target is going to be the resistance zone and 200EMA line.
Swallow Academy
HBAR movingHBAR broke resistance and previous high
we might see a pullback before a continuation to the upside
if stopped out ... then look for re-entry on the 4hr break
of the newly created high ( not created yet )
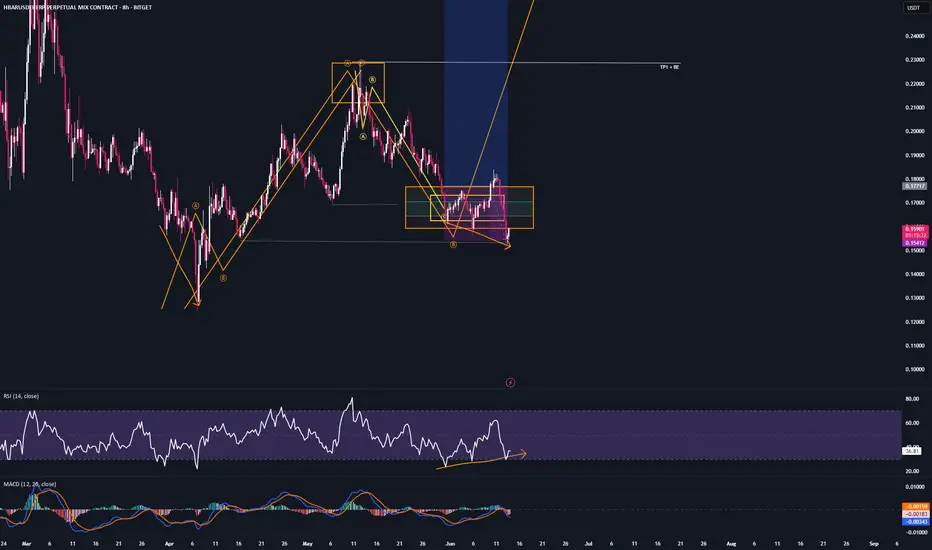
3M CLS I KL - FVG I Model 2 I Target 50% CLSHey, Market Warriors, here is another outlook on this instrument
If you’ve been following me, you already know every setup you see is built around a CLS Footprint, a Key Level, Liquidity and a specific execution model.
If you haven't followed me yet, start now.
My trading system is completely mechanical — designed to remove emotions, opinions, and impulsive decisions. No messy diagonal lines. No random drawings. Just clarity, structure, and execution.
🧩 What is CLS?
CLS is real smart money — the combined power of major investment banks and central banks moving over 6.5 trillion dollars a day. Understanding their operations is key to markets.
✅ Understanding the behavior of CLS allows you to position yourself with the giants during the market manipulations — leading to buying lows and selling highs - cleaner entries, clearer exits, and consistent profits.
📍 Model 1
is right after the manipulation of the CLS candle when CIOD occurs, and we are targeting 50% of the CLS range. H4 CLS ranges supported by HTF go straight to the opposing range.
"Adapt what is useful, reject what is useless, and add what is specifically your own."
— David Perk aka Dave FX Hunter ⚔️
👍 Hit like if you find this analysis helpful, and don't hesitate to comment with your opinions, charts or any questions.
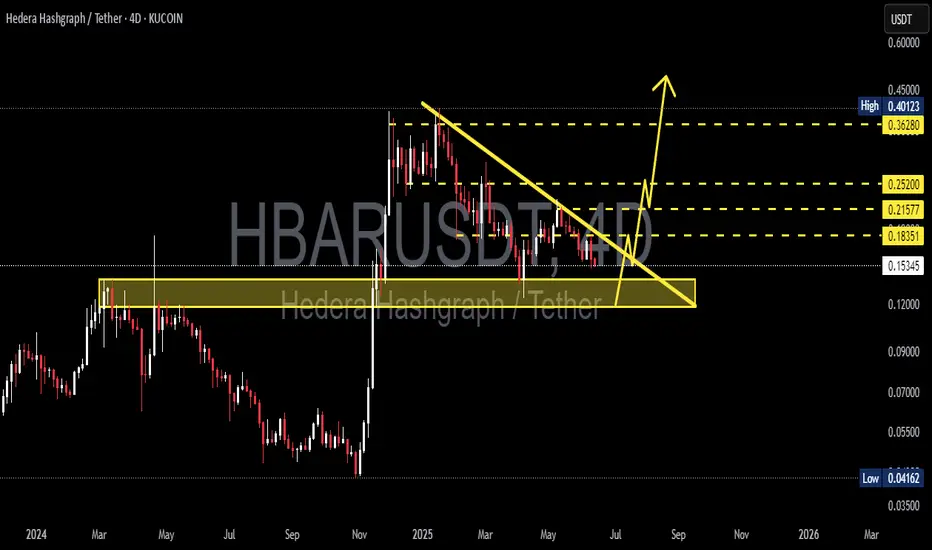
HBARUSDT 4D AnalysisHBAR ~ 4D Analysis
#HBAR This is the closest support for now. Buy if you still have faith in this coin with a short term target of at least 15%+ from here.
HBAR - TradeI got stopped out on HBAR,
but I’m still holding multiple long positions on other altcoins.
Most coins seem to be forming bottom structures.
HBAR just swept recent significant lows
and is now showing bullish divergence on the 8H and 20H timeframes — which is typically a strong sign of a bottom.
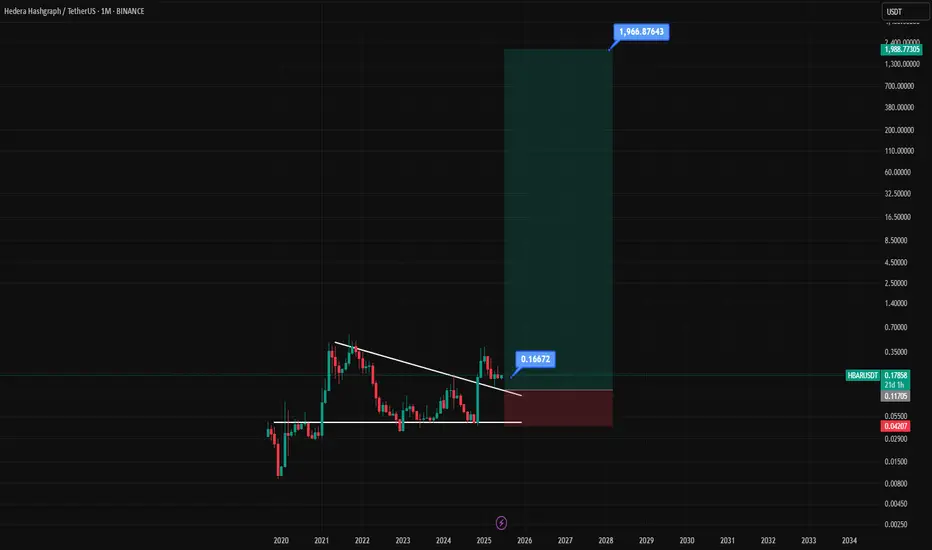
A Colossal Rally Scenario for HBAR to $1,966HBAR is the utility and security token of the Hedera network, a high-performance distributed ledger that aims to be a faster, fairer, and more secure alternative to traditional blockchains, specifically designed to meet the needs of mainstream and enterprise-level applications.
Chart Pattern Analysis
Major Pattern: Descending Triangle
The most significant pattern on this monthly chart is a large descending triangle that has been forming since late 2021.
The upper boundary is a descending trendline connecting the lower highs.
The lower boundary is a strong horizontal support line around the $0.042 level, which was tested and held multiple times throughout 2023.
Bullish Breakout and Retest
In early 2025 (according to the chart's timeline), the price has decisively broken out of the top of this descending triangle. A breakout from such a long-term consolidation pattern is typically a very strong bullish signal.
Following the breakout, the price seems to be performing a retest. It has come back down to touch the former resistance trendline, which is now acting as new support. This is a classic technical move that confirms the strength of the breakout.
Candlestick Analysis
The breakout candle is a strong, full-bodied green candle, indicating significant buying pressure and conviction behind the move.
The most recent candles are consolidating above the breakout level, holding the new support. This suggests that buyers are absorbing any selling pressure and preparing for the next move higher.
Price Prediction
Based on this technical setup, the outlook for HBAR is bullish.
Short-Term to Medium-Term: After successfully holding the retest of the broken trendline, the price is poised to continue its upward trend. The first major target would be the previous all-time high from 2021 (around $0.57).
Long-Term Projection: The analyst who created the chart has plotted a very ambitious long-term target at $1,966.87643. This is likely a calculated "measured move" of the triangle pattern, projected upwards from the breakout point. While the pattern itself is very bullish, this specific target is extremely optimistic and would represent a massive, multi-year bull run.
Summary
The chart suggests that HBAR has completed a long bearish/consolidation phase and has begun a new major uptrend. The breakout from the multi-year descending triangle, confirmed by a successful retest, is a powerful signal for future price appreciation.
The price is expected to go up. The immediate trajectory is likely continued upward movement, with key historical resistance levels as initial targets. The extremely high long-term target should be viewed as a highly speculative, best-case scenario.
Key Levels to Watch:
Support: The descending trendline (currently around 0.12−0.15) and the horizontal support at $0.11705.
Invalidation Point: A decisive drop back below the major support level at $0.04207 would invalidate this bullish thesis.
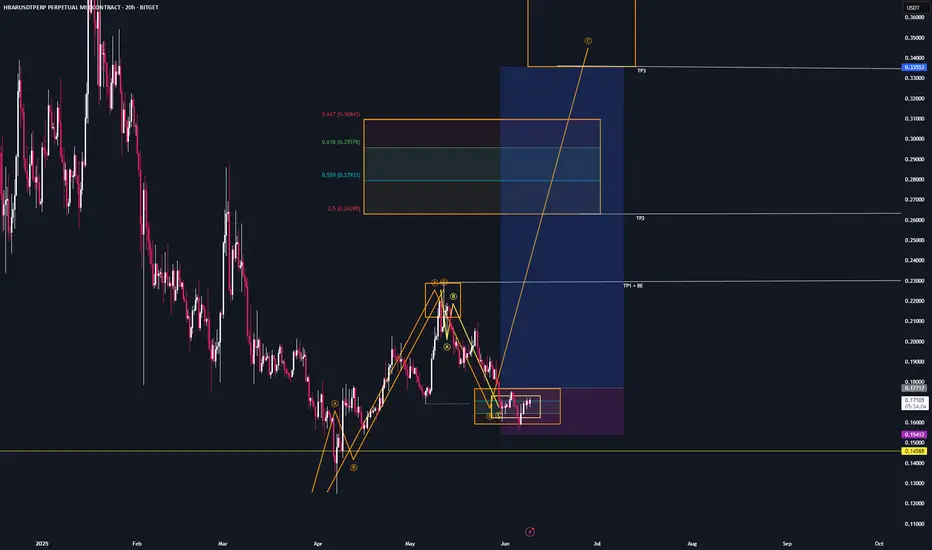
HBAR - setupWe’re still within the bullish trend reversal zone and the bearish target area.
If you’re not positioned long yet, this CRYPTOCAP:HBAR setup is worth considering.
I’m long on this one.
Tp1 + BE : at $0.22 — recent highs
Tp2: at $0.26 — trend reversal area
Tp3: at $0.333— target region
If you have any questions about my system or trade logic, drop them below — I read every comment 👇