Hbar pump to $0.15362 soonEntered a long earlier on hbar. Targeting $0.15362
Taking partial along the way.
Might correct a little bit more before take off but I doubt it be a deep correction.
3-6RR
HBARUSDT.P trade ideas

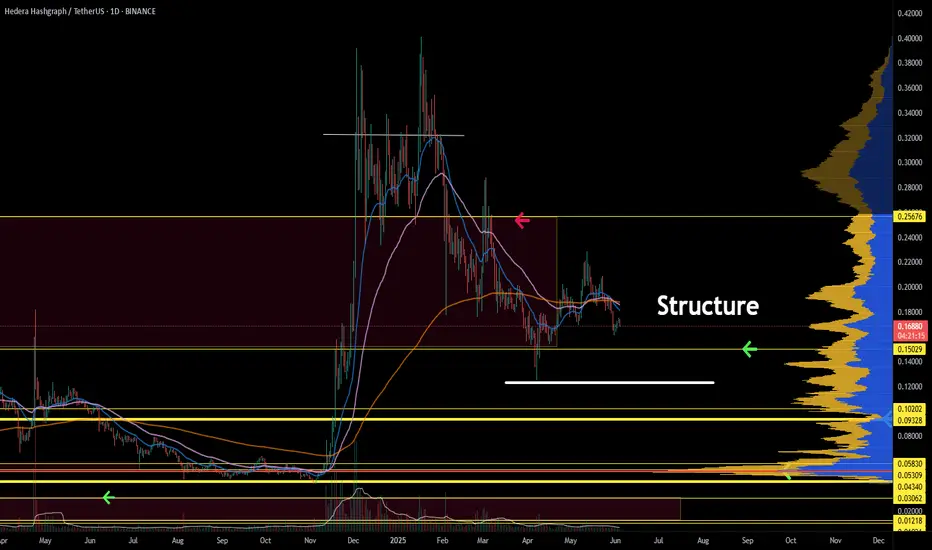
Hedera (HBAR): Seeing Good Momentum | Eyes on EMAsHedera has formed a nice small uptrend here where buyers recently broke the 200EMA mark on the daily timeframe. As we are seeing some sort of buying volume forming here, we are waiting for a proper bounce from here, which would mean that we would continue the growth in this small trend.
Setup is valid as long as we are above 200EMA
Swallow Academy

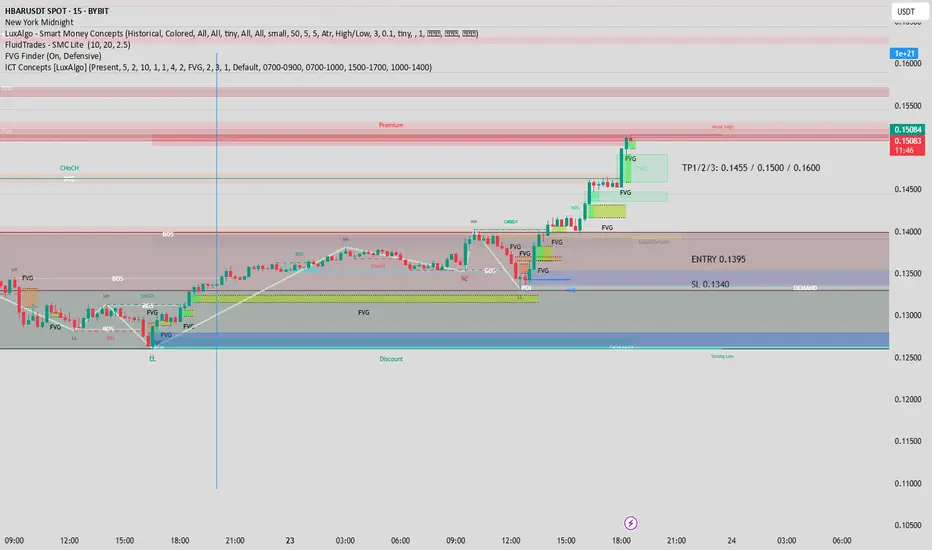
BARUSDT | Bullish SMC Structure – FVG Reentry & Demand ReactionThis idea is based on a bullish market structure shift in HBARUSDT 15m, utilizing ICT/Smart Money Concepts.
Price formed a CHoCH after sweeping sell-side liquidity near 0.1300, followed by multiple bullish BOS confirming a trend reversal. The current structure is forming HHs and HLs.
Price has entered the premium zone, and I am expecting a retracement into the 0.1400–0.1370 Fair Value Gap (FVG), which aligns with a previous BOS zone and equilibrium level. This is a key POI where Smart Money is likely to re-enter.
**Trade Setup**
- **Entry Zone**: 0.1400 – 0.1370 (FVG + EQ)
- **Stop Loss**: Below 0.1340 (under demand zone)
- **TP1**: 0.1455 (previous high hit)
- **TP2**: 0.1500
- **TP3**: 0.1550–0.1600 (supply zone)
I will monitor lower timeframe CHoCH or bullish confirmation within the POI to execute this idea.
This trade plan respects risk management and Smart Money narrative: liquidity grab, displacement, FVG mitigation, and entry from discount pricing.
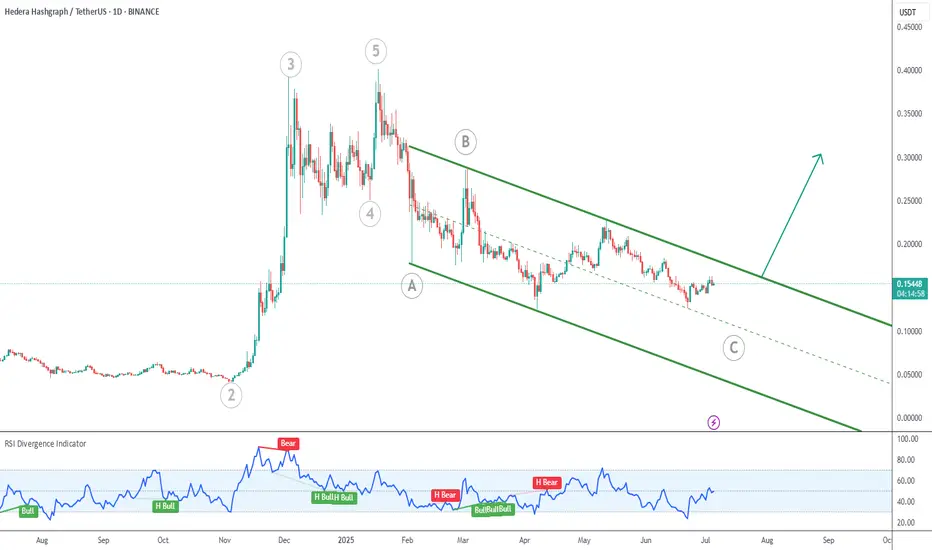
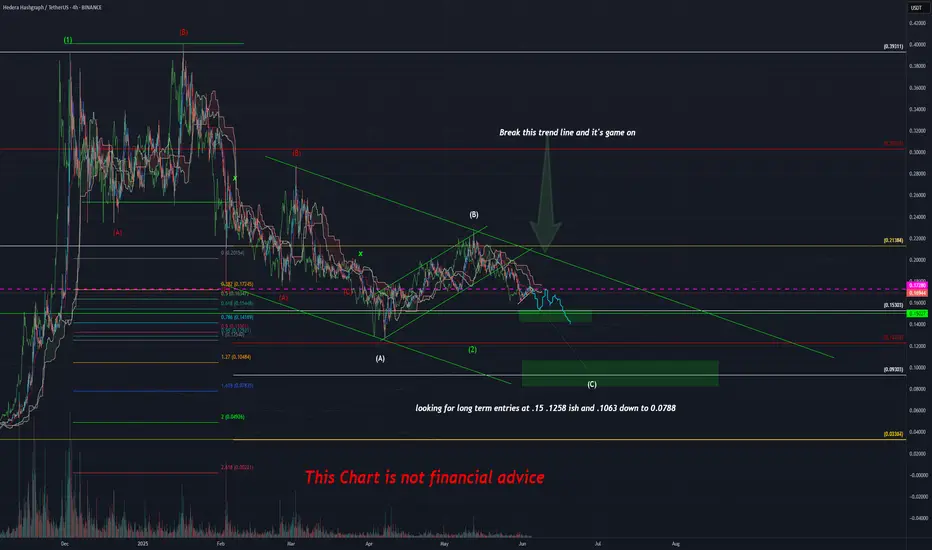
HBAR in Wave C CorrectionThe token is correcting the whole move up which began in early 2023 (at 0.03560).
We are currently in wave C of the correction, so we could see bulls beginning to show up soon.
Price is grinding downwards inside the green descending channel. A breakout from the top of the channel could indicate the correction is over, with a lot of potential upside.
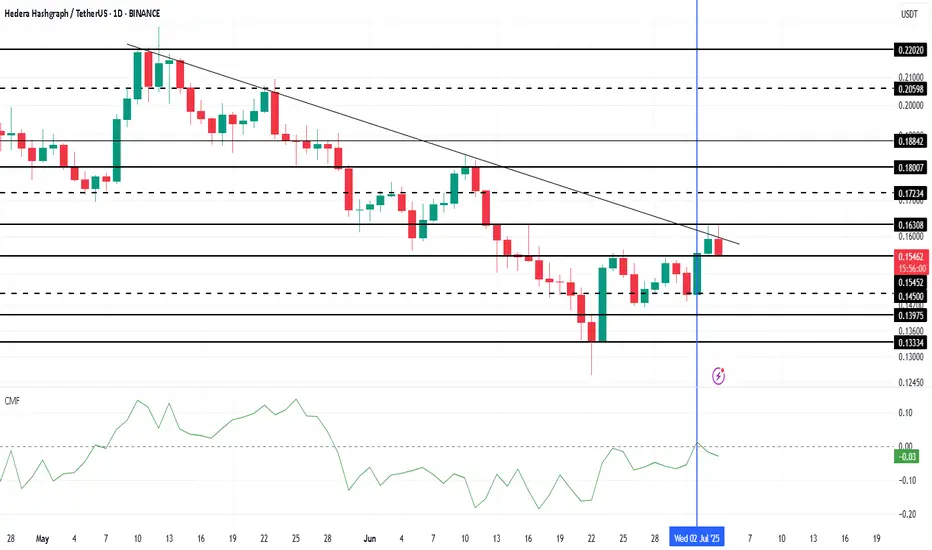
HBAR Price Outlook: Weak Inflows Hold Back Its GrowthHBAR’s price has been stuck under a two-week-long downtrend , currently trading at $0.156. To escape this trend, HBAR will need to show further signs of strength, both from technical indicators and market sentiment.
The Chaikin Money Flow (CMF) indicator has struggled to close above the zero line, signaling weak inflows into HBAR. This is a concerning signal , as the CMF failing to sustain positive movement reflects investor skepticism and a lack of strong buying interest.
Although HBAR briefly crossed into the positive CMF zone for the first time in over a month, the overall market sentiment remains weak.
The first major hurdle for HBAR is breaking and flipping the $0.163 level into support . This is crucial as it would pave the way for the altcoin to reach the $0.180 resistance level. Investors will need to hold their positions through this critical phase, as any premature selling could derail the potential for further gains.
However, the bullish outlook could be invalidated if investor sentiment shifts to selling, whether for profit-taking or due to increased uncertainty. Losing the $0.154 support level would likely result in a drop toward $0.139, ending any hopes for a continued recovery in the short term.
Read More - HBAR Price Struggles to Break Out: What’s Holding the Altcoin Back?
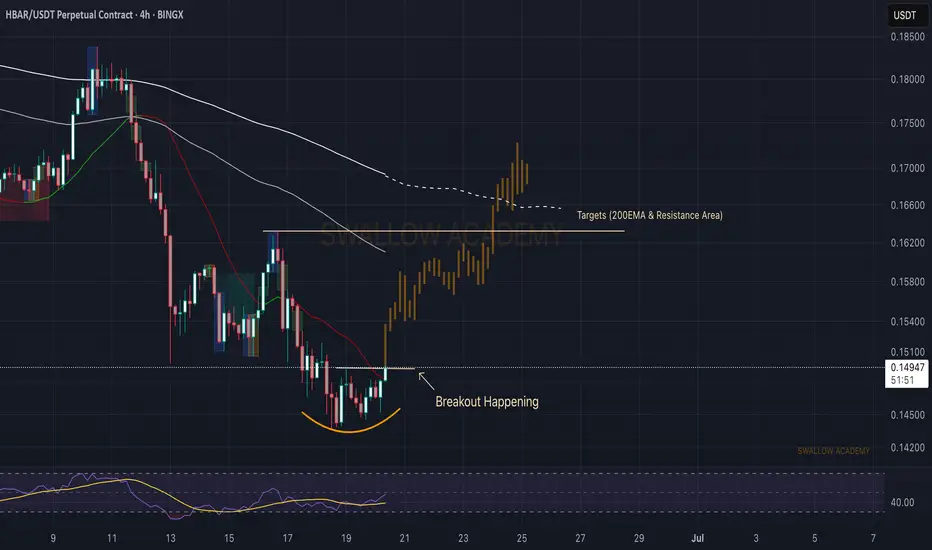
Hedera (HBAR): Buyers Pushing For Breakout | Good Buy EntryHedera is loading up for a breakout here, which might give us a good R:R trade if executed properly.
What we are looking for is a proper breakout where buyers maintain the dominance in that region, after which our target is going to be the resistance zone and 200EMA line.
Swallow Academy
HBAR movingHBAR broke resistance and previous high
we might see a pullback before a continuation to the upside
if stopped out ... then look for re-entry on the 4hr break
of the newly created high ( not created yet )
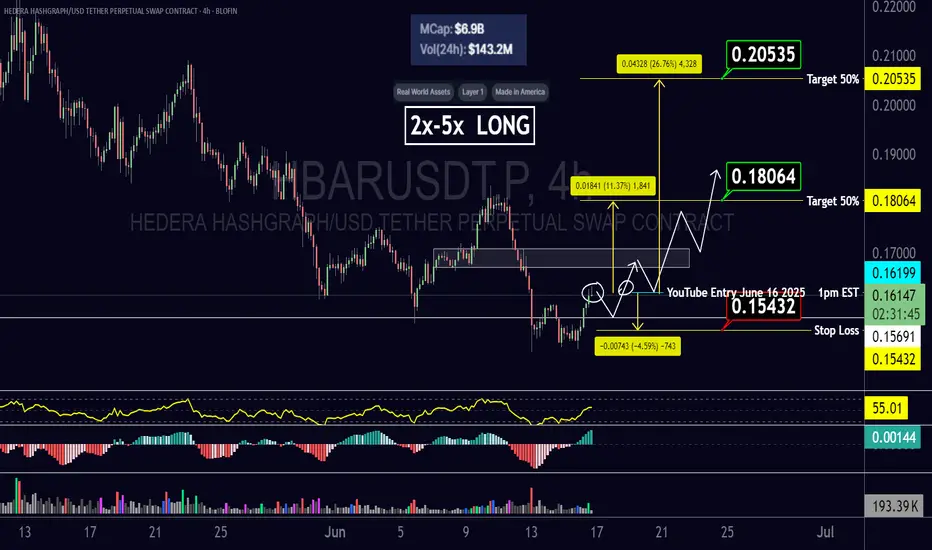
3M CLS I KL - FVG I Model 2 I Target 50% CLSHey, Market Warriors, here is another outlook on this instrument
If you’ve been following me, you already know every setup you see is built around a CLS Footprint, a Key Level, Liquidity and a specific execution model.
If you haven't followed me yet, start now.
My trading system is completely mechanical — designed to remove emotions, opinions, and impulsive decisions. No messy diagonal lines. No random drawings. Just clarity, structure, and execution.
🧩 What is CLS?
CLS is real smart money — the combined power of major investment banks and central banks moving over 6.5 trillion dollars a day. Understanding their operations is key to markets.
✅ Understanding the behavior of CLS allows you to position yourself with the giants during the market manipulations — leading to buying lows and selling highs - cleaner entries, clearer exits, and consistent profits.
📍 Model 1
is right after the manipulation of the CLS candle when CIOD occurs, and we are targeting 50% of the CLS range. H4 CLS ranges supported by HTF go straight to the opposing range.
"Adapt what is useful, reject what is useless, and add what is specifically your own."
— David Perk aka Dave FX Hunter ⚔️
👍 Hit like if you find this analysis helpful, and don't hesitate to comment with your opinions, charts or any questions.
HBARUSDT 4D AnalysisHBAR ~ 4D Analysis
#HBAR This is the closest support for now. Buy if you still have faith in this coin with a short term target of at least 15%+ from here.
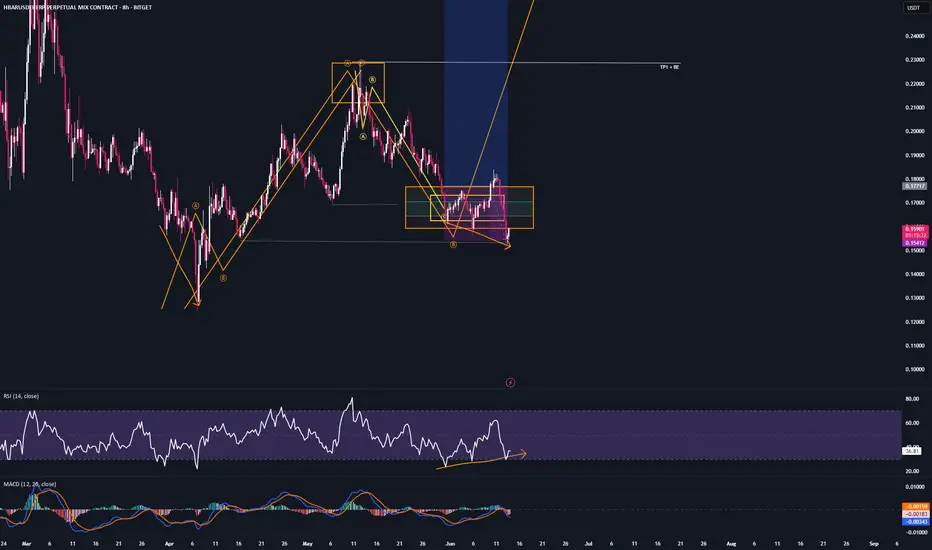
HBAR - TradeI got stopped out on HBAR,
but I’m still holding multiple long positions on other altcoins.
Most coins seem to be forming bottom structures.
HBAR just swept recent significant lows
and is now showing bullish divergence on the 8H and 20H timeframes — which is typically a strong sign of a bottom.
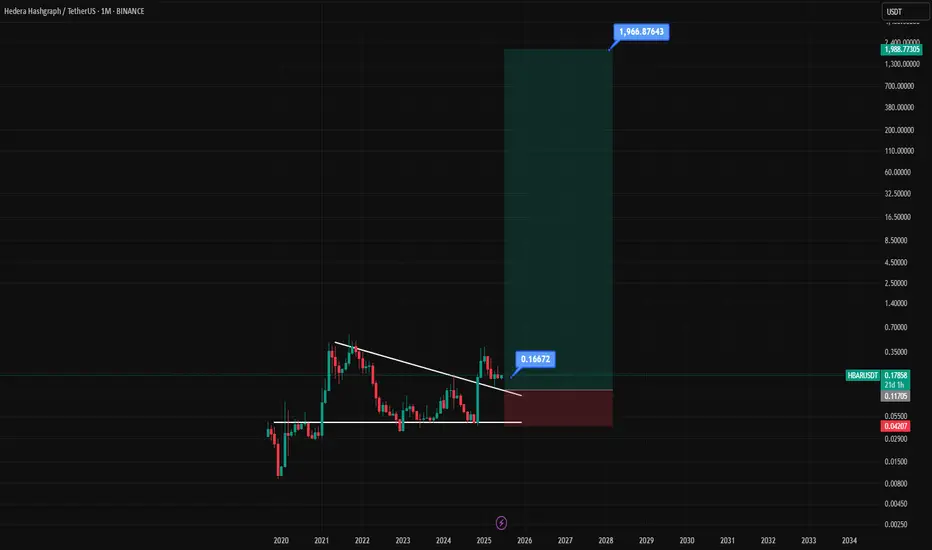
A Colossal Rally Scenario for HBAR to $1,966HBAR is the utility and security token of the Hedera network, a high-performance distributed ledger that aims to be a faster, fairer, and more secure alternative to traditional blockchains, specifically designed to meet the needs of mainstream and enterprise-level applications.
Chart Pattern Analysis
Major Pattern: Descending Triangle
The most significant pattern on this monthly chart is a large descending triangle that has been forming since late 2021.
The upper boundary is a descending trendline connecting the lower highs.
The lower boundary is a strong horizontal support line around the $0.042 level, which was tested and held multiple times throughout 2023.
Bullish Breakout and Retest
In early 2025 (according to the chart's timeline), the price has decisively broken out of the top of this descending triangle. A breakout from such a long-term consolidation pattern is typically a very strong bullish signal.
Following the breakout, the price seems to be performing a retest. It has come back down to touch the former resistance trendline, which is now acting as new support. This is a classic technical move that confirms the strength of the breakout.
Candlestick Analysis
The breakout candle is a strong, full-bodied green candle, indicating significant buying pressure and conviction behind the move.
The most recent candles are consolidating above the breakout level, holding the new support. This suggests that buyers are absorbing any selling pressure and preparing for the next move higher.
Price Prediction
Based on this technical setup, the outlook for HBAR is bullish.
Short-Term to Medium-Term: After successfully holding the retest of the broken trendline, the price is poised to continue its upward trend. The first major target would be the previous all-time high from 2021 (around $0.57).
Long-Term Projection: The analyst who created the chart has plotted a very ambitious long-term target at $1,966.87643. This is likely a calculated "measured move" of the triangle pattern, projected upwards from the breakout point. While the pattern itself is very bullish, this specific target is extremely optimistic and would represent a massive, multi-year bull run.
Summary
The chart suggests that HBAR has completed a long bearish/consolidation phase and has begun a new major uptrend. The breakout from the multi-year descending triangle, confirmed by a successful retest, is a powerful signal for future price appreciation.
The price is expected to go up. The immediate trajectory is likely continued upward movement, with key historical resistance levels as initial targets. The extremely high long-term target should be viewed as a highly speculative, best-case scenario.
Key Levels to Watch:
Support: The descending trendline (currently around 0.12−0.15) and the horizontal support at $0.11705.
Invalidation Point: A decisive drop back below the major support level at $0.04207 would invalidate this bullish thesis.
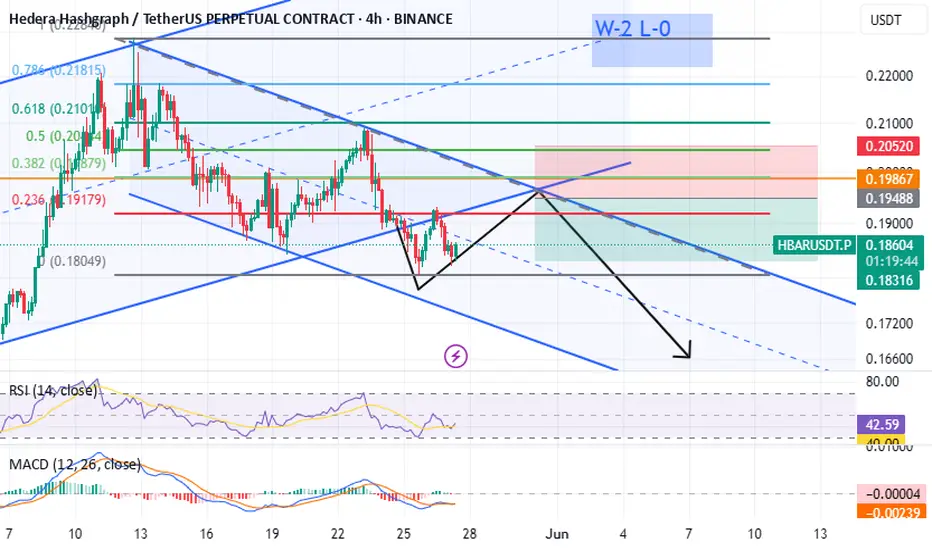
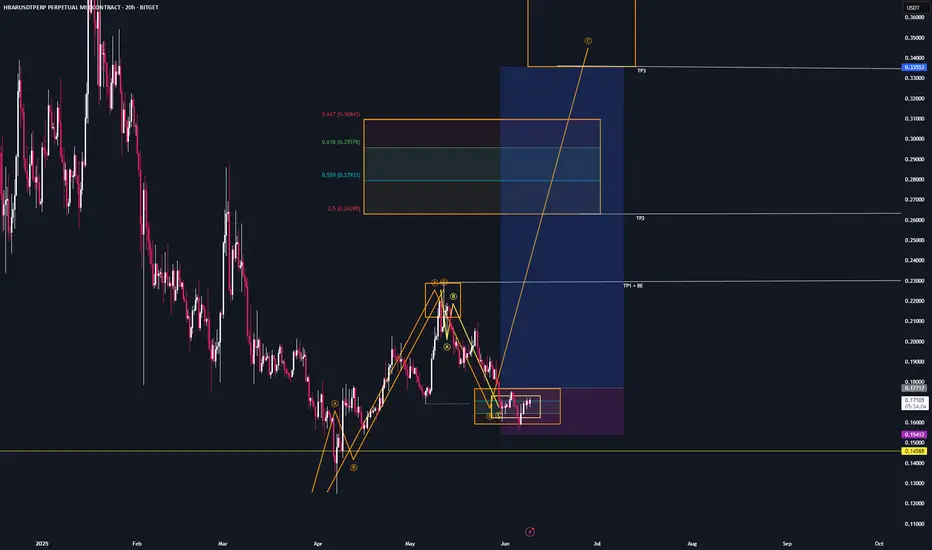
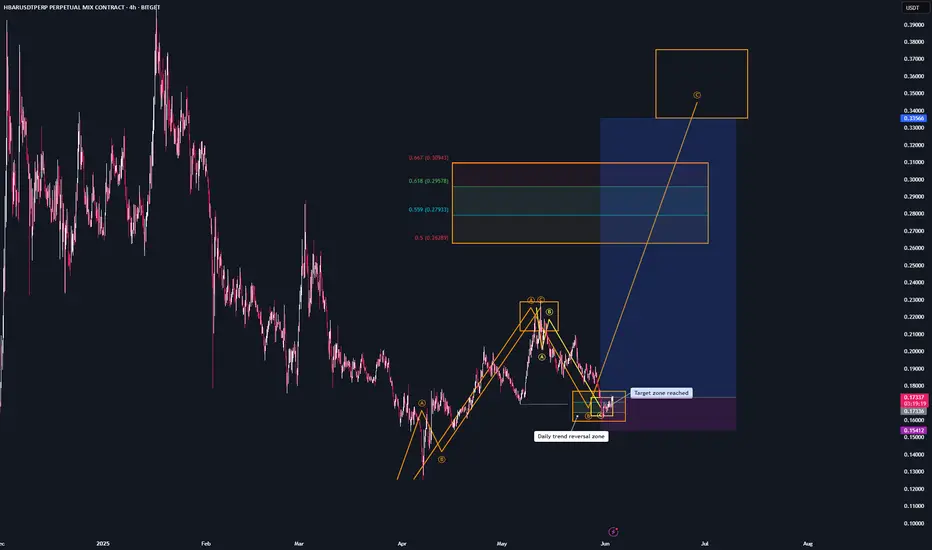
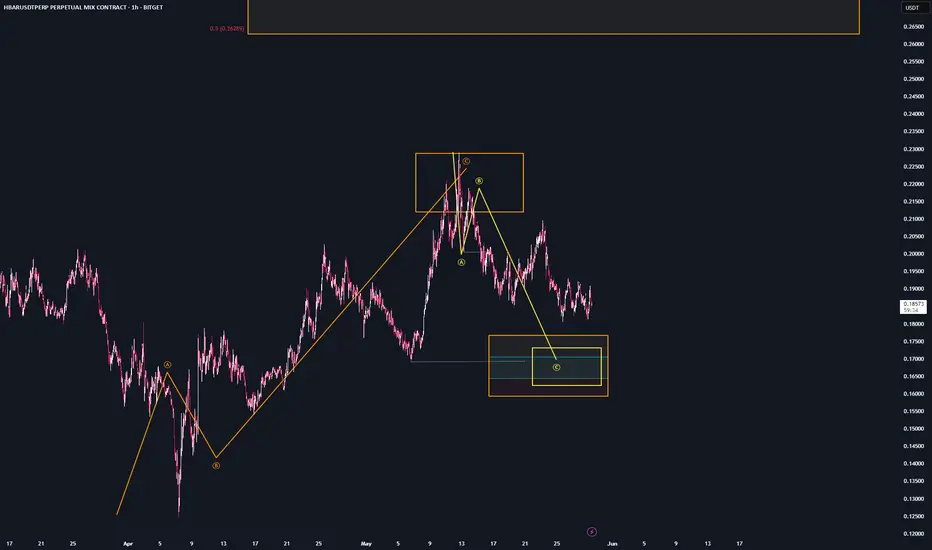
HBAR - setupWe’re still within the bullish trend reversal zone and the bearish target area.
If you’re not positioned long yet, this CRYPTOCAP:HBAR setup is worth considering.
I’m long on this one.
Tp1 + BE : at $0.22 — recent highs
Tp2: at $0.26 — trend reversal area
Tp3: at $0.333— target region
If you have any questions about my system or trade logic, drop them below — I read every comment 👇
HBAR needs to set a foundation and a CHOCH would be greatHBAR fell through a large volume gap. Momentum remains in a downtrend, and the structure is not yet mature. A proper CHOCH would make things bullish, especially in oversold conditions.
Full TA: Link in the BIO
Short time Frame Hbar, NFA just one of the potentials I see Just a quick look at the shorter time frame working hopefully into the next leg up.
Hope to see one more downside movement that will get eaten up good at around the prices mentioned and then maybe we can finally trend up after this 7-9 month correction depending if we end in June or August haha
Always prepared for the worst, but embracing the positives that are given!
As always take with a grain of salt things can change quickly.
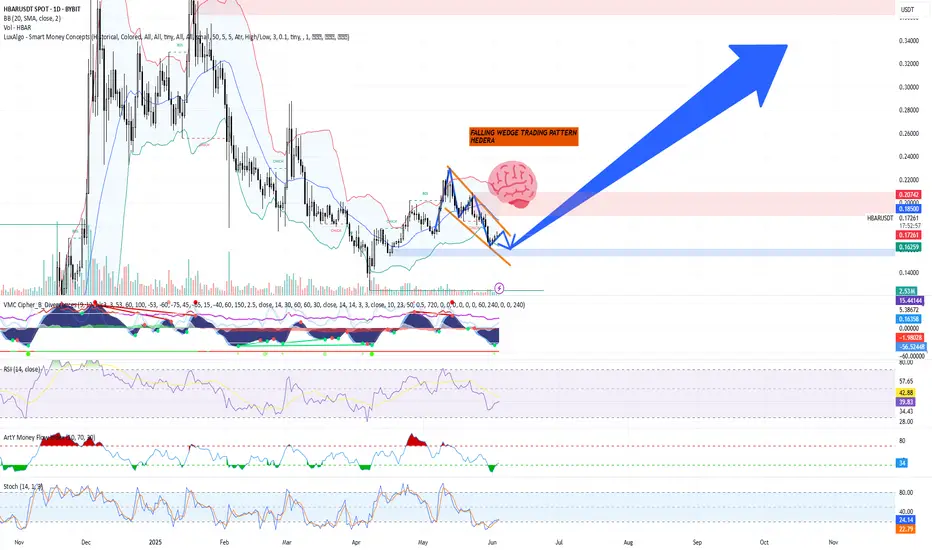
Technical Analysis – HBAR/USDT + TRADE PLANTechnical Analysis – HBAR/USDT (Daily Chart as of June 4, 2025)
Chart Pattern: Falling Wedge (Bullish)
The chart indicates a classic falling wedge pattern, often interpreted as a bullish reversal signal.
This pattern is marked by descending converging trendlines, suggesting declining volatility and potential breakout.
Breakout point is illustrated just above the wedge’s resistance line, with a bullish breakout expected.
Key Support & Resistance Levels
Immediate Support Zone: $0.1625 – $0.1723 (blue zone)
Primary Resistance Targets:
Short-term: $0.1849 (top of Bollinger Band)
Mid-term: $0.2070 – $0.2200
Long-term: $0.3400 (strong historical resistance)
Indicators Summary
Bollinger Bands: Price near the lower band, indicating potential upside volatility.
Volume Profile: Slightly increasing near wedge apex, often a precursor to a breakout.
VMC Cipher_B: Multiple green dots signal bullish divergence; momentum may be reversing upward.
RSI (14): Currently recovering from oversold territory (~39.5), suggesting bullish momentum building.
Money Flow Index (ArTy): Moving back into the green, indicating capital inflow and potential accumulation.
Stochastic RSI: Crossed upward from oversold zone (currently ~23), a common signal for trend reversal.
Trading Plan
Long Position Setup (Swing Trade)
Entry Zone:
$0.1650 – $0.1725 (upon retest of breakout from wedge or candle close above wedge resistance)
Stop-Loss:
$0.1580 (below wedge support and key structure low)
Take-Profit Targets:
TP1: $0.1850 (Bollinger Band and resistance zone)
TP2: $0.2070 (resistance from March 2025)
TP3: $0.2200 – $0.2400 (target zone for full wedge breakout)
TP4: $0.3400 (macro-level resistance, if rally continues)
Risk-to-Reward:
Minimum R:R of 1:2.5 to 1:5 depending on TP level.
⚠️ Risk Management & Strategy Notes
Wait for confirmation breakout candle with strong volume above wedge resistance before entering.
Scale in gradually between $0.1650–$0.1725 if confirmed.
Trail stop-loss after reaching TP1 to lock in profits.
Monitor Bitcoin price trend and overall market sentiment—HBAR tends to follow macro market structure.
The combination of the falling wedge, bullish divergence, and oversold momentum indicators supports a strong potential for bullish continuation. However, conservative confirmation is essential before committing capital.
Outlook: Bullish bias, pending confirmation breakout above the wedge resistance.
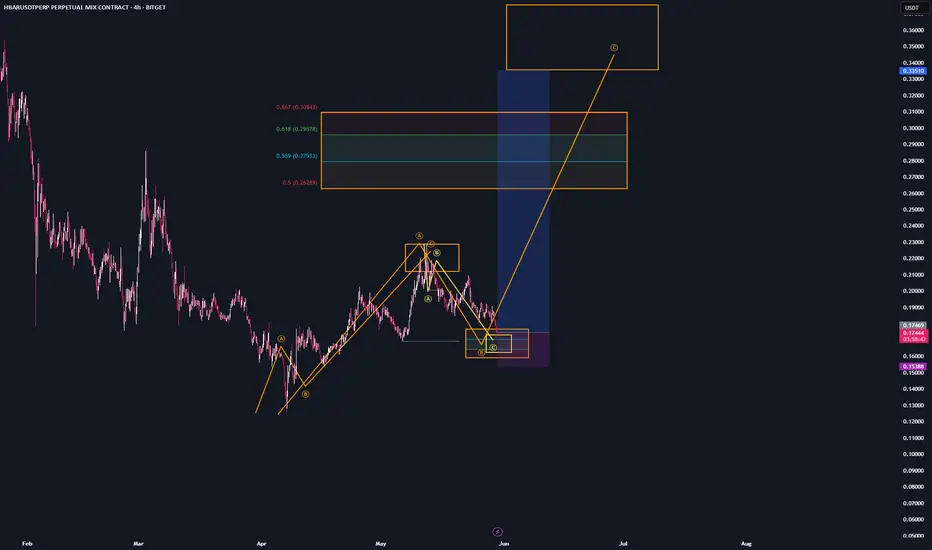
HBAR - TradeMy orders on CRYPTOCAP:HBAR got filled.
I’m riding the next wave up with consistent profit-taking — at the highs, the major trend reversal zone, and eventually the target regions of the new formed structure.
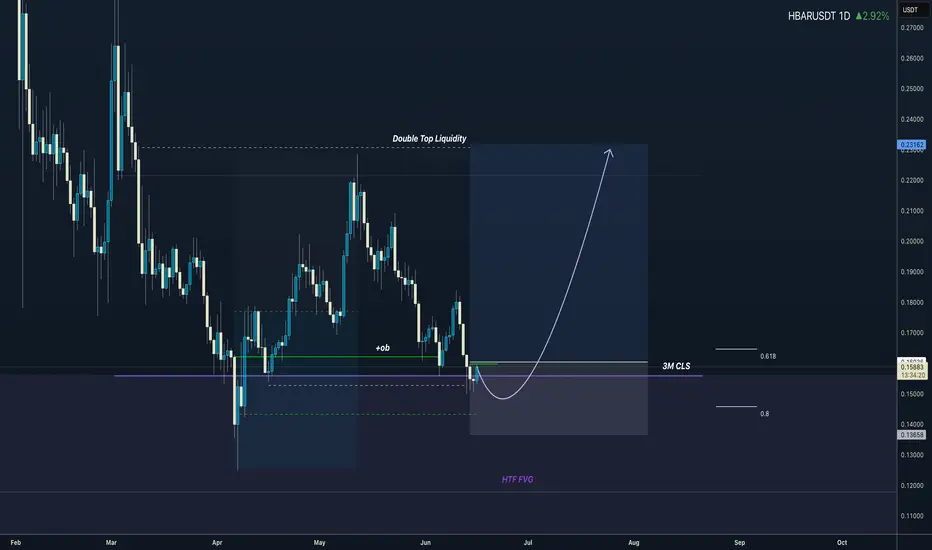
HBAR SetupWe finally hit your entry region on HBAR.
It’s very likely that we’ll see a U-turn from this area.
Of course, there might still be some choppy days before the reversal kicks in.
I'm opening a new swing position here and now, which I’ll hold until we reach the target zones.
Hbar setupWe’re currently trading just above the bullish trend reversal zone and the bearish target region.
If we drop into these areas, I’ll open additional long positions on HBAR and scale up my larger long swing position as well.
HEDERAset up LONG 1:1 quick
Disclaimer on Money Management for Trading in the Futures MarketFutures trading carries high risks and may result in the loss of your entire capital. Only use funds you can afford to lose, set risk limits, and understand the market and leverage. Diversification does not guarantee profits. Consult a financial advisor before trading. All decisions and losses are your sole responsibility.

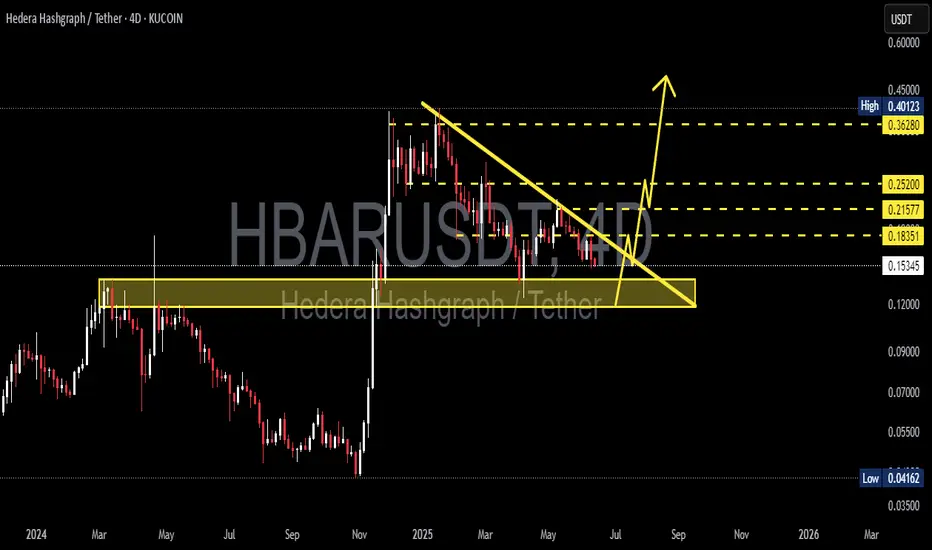
HBAR Massive Wedge PatternHBAR created massive clear wedge pattern
we must break upper trendline to go up and potentialy to 0.23
But if we break support line this is will be invalidate

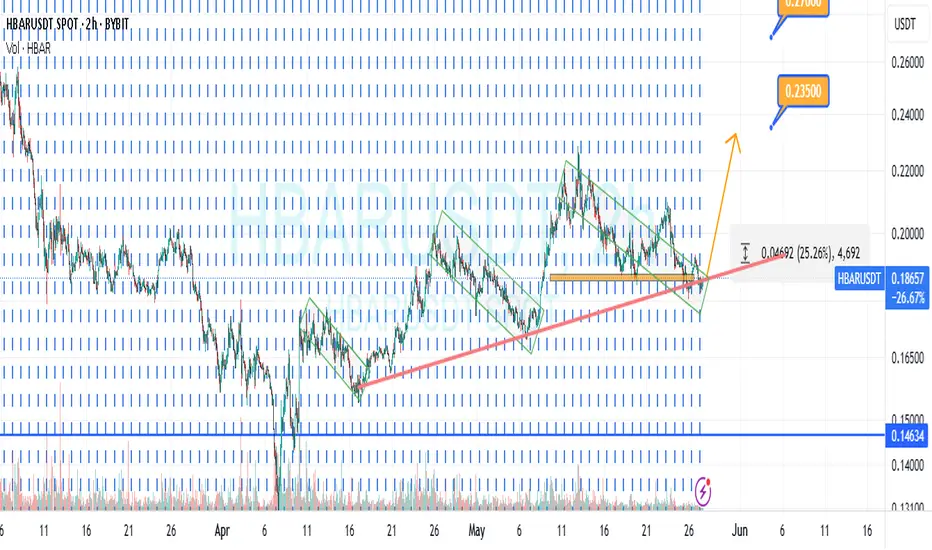
HBARUSDT in a falling wedgeHi traders,
Today, we are analysing HBAR on a weekly timeframe.
The price remains under the downsloping resistance line.
The price also formed a falling wedge pattern.
Enter long position once the breakout occurs.
The target is shown on the chart.
Good luck

HBAR Short Wait for Good EntryLike & Follow me for more details
HBAR Short,
BTC will break upward trend soon.
Will reach 103k