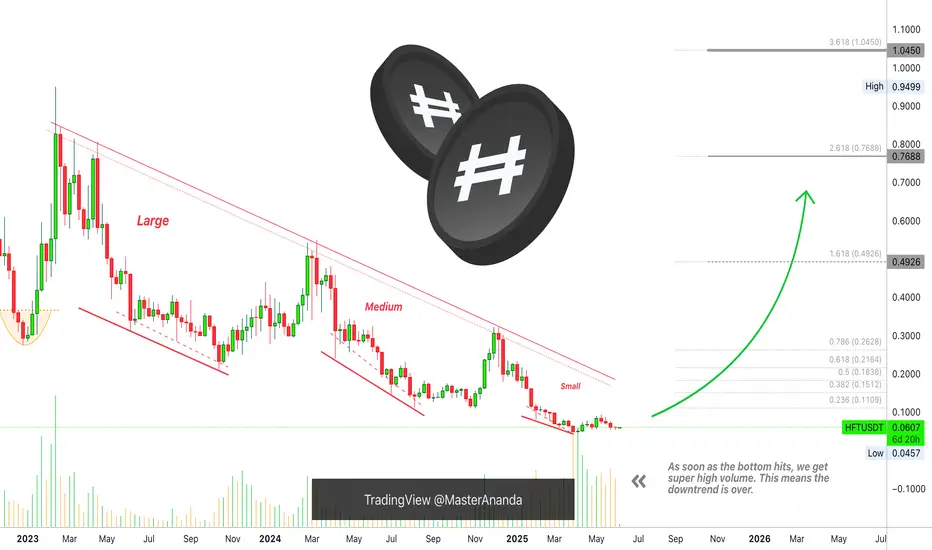
Hashflow Hits Bottom... Notice The Waves... The Large Bull RunNotice the waves... It all starts in January 2023 with a strong advance. 243% total growth. Mid-February 2023 we have a price peak and this signals the start of a bearish trend. Notice the waves...
It all starts with a large wave. As the downtrend unravels, the waves become smaller. Then we have a
Phemex Analysis #93: Is it Time to Enter Hashflow (HFT)?Hashflow ( PHEMEX:HFTUSDT.P ) is a decentralized trading protocol designed to facilitate seamless, secure cross-chain asset swaps with zero slippage and protection against MEV (Maximal Extractable Value) exploits. Unlike traditional decentralized exchanges, Hashflow enables users to trade across v
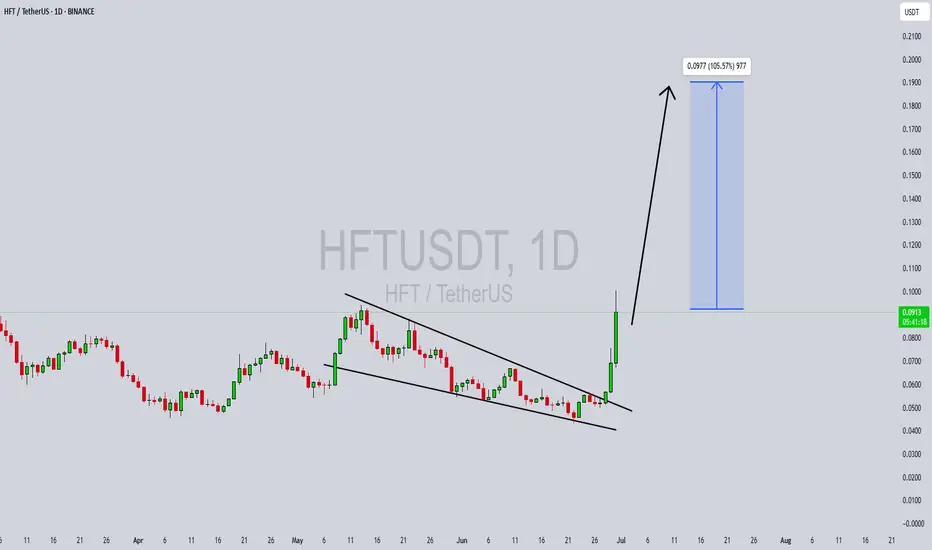
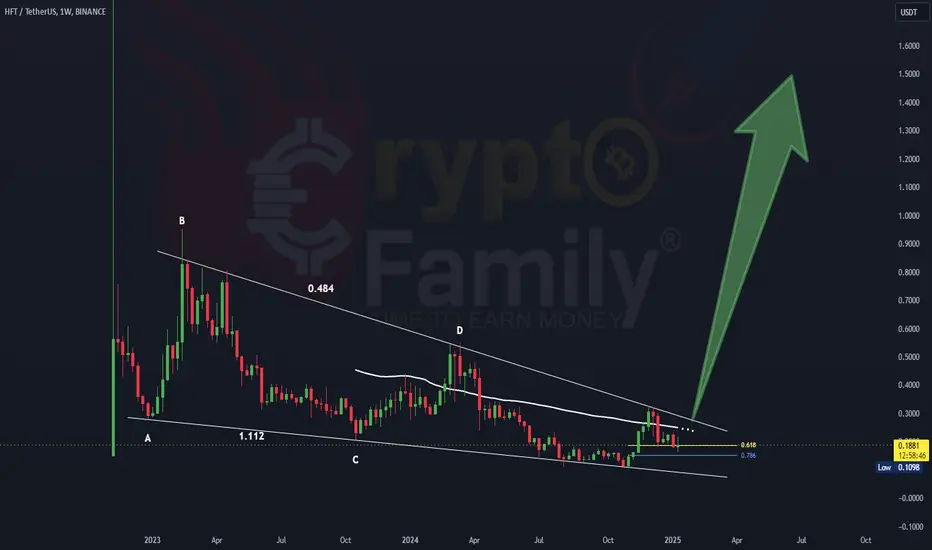
HFTUSDT Forming Falling WedgeHFTUSDT is currently displaying a textbook Falling Wedge Pattern, a classic signal that often points to an upcoming bullish reversal. This pattern is one of the most reliable in technical analysis, as it indicates that sellers are gradually losing momentum and buyers could soon step in to push price
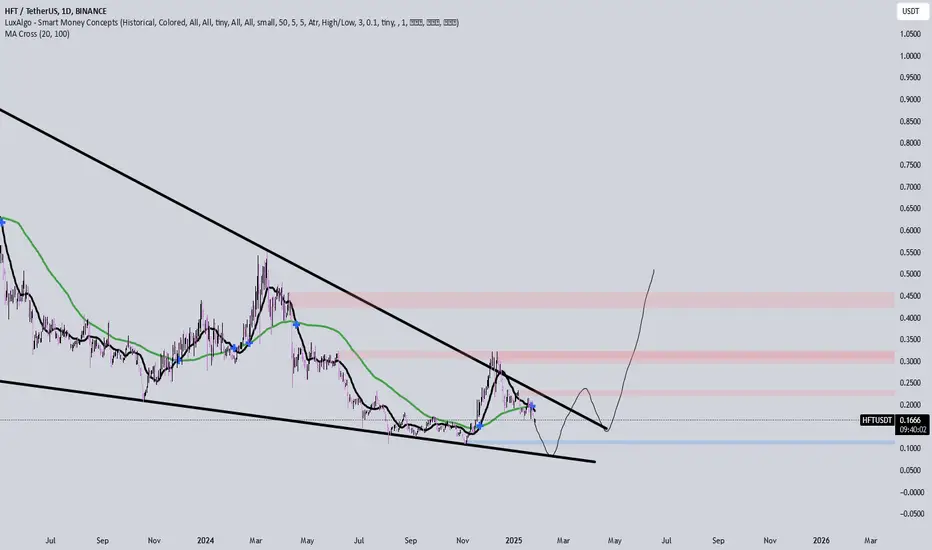
HFTUSDT 1D AnalysisHFT ~ 1D Analysis
#HFT Buy after successfully breaking through this resistance line if you still have confidence in this coin with a short-term target of at least 10%+.
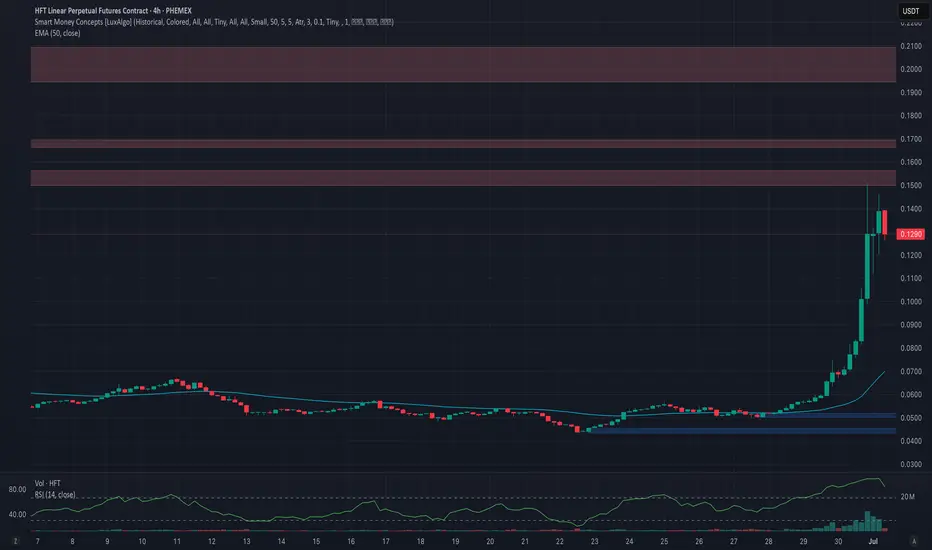
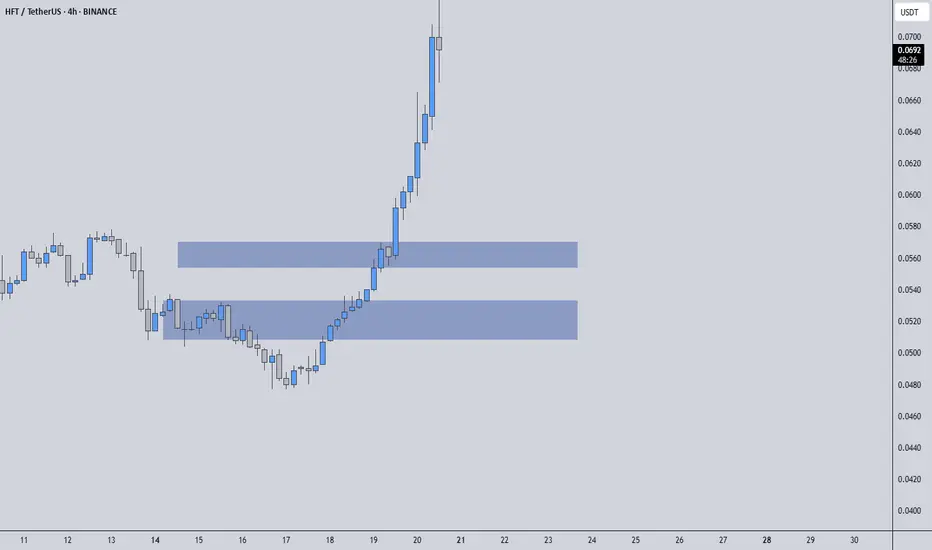
HFTUSDT | One of Today’s Top Volume Gainers – +380% in 24hHFTUSDT has exploded in volume today, surging nearly 380% as smart money piled in. When you spot a move like this, it demands attention—but winning traders wait for structure, not hype.
🔵 Why the Blue Boxes Matter
Key Support Zones: The blue boxes mark areas where buyers have historically stepped i
HFT 1W chartTSX:HFT 1W linear chart
I’m still holding my bag and I really like this Falling Wedge
Expecting a huge breakout soon
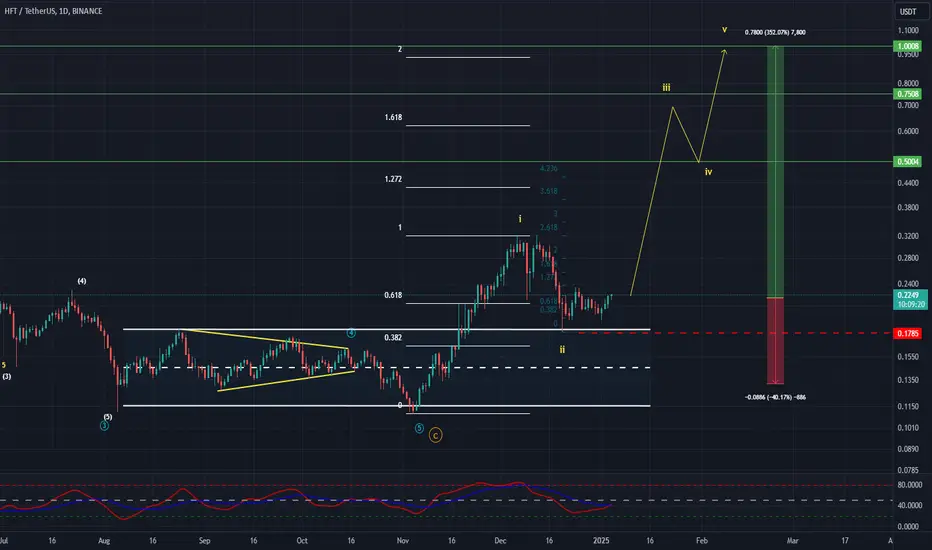
HFTUSDT Elliott Waves AnalysisHello friends.
Please support my work by clicking the LIKE button👍(If you liked).
Everything on the chart.
Entry zone: market and lower
Targets: 0.4 - 0.65 - 0.95
after first target reached move ur stop to breakeven
Stop: ~0.13 (depending of ur risk).
RR: 1 to 9
ALWAYS follow ur RM
risk is justifie
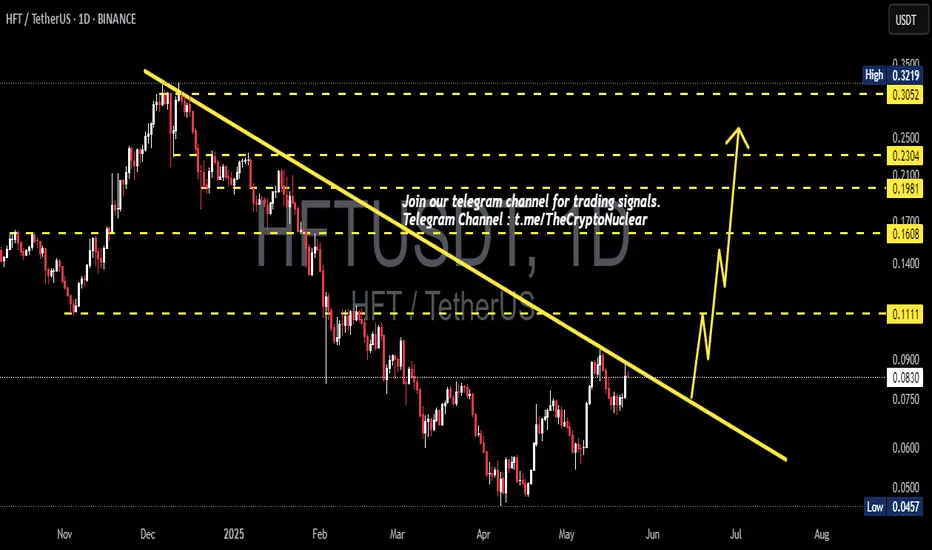
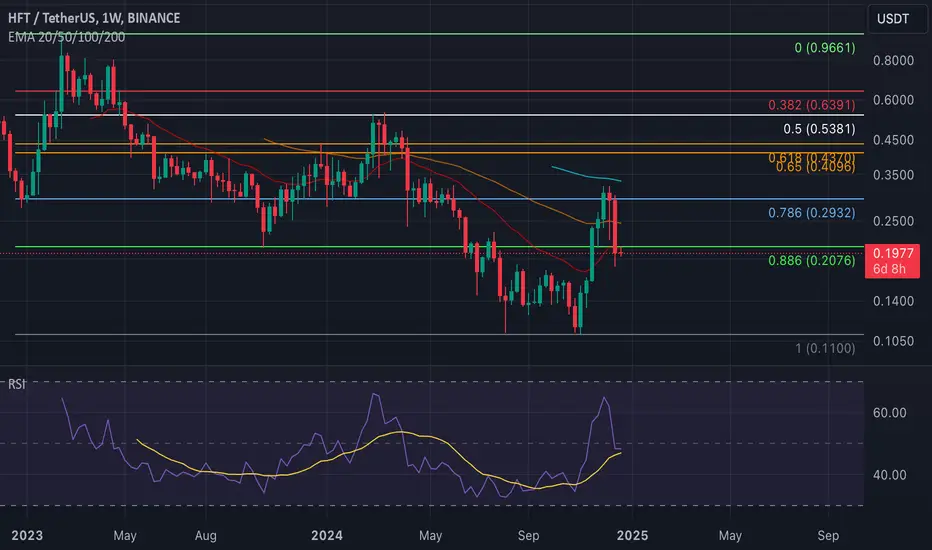
23.12.2024: HFT/USDT – Bullish Setup coming or More Down!?📉🚀 Bullish or Bearish on HFT/USDT? Let’s break it down!
Key Levels:
🔼 Resistance:
$0.30–$0.40: Tough resistance zone and below key EMAs. Breaking this could start a strong move up.
🔽 Support:
$0.195: Critical support right now. Losing this could send us back to $0.10–$0.15 (ouch!).
What’s Happeni
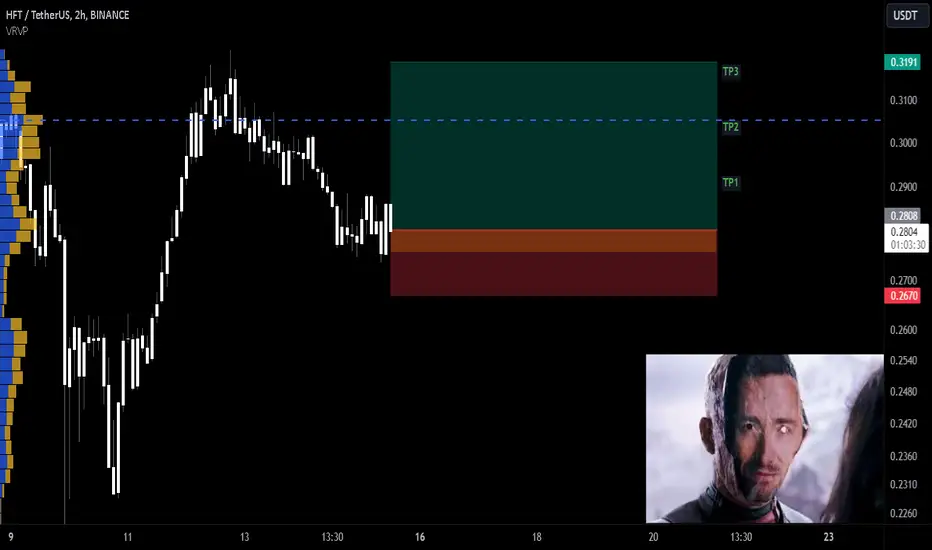
HFTUSDT Long Setup / 2x-3x LeverageBINANCE:HFTUSDT
📈Which side you pick?
Bull or Bear
Low-risk status: 3x-4x Leverage
Mid-risk status: 5x-8x Leverage
(For beginners, I suggest low risk status)
👾Note: The setup is active but expect the uncertain phase as well. also movement lines drawn to predict future price react
See all ideas
Summarizing what the indicators are suggesting.
Oscillators
Neutral
SellBuy
Strong sellStrong buy
Strong sellSellNeutralBuyStrong buy
Oscillators
Neutral
SellBuy
Strong sellStrong buy
Strong sellSellNeutralBuyStrong buy
Summary
Neutral
SellBuy
Strong sellStrong buy
Strong sellSellNeutralBuyStrong buy
Summary
Neutral
SellBuy
Strong sellStrong buy
Strong sellSellNeutralBuyStrong buy
Summary
Neutral
SellBuy
Strong sellStrong buy
Strong sellSellNeutralBuyStrong buy
Moving Averages
Neutral
SellBuy
Strong sellStrong buy
Strong sellSellNeutralBuyStrong buy
Moving Averages
Neutral
SellBuy
Strong sellStrong buy
Strong sellSellNeutralBuyStrong buy
Displays a symbol's price movements over previous years to identify recurring trends.