#GOLD #XAUUSD Seems to have ended the correction FX_IDC:XAUUSD Gold Spot might have completed the correction as a complex 3-3-5 FLAT, and is currently turning higher in wave (ii), however this get invalidated if THE LAST LOW OF 3268.19 BREAKS. Till the pivot 3268.19 stays strong, the move should be impulsive and take us to new high near term.
GDU1! trade ideas

BULLISH ON GOLDLet's take a look at some key things happening with gold and why I decided to go long. The first and most convincing factor for me is the market structure shift after taking sell-side liquidity, followed by strong displacement to the upside. We also have equal highs. Additionally, there’s a 4-hour breaker, and if you look at DXY, it has broken down after running ITS buy-side liquidity. Bonds (ZBU2025) are also showing strength. Gold is still in a range market, and right now we are at the range lows. So, even if you're not bullish on gold, it doesn’t make sense to short. I also wouldn’t feel comfortable shorting because of the equal highs above.
INVALIDATION IS RECENT 4HR LOW.

Gold Futures Super Strong Resistance - Price Coming Back StrongGold Future has been very strongly pushing up without filling any gapes in the short side before pushing up more further.
One unique line is probably the target super strong resistance.
In a daily chart, probably better wait until it reaches that point to try to check for strong short entries maybe.
Still arriving there it would explode up even more further to transform that line into a super strong probable support.
Keep watching!
(Do we actually have to believe that gold is secretly targeting $10,000) in the Yearly Chart?... Since February 2022 it just went berserk!)

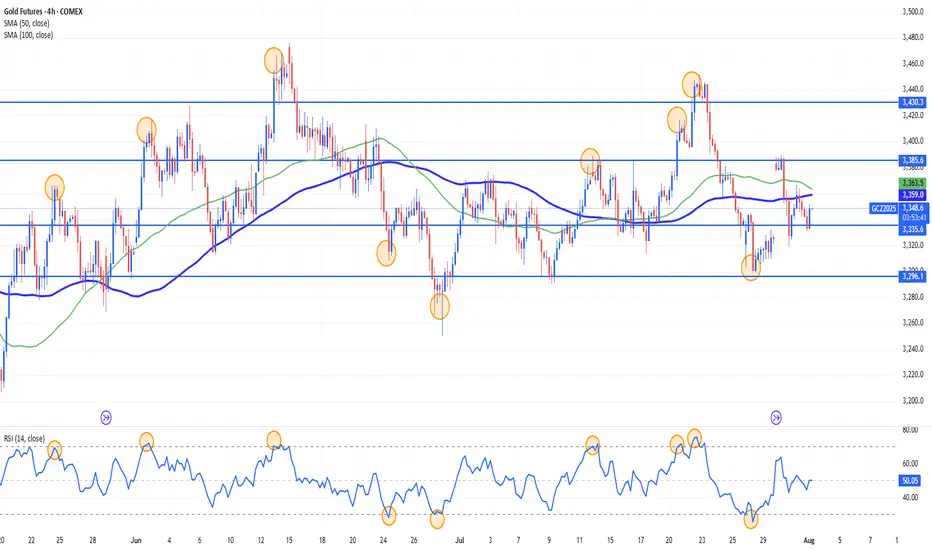
Gold Range-Bound and Ripe for Mean Reversion Plays?Gold has been locked in a sideways, range-bound regime for months, largely oscillating between the 3400 and 3160 levels. This lack of clear directional trend stems from conflicting fundamental forces: on one hand, sticky inflation and resilient U.S. data have bolstered the U.S. dollar and yields, weighing on gold. On the other, global growth concerns and geopolitical tensions continue to underpin demand for the metal as a safe haven. The push and pull of these opposing themes has created an environment of indecision and choppy price action.
While long-term investors may find this frustrating, range traders and mean reversion strategies are thriving. With technical boundaries so well-defined, short-term oscillations within the range are offering repeated opportunities for disciplined entry and exit.
Currently, XAUUSD is trading just under the 3296 level after a recent rejection from the 3350s. The bearish structure suggests a potential leg down toward the 3160–3180 support zone. However, absent any major economic surprises or geopolitical shocks, this could merely be another deviation from the mean rather than a true breakdown. Indicators like RSI and Stochastic Oscillator are already hinting at early signs of bullish divergence.
If price holds above or near 3160, the setup for another mean-reversion trade back toward the mid-range (around 3296 or higher) could unfold. In the current environment, fading extremes rather than chasing trends remains a strategy of edge, as depicted by the 14 period RSI.
Gold’s Compression Coil Looks Ready to DetonateMGC continues to reject the 50% Fibonacci retracement level from the $3,386.5 swing high, currently trading at $3,347.3. Price has now spent multiple candles trapped under this level, unable to reclaim $3,355, with clear upper wicks and no bullish follow-through.
This is classic midday NY session compression, often setting up a late-day directional move. All signs currently point to continuation lower toward $3,306.2, completing a textbook measured move.
Staakd Probability Model
Based on historical setups where MGC pulls back to 50% and stalls mid-NY:
Scenario Probability
- Continuation down to $3,306.2 68% High-probability path if $3,347 breaks
- Sweep to $3,355–$3,360 before drop. 26%. Possible liquidity grab
- Break and hold above $3,360 6% Invalidation of the short idea
Key Levels
Level
- 100% Fib High $3,386.5 - Swing high
- Supply Zone $3,347–$3,355 - Rejection area + equilibrium zone
- Current Price $3,347.3 - Compression below fib midpoint
- Target Zone $3,306.2 - Measured move / demand structure
- Invalidation $3,360.0+ - Break above this invalidates the short
Trade Idea (Pending Trigger)
- Bias: Bearish
- Entry Zone: $3,345–$3,350
- Target: $3,306.2
- Invalidation: Above $3,360
- Reward-to-Risk: 2.2R–2.5R depending on entry execution
This is shaping into a high-probability continuation setup. NY session has done the heavy lifting: a weak bounce, heavy rejections, and no reclaim of structure. Unless we see a sudden reclaim of $3,355 or a spike in late NY volume, this looks ready to break and expand lower. Keep it simple. Trust the structure. Let price walk itself to the target.

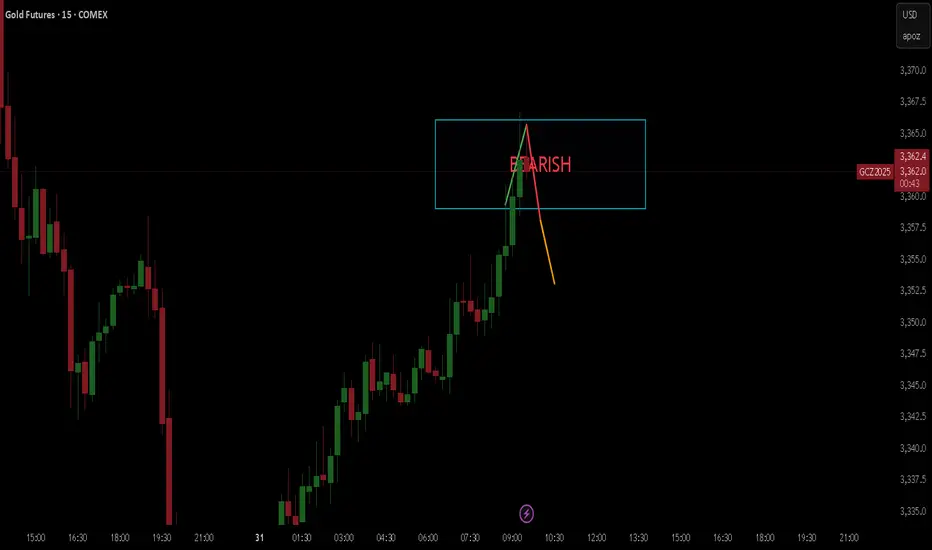
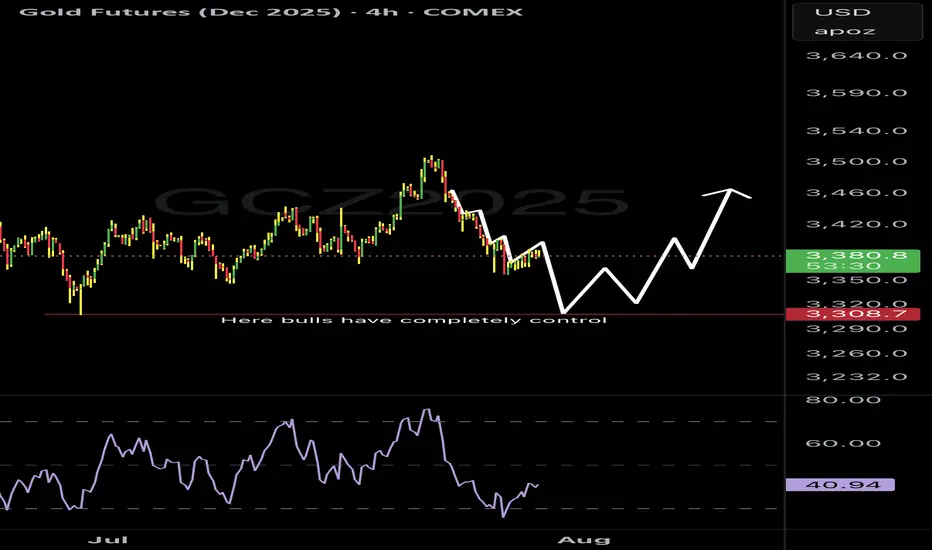
GOLD BEARISHHello,
I hope you are well.
I have an excellent opportunity for you on gold.
I see a 90% chance that gold will start to fall, so get your strategies and money management ready!

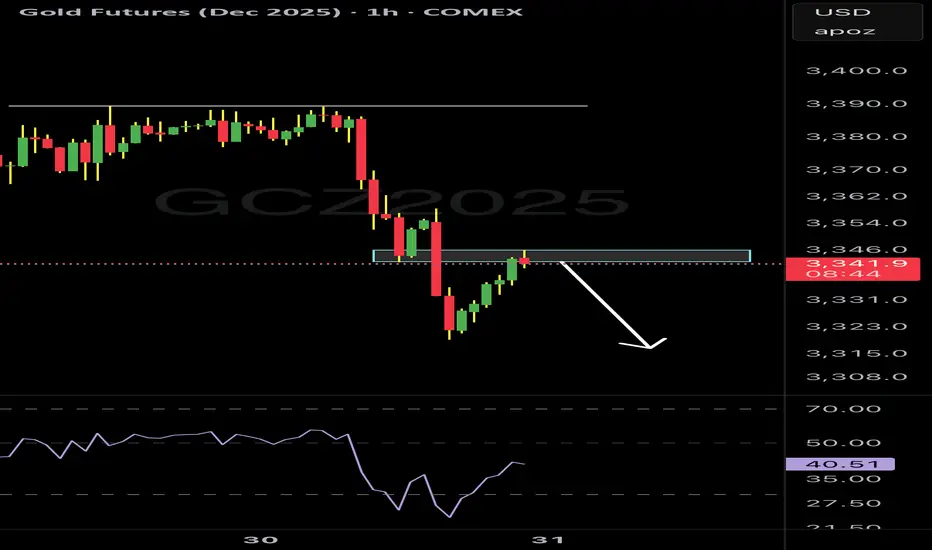
Gold rinse and repeatSimple, more shorts on gold as it looks like a rinse and repeat from previous sessions price action
WE GOT THE SWEEP ON GOLD!!!!THIS is the move I was waiting for! we got the full sweep on levels. looking for price to flip back to bullish pressure from here. Now we just wait for the entry to show as we move into the Asian Killzone.

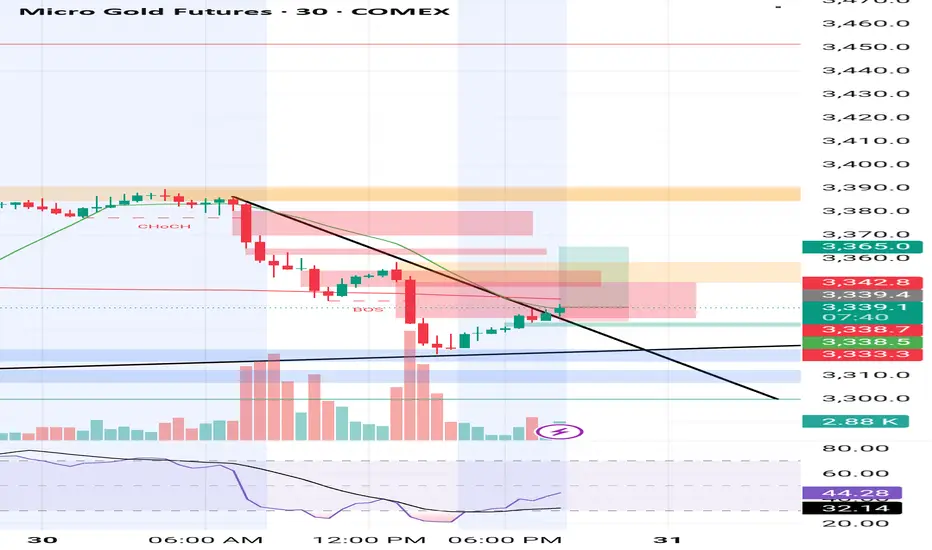
MGC Bear Flag or Dead Cat Bounce? Tokyo’s About to DecideClean structure forming on MGC after a heavy impulse sell during NY session. We’re now consolidating below VWAP in what looks like a textbook bear flag or descending wedge.
We had a sharp breakdown from the highs with no real attempt to reclaim the structure. Price is now compressing underneath the 9/21 EMAs and VWAP clear bear pressure. Volume POC from this range is sitting around 3,332.7, and price can’t even sniff it. Fibonacci 50% retrace off the sell leg aligns with POC stacked resistance.
Entry marked at 3,318.4, targeting a breakdown into 3,268.4 roughly the measured move from the flag.
Quant Confluence:
- Under VWAP
- Below 9 & 21 EMA
- Fib 50% rejection
- Bear flag structure
- POC rejection zone
If I'm Wrong:
If price closes above 3,332.7 (POC) or breaks and holds above VWAP, the bear thesis weakens significantly. Flip long only on a full structure reclaim.

GC1! – The Wedge Strikes BackGC1! – The Wedge Strikes Back 🚀
Gold futures (GC1!) just gave us a textbook rollover move. As the front-month rolled, price faked a wedge breakdown, only to rip back inside the structure once rollover completed. That failed breakout speaks volumes – and now the wedge is back in control.
Rollover Trap → Back Inside the Wedge
Rollover volatility flushed price below the wedge, pulling in shorts… but the move didn’t stick. Buyers stepped up and snapped price back inside, turning the wedge’s lower boundary into rock-solid support once again.
The Long Game 🎯
With GC1! holding the wedge:
Longs off wedge support are the play
Resistance: 3,380
Target: 3,446 (upper wedge boundary)
Stop-loss: 3,336 (below support)
Risk/Reward: 🔥 10.69 RRR
Volume Profile also shows heavy accumulation in the 3,336–3,380 zone – crack through 3,380, and we could see momentum accelerate quickly.
Bottom Line
This isn’t just another bounce – it’s a failed breakdown on rollover. Wedge traders are back in the driver’s seat, and the setup offers a crystal-clear invalidation point with serious upside potential.

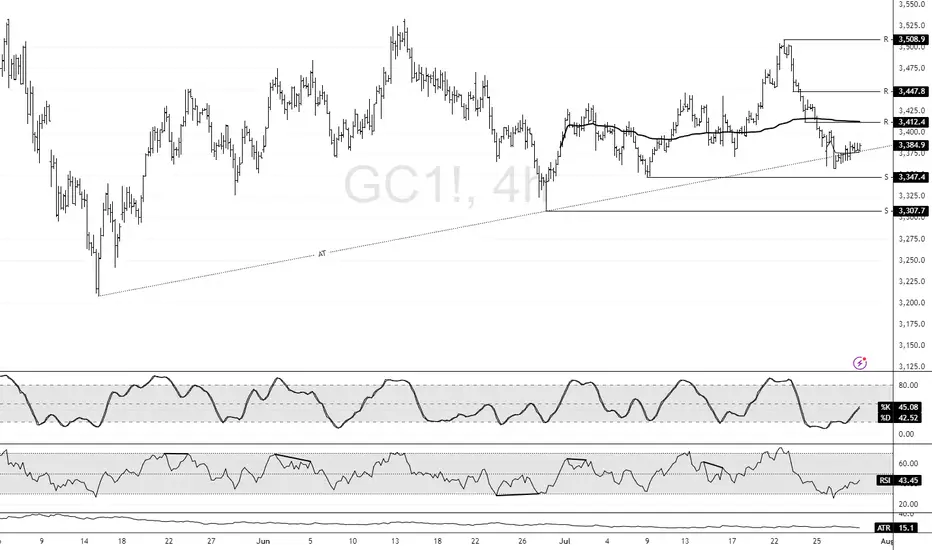
Gold Holds Trendline Amid Rising MomentumFenzoFx—Gold remains above the ascending trendline, trading around $3,386.0. Technical indicators like RSI 14 and Stochastic show rising momentum, reinforcing the bullish bias.
Immediate support lies at $3,347.0. If this holds, XAU/USD may climb toward the monthly VWAP at $3,412.0.
The bullish outlook is invalidated if Gold closes below $3,347.0, which opens the door for further downside toward the next support at $3,307.7.
Gold loading up on buys but first, more drops!Gold is in a place where many are loading up on buys and I understand why. Gold has been taking some significant drops since pushing all time highs but check my charts and reason with me.
In the large timeframes gold still has some movement down to complete the cycle before going back for all time highs again.
Additionally it’s holding the $3388 resistance level (futures price) pretty strong on the 15 minute chart. It’s gonna be an interesting week for gold to say the least.
Gold Contract Rolled!Now that the contract rolled We might get a bit more movement. Yesterday was nothing but a giant flag. I want to see price go sweep levels before turning full on bullish. We must keep in mind that we are at the end of the month as well. so price can end up stalling till next week. but tomorrow there is a lot of News pending. So that can really shake things up.

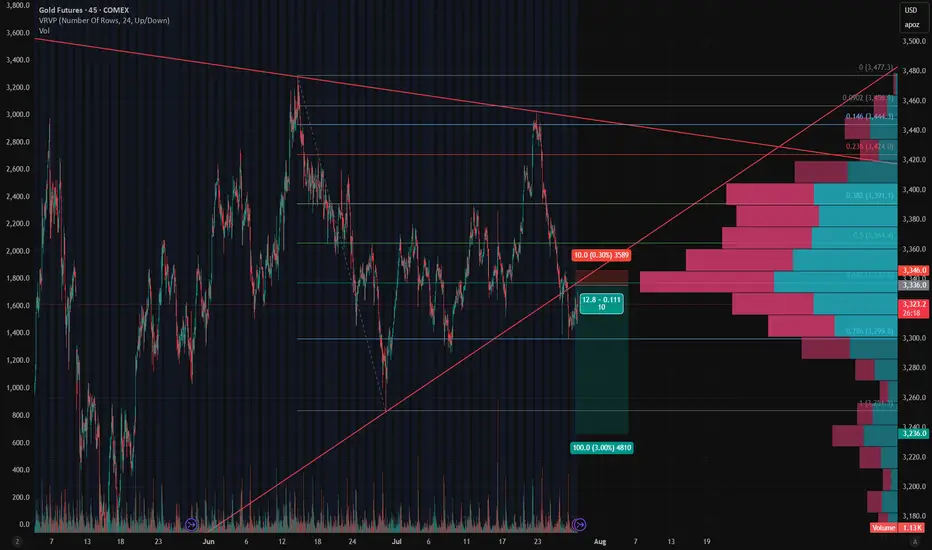
Gold - Short Setup Off Major Trendline Rejection📉 Gold - Short Setup Off Major Trendline Rejection
Gold has broken down through the rising trendline and is now retesting it — the moment of truth! 🧐
🔻 Short Entry: 3,336
🎯 Target: 3,236 (Fib 1.0 + HVN gap fill)
🛑 Stop: 3,346 (Above trendline retest)
⚖️ Risk/Reward: ~1:10
📊 Bonus: High volume node above adds resistance. Bearish volume profile structure confirms the breakdown bias.
Watching for volume to pick up on the move down. Let's see if GC bleeds into August. 🩸📆
Gold’s in the Chop Shop. Tokyo’s Got the KeysGold has entered a key decision zone ahead of Tokyo. After a controlled retracement off the 3332 swing high, price has now compressed into a high-probability confluence pocket:
- 50% Fibonacci retracement (3316.3)
- VWAP acting as dynamic support (~3317)
- Trend line support holding from prior structure lows
- Compression below 3332.1 the breakout gate
If Tokyo volume engages, this could trigger a clean structural breakout into higher liquidity zones.
Primary Entry:
- Trigger: 15M or 1H candle close above 3332.1
- Entry Range: 3333.0 – 3334.5 on retest confirmation
- Stop Loss: 3312 (below trend line + VWAP)
Aggressive Entry (Mean Reversion):
- Bounce off VWAP/Fib zone (3316–3317.5) with bullish reaction
- Tighter SL: 3312–3314
- Lower R:R, but better pricing
Target Zones:
- TP1 3340 Minor resistance & round number
- TP2 3365 Prior breakdown zone / supply
- TP3 3390–3400 Extended Tokyo move + trend reversal territory
If I'm Wrong:
A breakdown below 3312 invalidates the bullish thesis. That would signal VWAP failure, trend line break, and potential reversion to 3300 or lower.
Technical Confluence Checklist:
- VWAP support holding - Complete
- 50% Fib bounce attempt - Complete
- EMAs compressing for potential crossover - Complete
- Clean trend line structure intact - Complete
- Low volume chop zone between 3312–3332 - Caution
Tokyo often fakes the initial move. Ideal trigger confirmation comes 30–60 mins after Tokyo open, once liquidity builds. Watch for manipulation wicks around VWAP before committing.
This is a classic quant compression setup, price is coiled into structure, and all major intraday tools align. If we see a clean move above 3332 with volume, the breakout could unfold fast. But lose VWAP and trend line, and the bias flips instantly.
Stay reactive, not predictive. Let price prove direction.

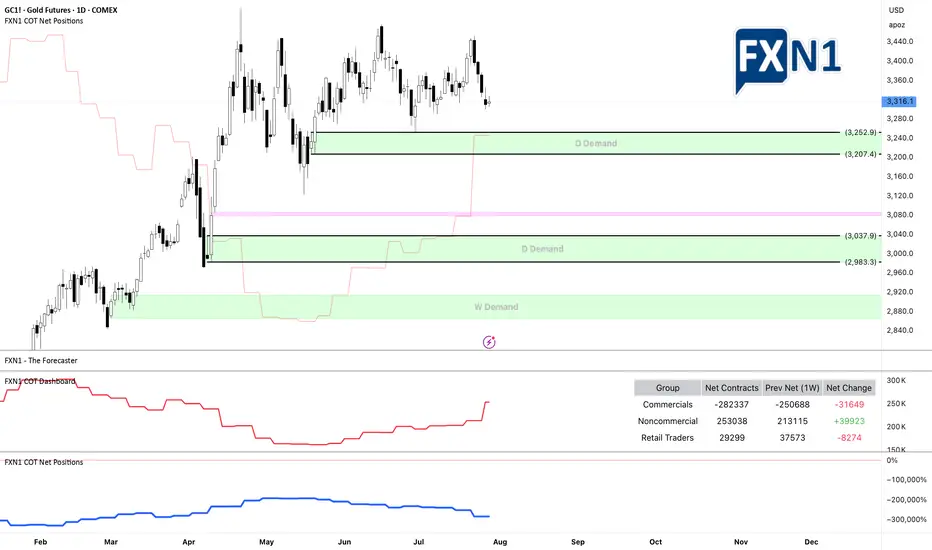
Gold Price Analysis (GC1! or XAU/USD): Challenges and OutlookSince reaching a historic high of $3,509 on April 22, 2025, gold has struggled to maintain its upward momentum. On the daily timeframe, the price experienced a sharp rejection spike after touching that peak, prompting a sideways range as the market seeks a clearer direction.
From a technical perspective, a stronger US dollar typically puts downward pressure on gold, making it a more expensive investment for holders. However, examining the chart of GC1! * alongside the DXY shows that even during periods of a robust dollar, gold has continued to rise. Additionally, recent years have seen seasonality effects on gold largely ignored, with the yellow metal persistently climbing. The underlying reasons are multifaceted, but a key factor is gold’s status as a safe-haven asset—investors prefer to hold gold during times of uncertainty and economic turmoil.
* GOLD and DXY correlation
Looking ahead, investors are awaiting the Federal Reserve’s upcoming monetary policy announcement scheduled for Wednesday. According to the CME FedWatch tool, the consensus is that the Fed will keep interest rates steady at 4.25%-4.50%, marking the fifth consecutive meeting with unchanged rates.
From both fundamental and technical viewpoints, recent data suggest a cautious outlook. Notably, non-commercial traders added nearly 40,000 long contracts last week, indicating bullish sentiment. Conversely, retail traders have reduced their positions, which could signal a potential shift in market dynamics.
The key question remains: where might be a strategic entry point if gold resumes its upward trend?
In the chart, I’ve highlighted two daily demand zones and a strong weekly demand area. There’s a possibility that the price may not revisit the weekly demand zone to accommodate new longs, instead triggering entry signals from one of the daily demand zones. I recommend adding these zones to your watchlist as potential entry points.
What are your thoughts? I look forward to your insights!
✅ Please share your thoughts about GC1! in the comments section below and HIT LIKE if you appreciate my analysis. Don't forget to FOLLOW ME; you will help us a lot with this small contribution.
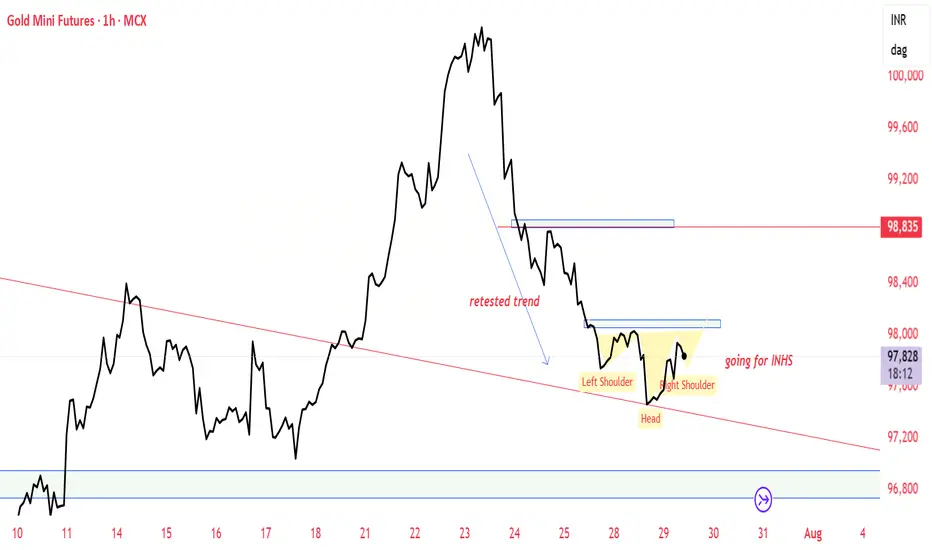
GOLD MCX BULLISH VIEWAfter 4 days continuous down side Some pullback relief expected till 99000. Tested trendline near support zone of 96900 and supply zone near 98200-98500-99000
Please do your own research before taking any trading decisions
Has gold Bottomed Out? Will the Bullishness continue from here?Looking for the bullish activity to continue from here but need to see a sweep and reject of the Previous daily Low before I want to get active. This would give confirmation that the price want to continue with this bullishness.


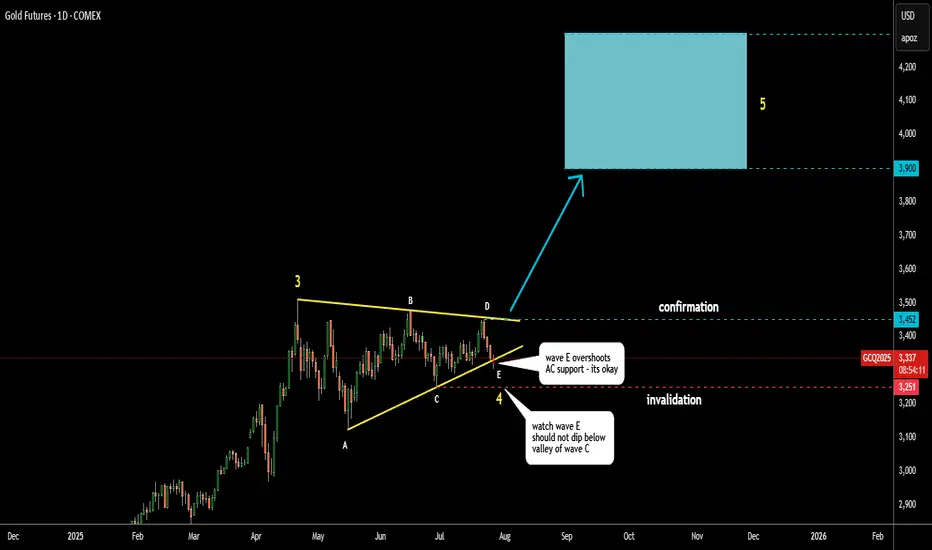
Gold Update 28 JULY 2025: On The EdgeGold is accurately following the path shown in my earlier post.
Wave D respects the triangle rules, staying below the top of wave B.
Wave E appears nearly complete, even piercing the A–C support line.
This is acceptable as long as wave E stays above the wave C low at $3,251.
Keep a close eye on this invalidation point.
The target range remains unchanged: $3,900–$4,300.
Gold: $3,348.0 Resistance in Focus for BullsFenzoFx—Gold's decline reached the ascending trendline near $3,314.0. The bullish trend remains intact while price holds above the trendline.
Immediate resistance is $3,348.0, and a close above this level could lift the market toward $3,389.0 and potentially $3,451.0, aligning with recent higher-lows.
