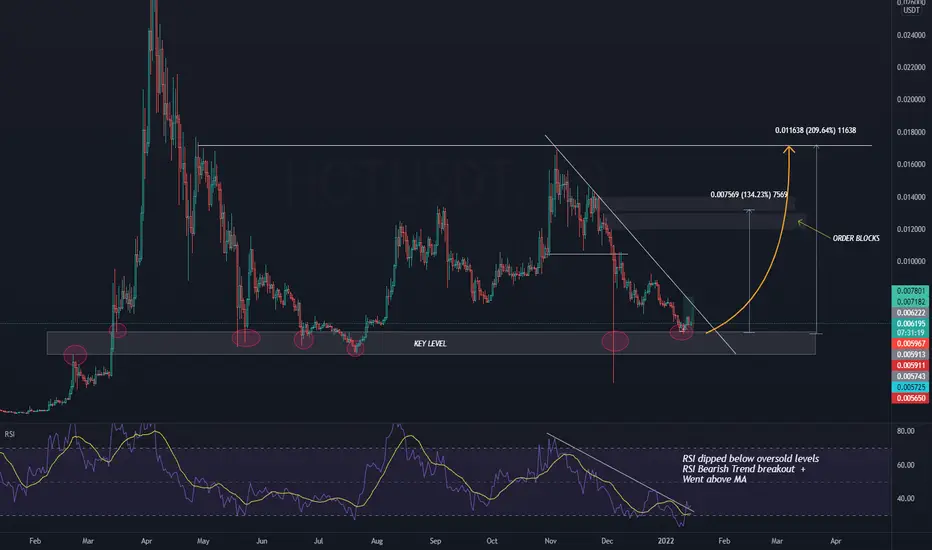
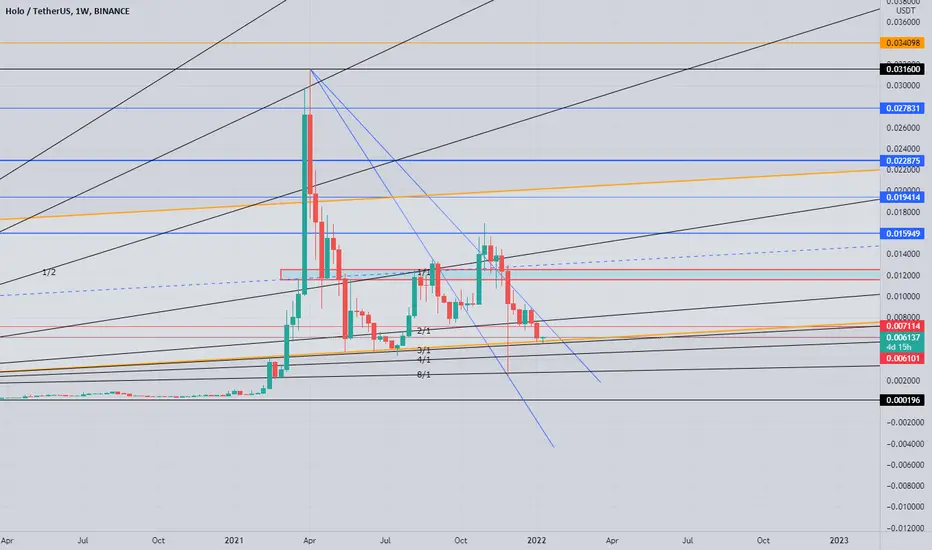
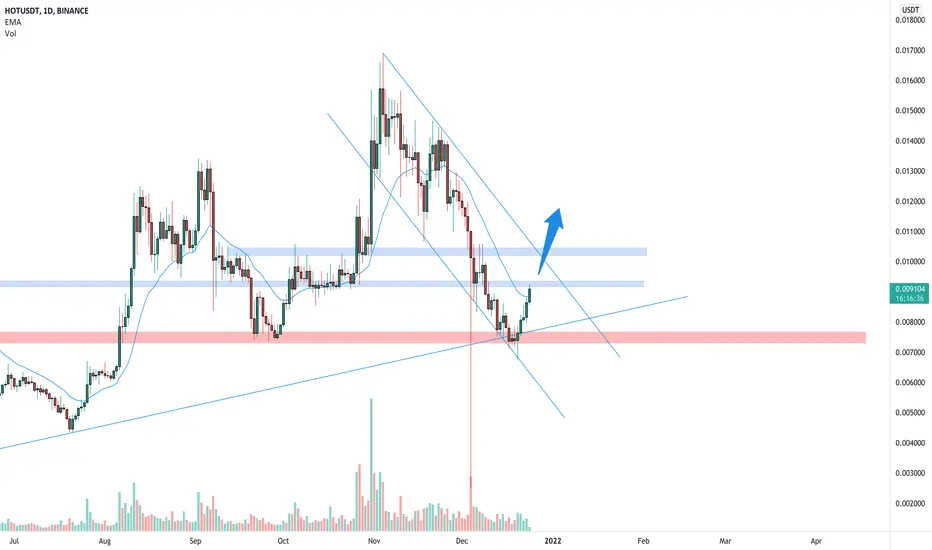
HOLOCHAIN (HOT) potential 200% move!"If" HOT has bottomed from here, I think it can make a 200% move. It is currently sitting on a significant key level. Once it breaks the key level this analysis is immediately invalidated.
HOTUSDT.P trade ideas
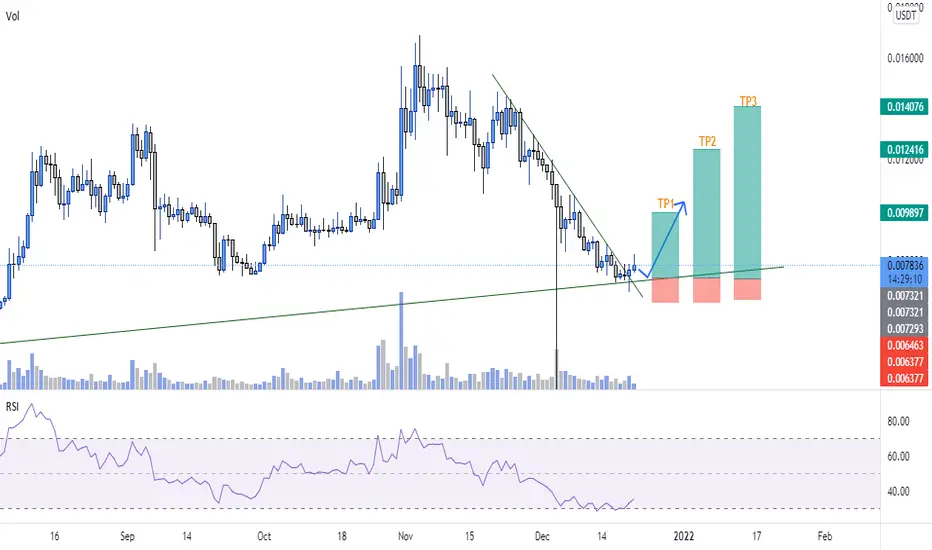
HOTUSDT Analysis (x2 potential from here)Hello friends.
Please support my work by clicking the LIKE button(If you liked).Thank you!
Everything on the chart.
open pos: market and lower
target: 0.013 - 0.018 - 0.022
after first target reached move ur stop to breakeven
cancellation of growth, consolidation below 0.005
stop: im w/o stop (depending of ur risk). ALWAYS follow ur RM .
risk is justified
Good luck everyone!
Follow me on TRADINGView, if you don't want to miss my next analysis or signals.
It's not financial advice.
Dont Forget, always make your own research before to trade my ideas!
HOT/USDT LONG PSOITION SET UPThe return too order block will be filled in the next 4h TF candle, from there we will experience a moon short to the next resistance level.

Chance For Another RallyHOT still in long Term Ascending channel
if weekly close above 0.0061 next is channels midline
stop is weekly close below 0.0055
this is long term analysis
Always Trade Safe!
Dont Fomo!
NFA.
🔥HOT long setup#HOT/USD
🔥HOT
🟢Long: 0.007268-0.007300$
🔰Stoploss: 0.006800$
💰Target:
❌0.007600$
❌0.007900$
❌0.008500$
Subscribe me many signals everyday !✅✅✅
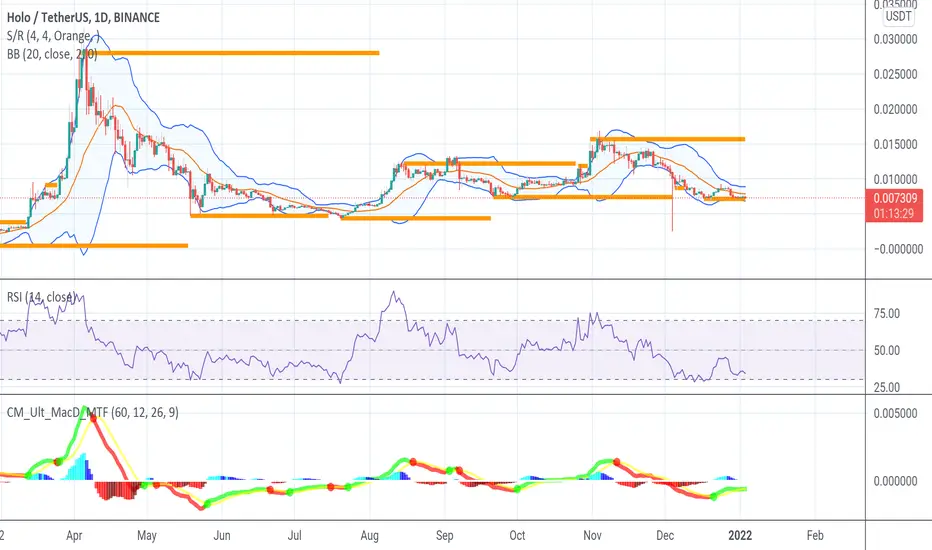
HOLO ready for new cycle run of 50 to 100% jump! The chart shows the cycle path super over sold and ready to pop in a massive way , probably around 2 weeks and will rise over a period of 1 to 2 weeks before sell off time! All indicators look perfect.
HOT Buying opportunity.. Holo great buying opportunity.. just need few days to attack... Not a financal adv.
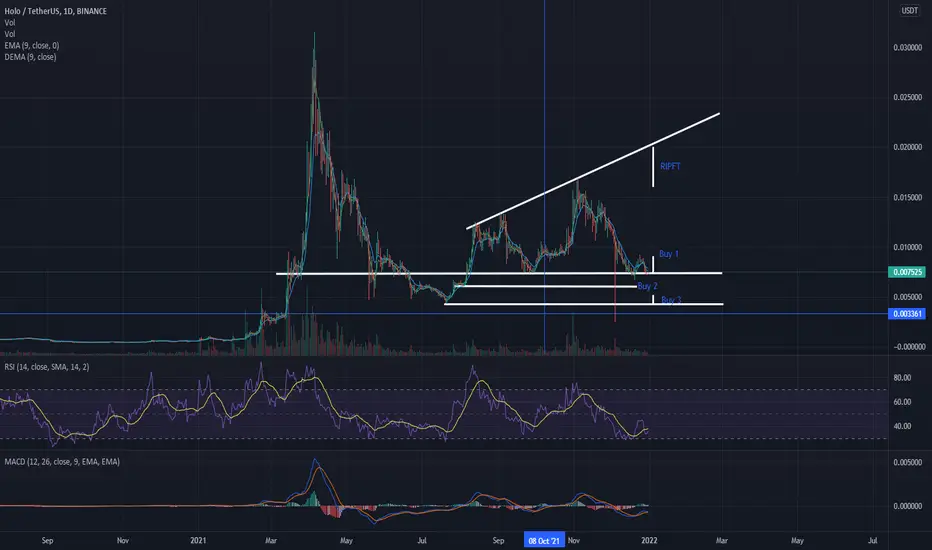
Long HOLOCHAINHolochain has come back down to retest support has bounced off it nicely, and is coming back down for a retest. We may have a retest of $.006 and the lowest i can see is .0045. I have a RIPFT price target in right now of between .016 -.022
No More Drop like it's $HOT--------------------------- No More Drop like it's $HOT -------------------------------------------------

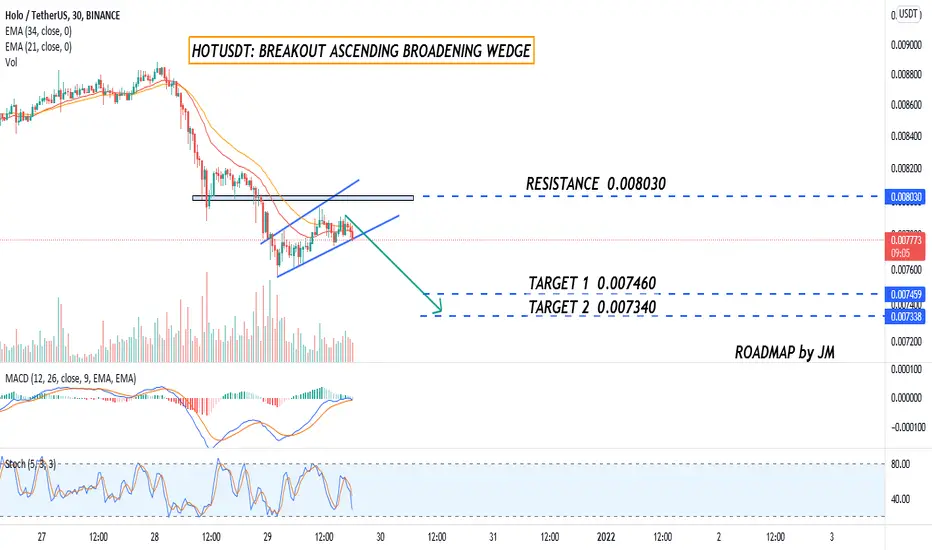
HOTUSDT: BEARISH CHANNELING,TEMPORARY SHORT OPPORTUNITY ON HOLO?Hello Enthusiast Coin Traders! Here's short-term outlook for HOLO , Please give us the thumbs up and support the channel by Smashing the FOLLOW button :)
a) HOLO is moving below exponential moving average 21&34
b) Breakout of ascending broadening wedge could indicates a potential Bearish Bias
c) MACD indicator starts crossing below the zero level area, it signify the potential Bearish Bias Ahead
d) Stochastic has crossing down in the neutral area, it also signify a stronger momentum going downward.
The roadmap will be invalid after exceeding the support/target level
*DISCLAIMER:
This isn't a recommendation to buy or sell cryptocurrency, only an Outlook from technical perspective.

HOT holoooooLet's see! Basically, it looks good as a TA. Plus Aad pattern. could be up to 20%
dow theory!
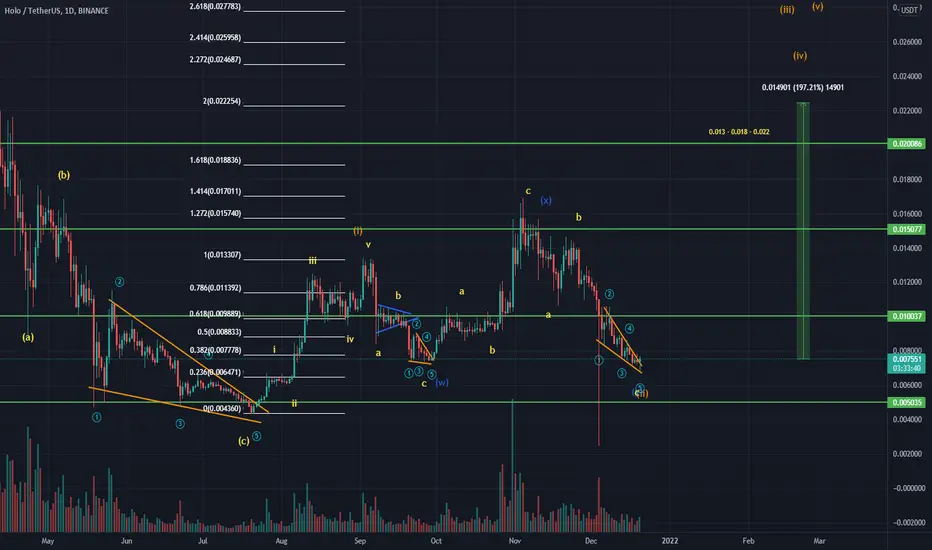
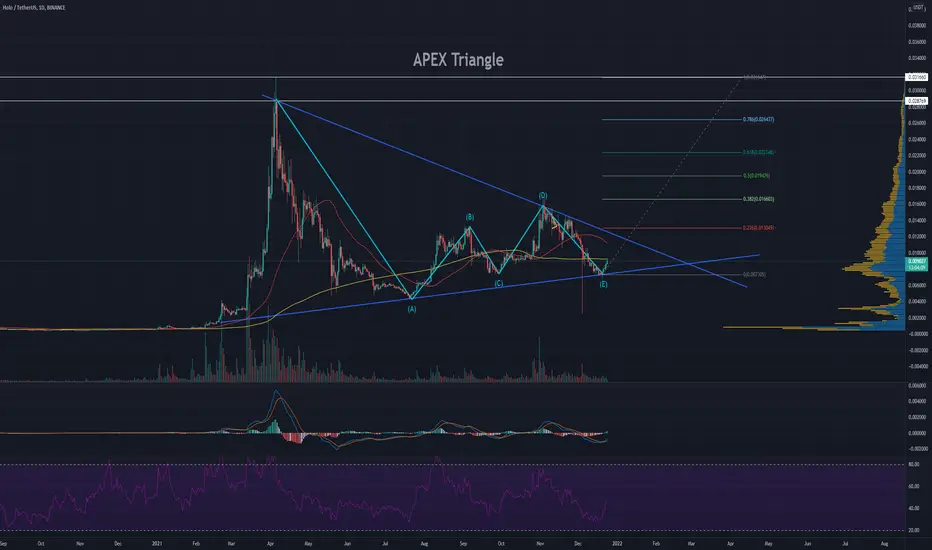
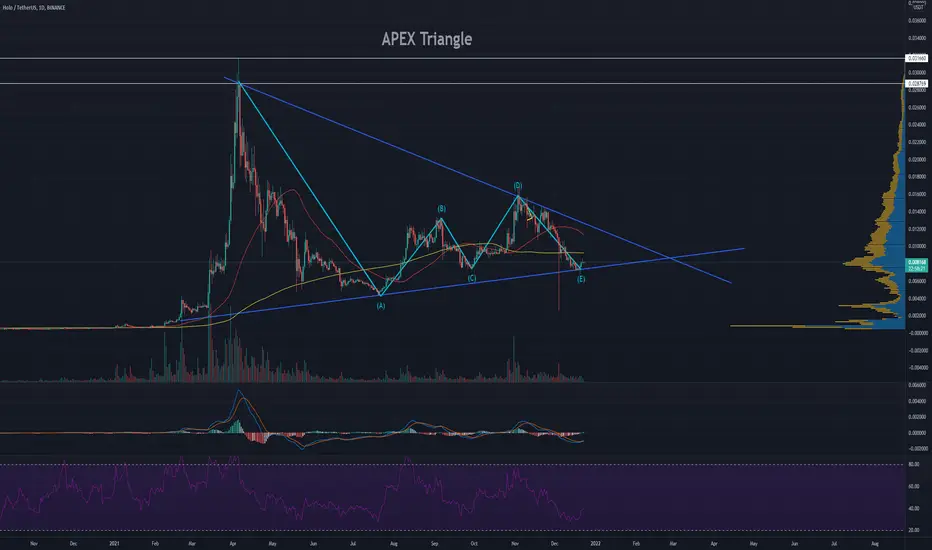
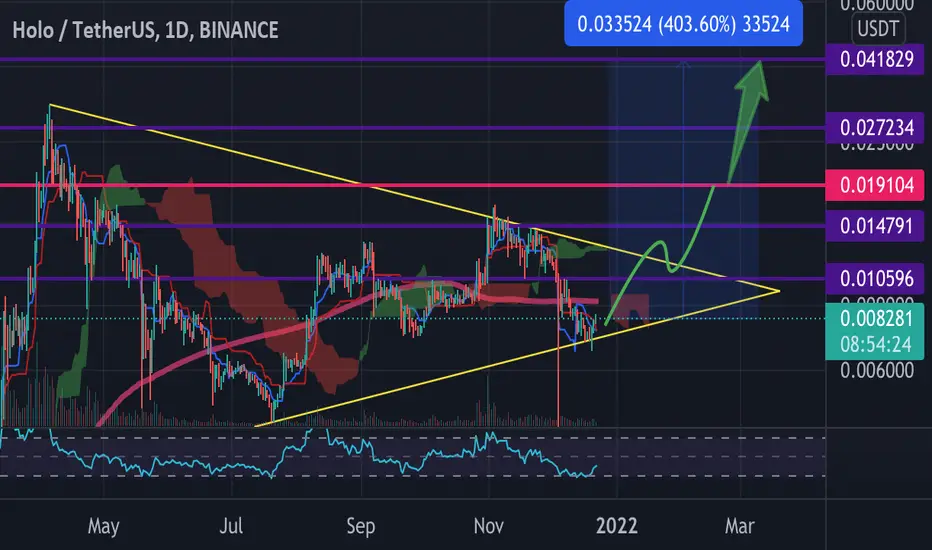
HOT/USDT APEX triangle pattern (Update)Pay attention to HOT (Holochain), it's mirroring VET previous APEX run up. Apex break out zone 0.012277. I believe wave F it's gonna be Fib target golden ratio 0.022348. Around 145% gains from where we are at now.
HOT Daily (Update)
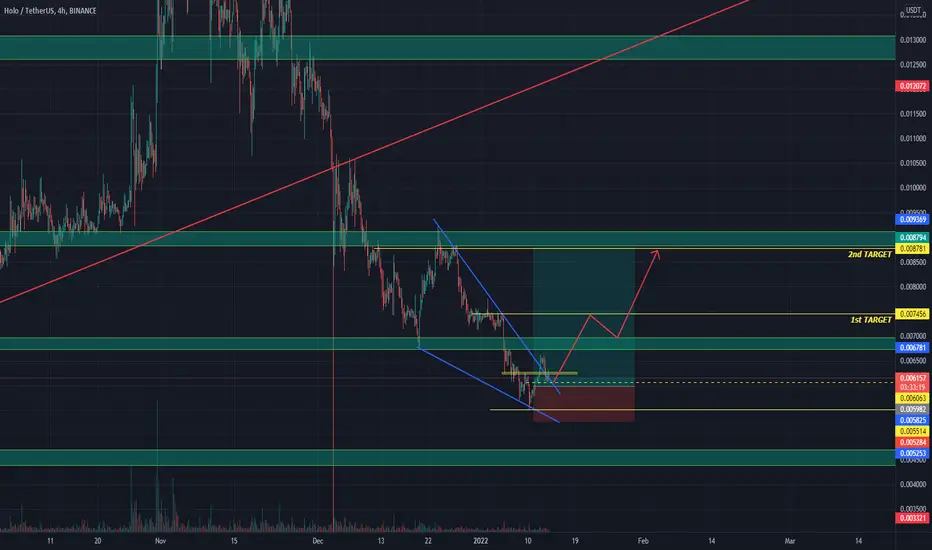
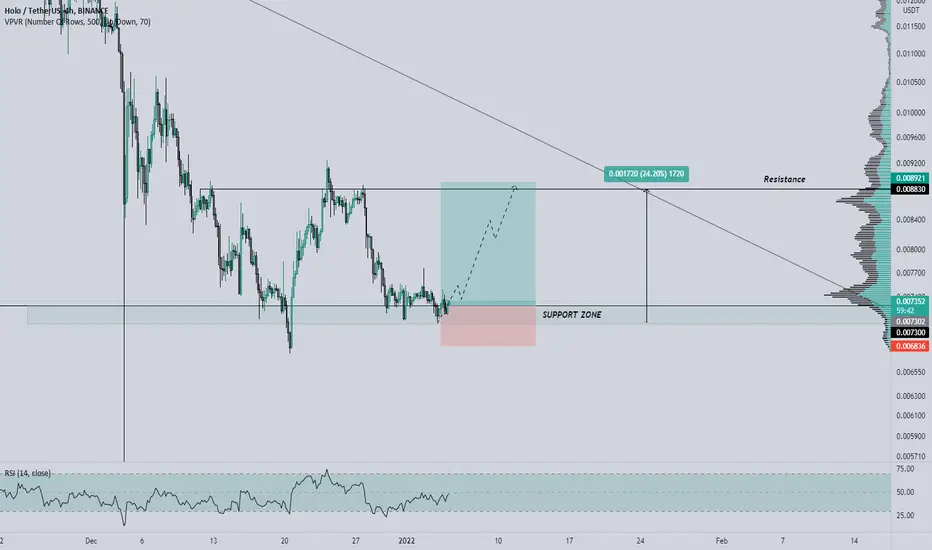
HOTUSDT is trying to have a breakout HOTUSDT is trying to have a breakout from the descending channel after the price bounced on the weekly support.
IF the price is going to have a breakout, According to Plancton's strategy (check our Academy ), we can set a nice order
–––––
Follow the Shrimp 🦐
Keep in mind.
🟣 Purple structure -> Monthly structure.
🔴 Red structure -> Weekly structure.
🔵 Blue structure -> Daily structure.
🟡 Yellow structure -> 4h structure.
⚫️ Black structure -> <4h structure.
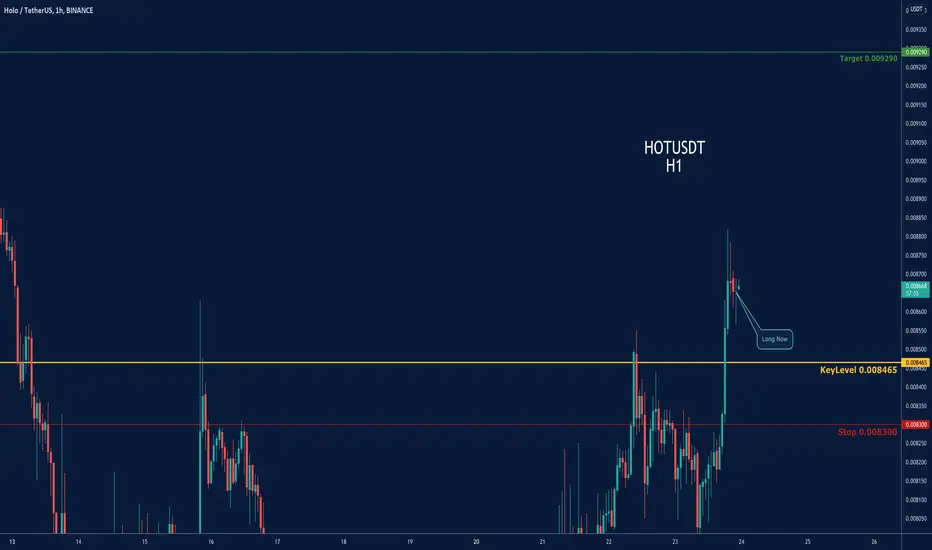
HOTUSDT - SHORTThere is a long position in HOTUSDT Holo
HOTUSDT Holo
🔵Long Now or set on Key Level 0.008465
🟢Target 0.009290
❌Stop loss 0.008300
#K_Level
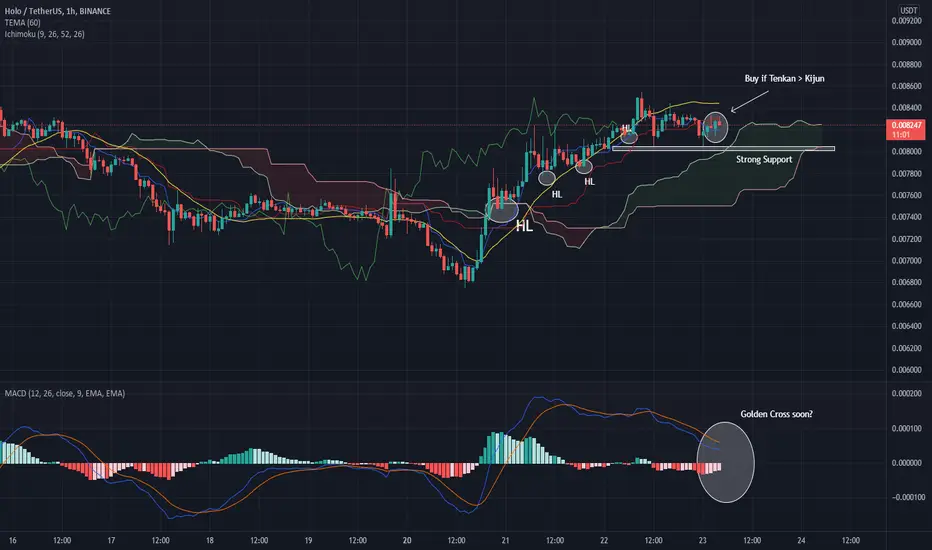
HOT, 1H, Higher lows and Support BounceHOT has been making very good moves in the 1H mark, if the strong support bounce continues alongside with the golden cross of both MACD & Tenkan Kijun HOT has the potential to skyrocket.
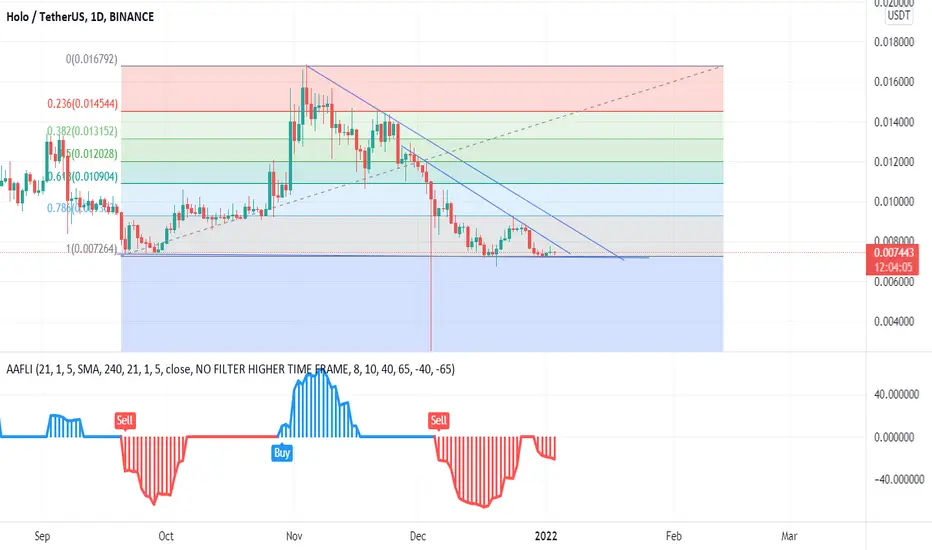
HOT/USDT APEX triangle patternApex triangle is one of the strongest pattern, an idea entry point would be the retest on support 0.007554 (Blue line) of the Apex triangle before next bounce off. Applying Eliot wave theory, I would expect a final wave F towards the upside, breaking out of the Apex. At least 300% gains towards previous ATH. This is a bullish scenario. Highly dependent on BTC.
HOTUSDT is going to test the daily resistance HOTUSDT is going to test the daily resistance after the price bounced on the dynamic support.
IF the price is going to have a breakout, According to Plancton's strategy (check our Academy ), we can set a nice order
–––––
Follow the Shrimp 🦐
Keep in mind.
🟣 Purple structure -> Monthly structure.
🔴 Red structure -> Weekly structure.
🔵 Blue structure -> Daily structure.
🟡 Yellow structure -> 4h structure.
⚫️ Black structure -> <4h structure.

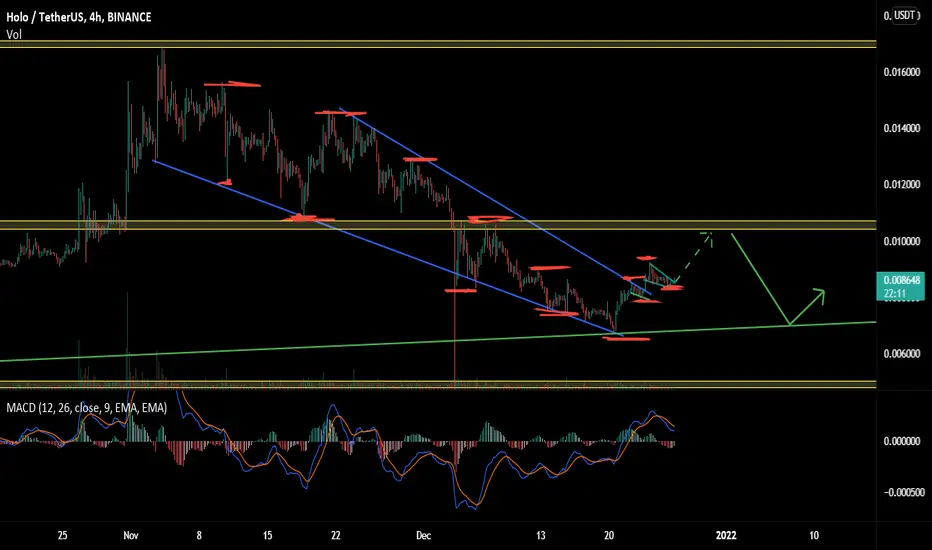
🔥 HOT Bullish Channel Reversal: +130% GrowthWith crypto reversing, HOT is naturally following the market trend.
Interestingly enough, the reversal of HOT occurred on a very important point, right at the bottom of the bullish channel.
Assuming that BTC will remain bullish / neutral in the near future, there's a decent probability that HOT will see more bullish price action and move towards the top of the channel.
Target would be the top of the channel, >130% gains potentially.
Happy trading!

HOTUSDTThis is not a trading advise please do your own analyze and dont forget about SL/TP. have a happy trading day.