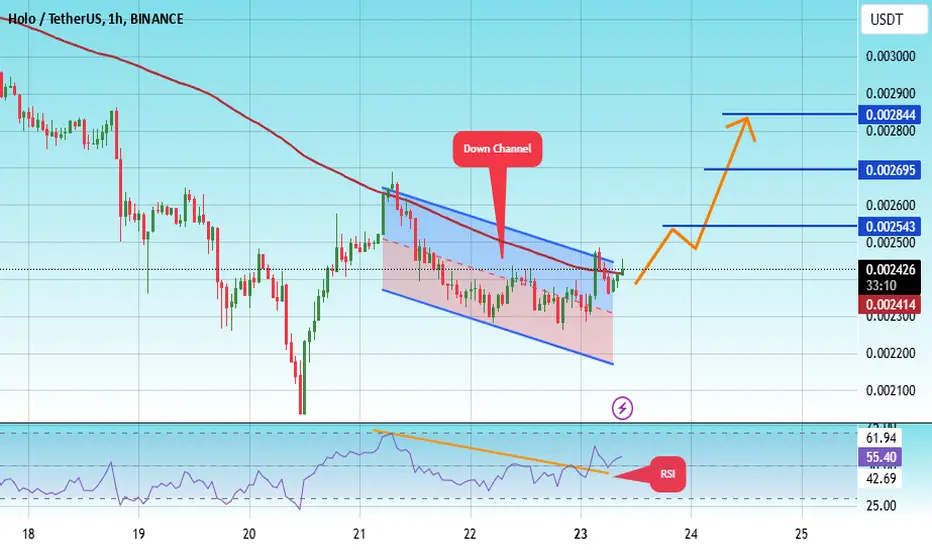
#HOT/USDT Ready to go higher#HOT
The price is moving in a descending channel on the 1-hour frame and sticking to it well
We have a bounce from the lower limit of the descending channel, this support is at a price of 0.0078
We have a downtrend on the RSI indicator that is about to be broken, which supports the rise
We have a trend to stabilize above the moving average 100
Entry price 0.002423
First target 0.002543
Second target 0.002695
Third target 0.002844
HOTUSDT.P trade ideas
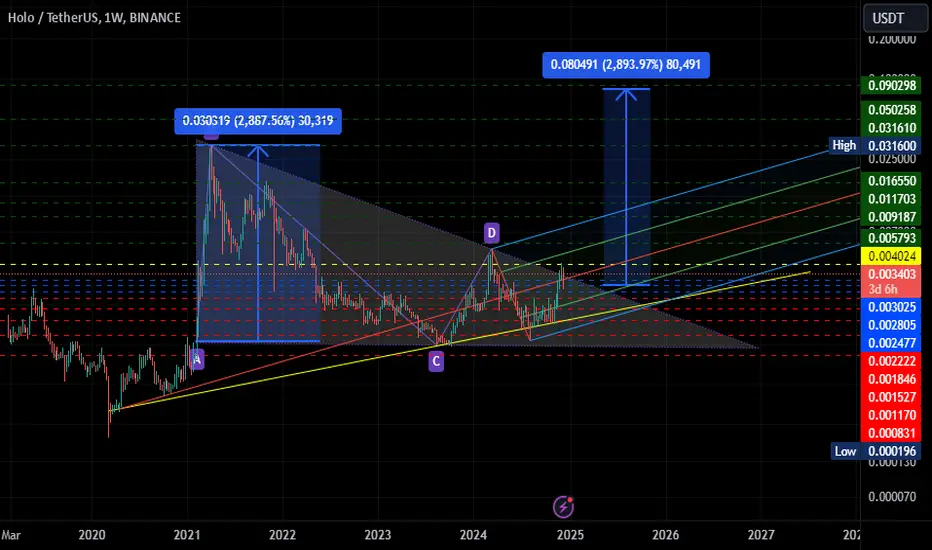
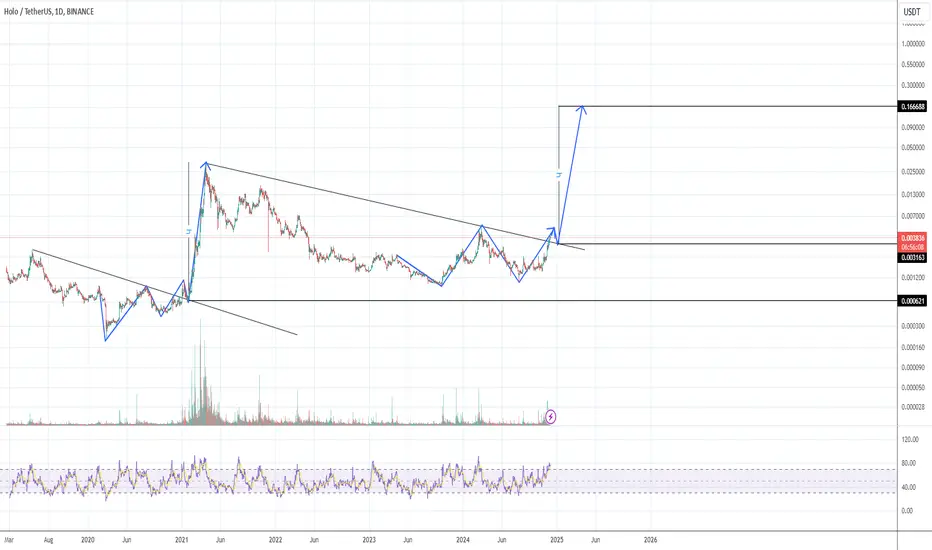
HotUsdtyou think holo can touch 0.09 ?
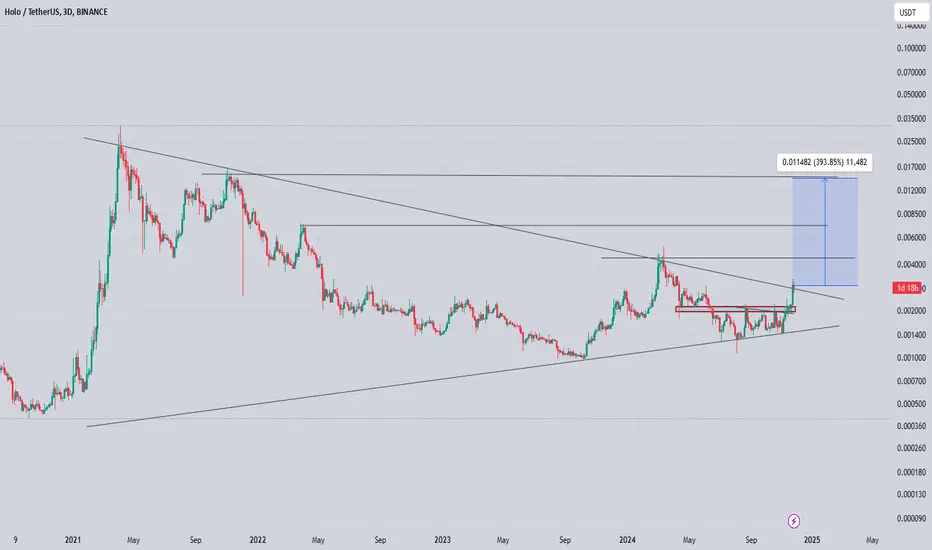
this triangle can happen?
Keep your hopes up. This goal is very high, but Hot has also shown that it is an old currency and has been able to maintain itself so far and in all crises.
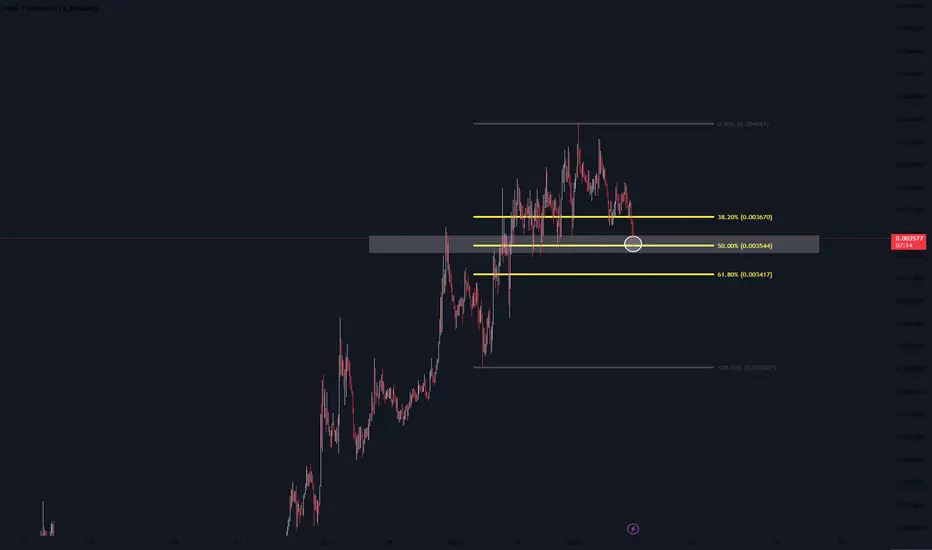
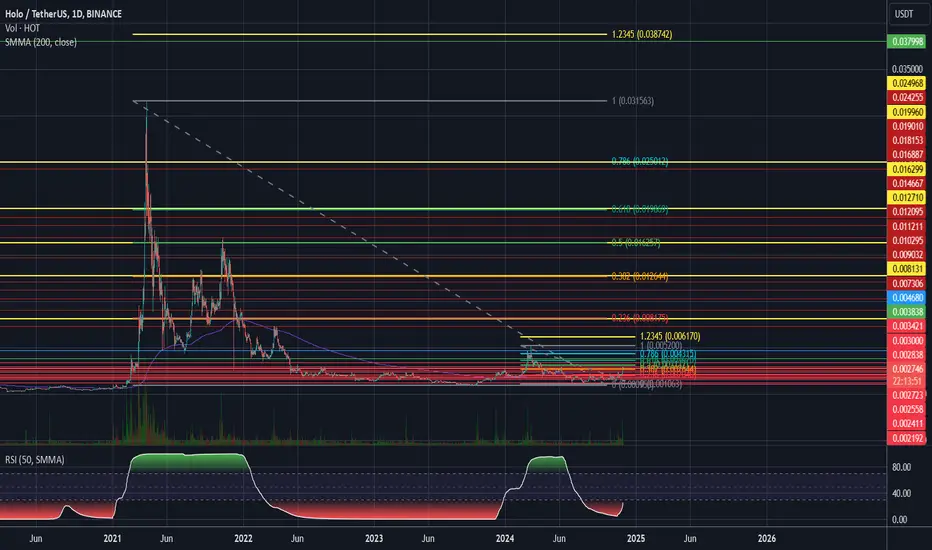
You can't look so optimistically and this is not a miracle. But if you've done your own research, I'll leave you with an analysis of possible prices, I hope it helps
GL
EntryPoint:
0.003025
0.002805
0.002477
Supports:
0.002222
0.001846
0.001527
0.001170
0.000830
Resistance:
0.004025
Targets:
0.005793
0.009187
midtime:
0.011700
0.016550
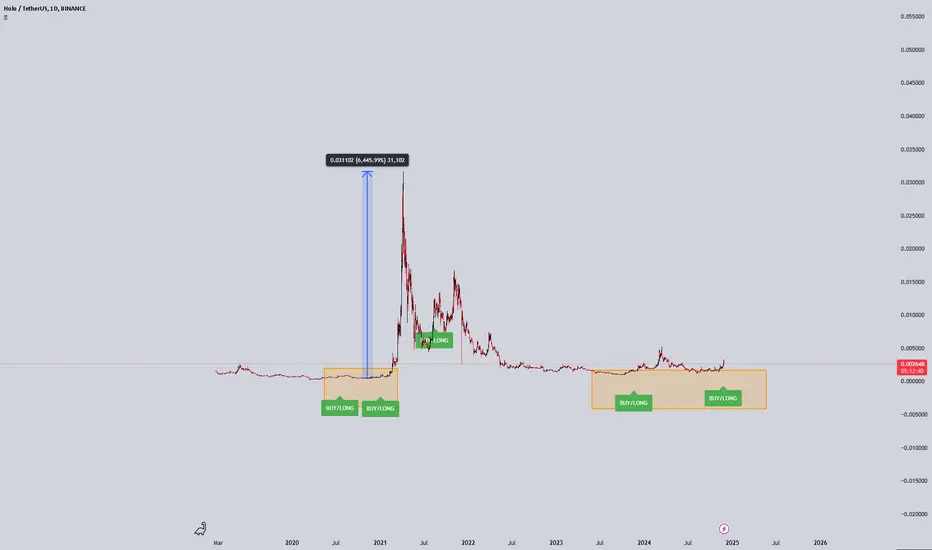
HODL:
0.031610
0.050258
0.090298
These goals are very difficult and have been done separately from inflation and fundamental analysis of this currency. The only technical analysis is a chart and it is better to do the fundamental research yourself.
Good Luck
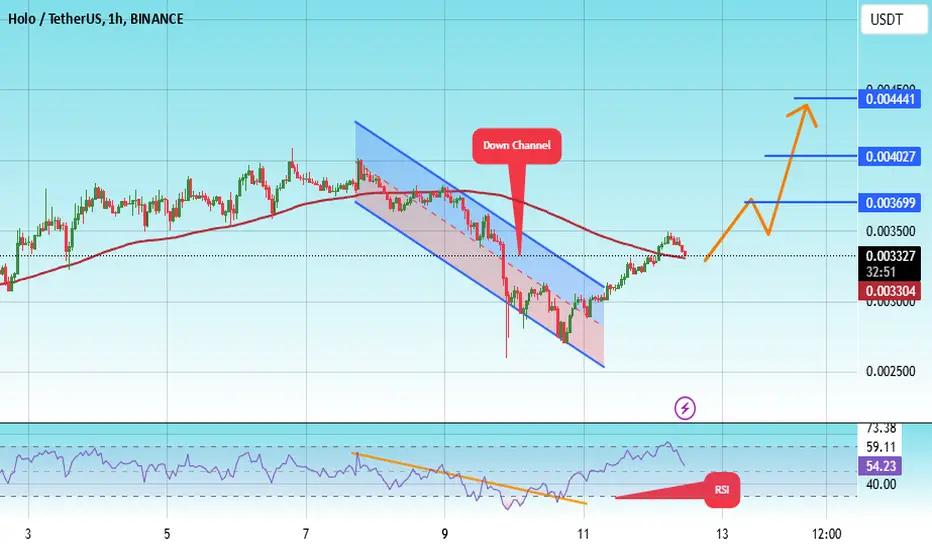
#HOT/USDT Ready to go up#HOT
The price is moving in a descending channel on the 1-hour frame and sticking to it well
We have a bounce from the lower limit of the descending channel, this support is at 0.002700
We have a downtrend on the RSI indicator that is about to break, which supports the rise
We have a trend to stabilize above the moving average 100
Entry price 0.003323
First target 0.003700
Second target 0.004027
Third target 0.004440
Holochain (Hot) sleeping giantThis is my idea on Holochain (Hot) after Xrp Ada Hbar and many more. Time for giant to wake up
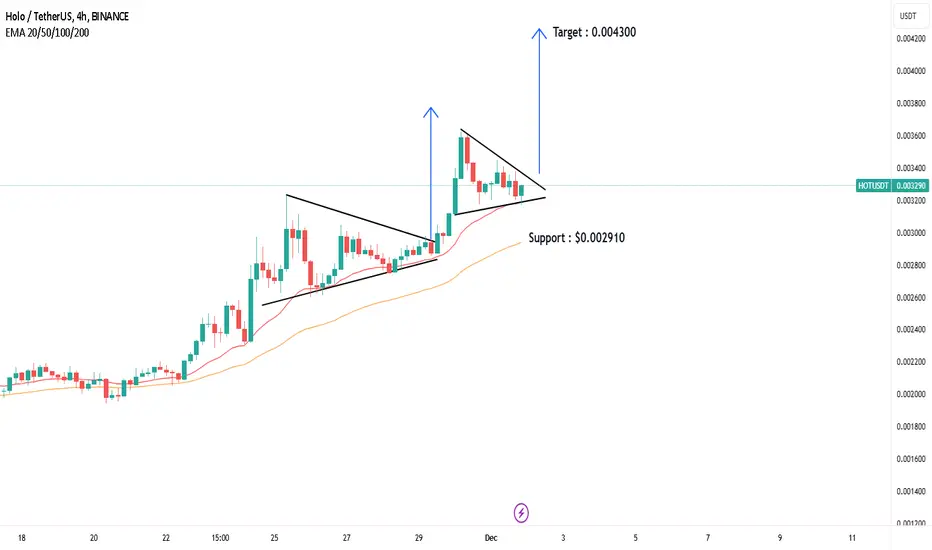
HOT - USDHot is in a bullish trend, still holding on to the MA 20 line. HOT is currently accumulating again. The current price is the best time to buy. The nearest target is $0.004300
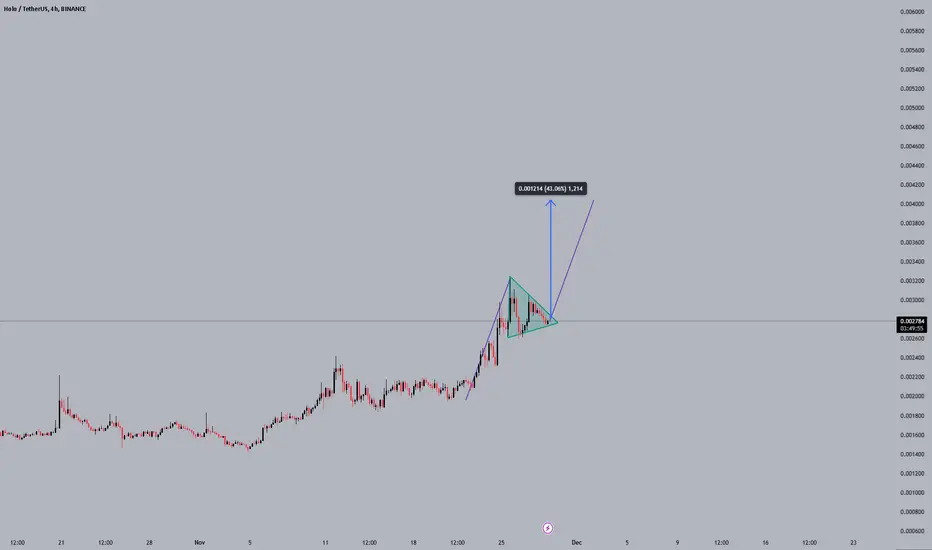
HOT/USDT Short Term BullflagShort term trading for HOT/USDT - possible 40% profit when this bullflag breaks out!
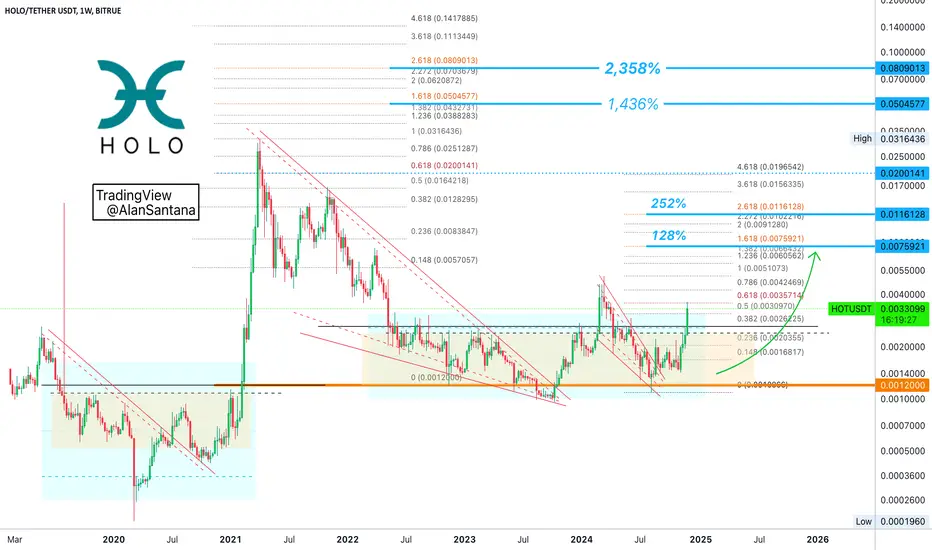
Holo: New All-Time High MappedWe have four weeks green. This is happening after three months of sideways and three and a half months of bearish action. This is important. So the bullish action is strong but it is only happening after more than 7 months of bearish and consolidation. This means that the bullish action is only starting now.
If we were to look at the monthly timeframe, this is the first month green breaking above resistance. This is the start of a major bullish wave.
Yes, there can be a retrace but it should be either small or short-lived. The market never moves straight up, that's true. But focusing on the short-term can cause havoc to our minds and to our trades. Focus on the long-term.
HOTUSDT (Holo) looks great on the long-term. We have room for plenty of growth and we will wait for the pair to grow. We are aiming for a new All-Time High, minimum 1,400% but there can surely be more.
Thanks a lot for your continued support.
Namaste.
$HOTusdt trading opinionI have two targets for LSE:HOT , 50% and 100% profit opportunities. please pick which ever works for you. entry and exit prices are on the chart.
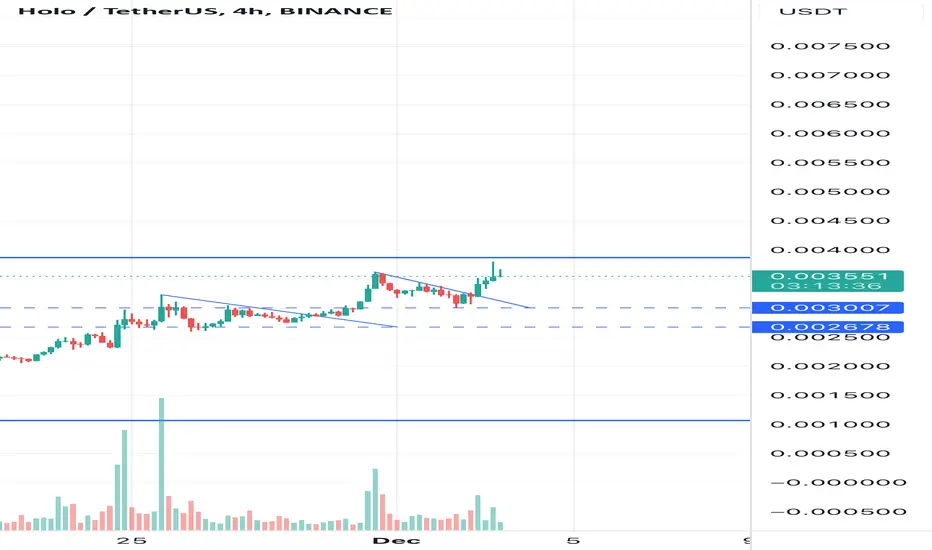
HOTUSDTHMT v1.0 spotted. Looking good with previous wave up with increasing volume and momentum.
- BOS (Breaks of Structure) at @ 0.002687 - 0.002806 level
- Trending slow and steady if able to hold above the BOS level
It is at extremely good reward to risk level.
HOTUSD - Bull Target 0.01Price likes to double bottom along the lower solid green line, last time this was seen a large bull move followed. Right now this double bottom is presenting itself again so I assume a bull move is following.
The dotted green line is the target for bulls, I have shown my price action thoughts with the bars pattern tool.
Daily timeframe.
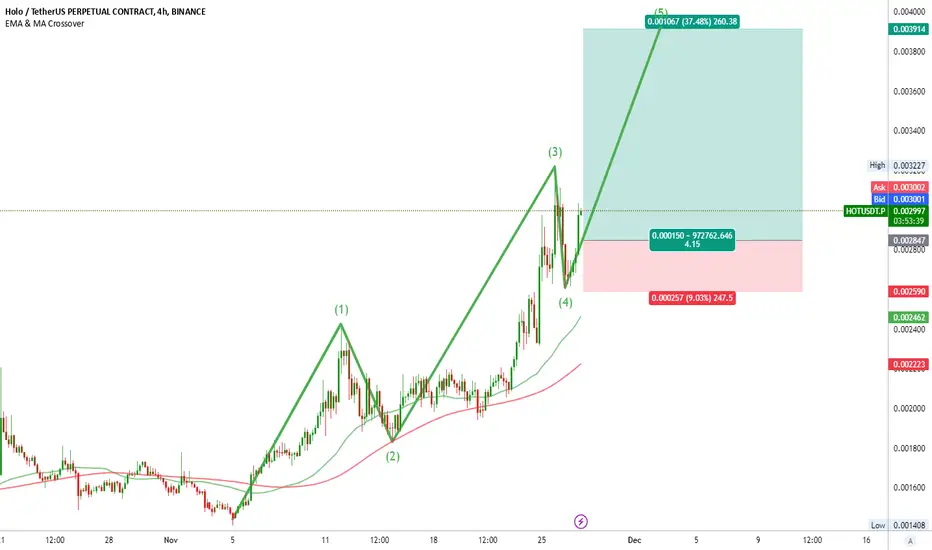
Crypto (HOT/USDT) Long Setup (4H Timeframe) 🔍 Trading Plan
This is a long trade setup based on Elliott Wave analysis and key support/resistance levels.
📉 Trade Details
Entry: 0.002834
Price is near a strong demand zone and aligns with support at the Wave (4) level.
Stop-Loss : 0.002590
Positioned just below the demand zone to minimize risk.
Take Profit Targets:
Target 1 : 0.003415
This corresponds to the 1.0 Fibonacci extension of Wave (5).
Target 2 : 0.003914
The 1.618 Fibonacci extension of Wave (5), where a strong resistance zone is identified.
📊 Risk-Reward Ratio (RRR)
RRR: Approximately 1:3 to T1 and higher if T2 is reached.
🔔 Additional Notes
The setup is supported by a clean impulsive structure completing Wave (5) and retracing to a demand zone.
Good luck, and always manage risk carefully! 🚀 #CryptoTrading #HOTUSDT #TradingSetup
⚠️ Disclaimer
This analysis is for educational and informational purposes only and should not be considered financial advice. Cryptocurrency trading carries a high level of risk and may not be suitable for all investors. Always conduct your own research, assess your risk tolerance, and consult with a financial advisor before making any trading decisions.
Hot Coin Breakout Confirmed Getting Ready For 400% Bullish Rallyholochain is one of the well known blockchain in crypto industry recently hot coin breaks its long multi year symmetrical triangle and bouncing from trendline area after successful breakout hot coin can move like doge coin in midterm seems like 300% will be an easy target for midterm after successful retest
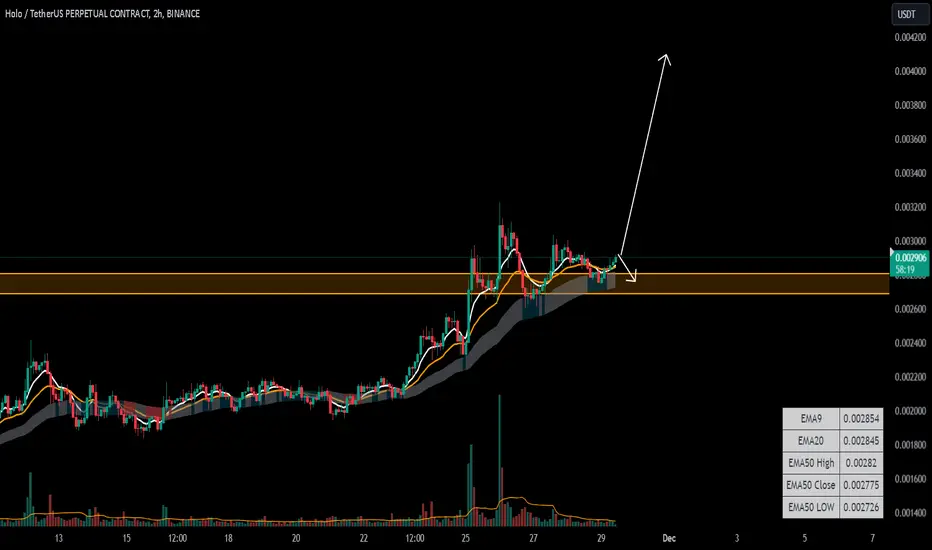
HOT/USDT Back on Track (Ready for Altseason)Big Signal on HOT/USDT.
Imagine a trading strategy that doesn’t flood you with signals but gives you only the most precise and reliable ones. That’s what I’ve created. It’s a tool I designed for myself to avoid the noise of the market and focus solely on high-confidence opportunities.
The signals don’t come often, but when they do, they’re incredibly powerful. Over time, I’ve learned to trust this approach completely. Each trade I take with this strategy is backed by clear logic and thorough testing, and the results speak for themselves.
It’s not about trading more; it’s about trading smarter. If you’ve ever felt overwhelmed by the endless possibilities in the market, you might appreciate the simplicity and focus this brings.
(Watch my other posts!)
Greetings,
HerraTrades
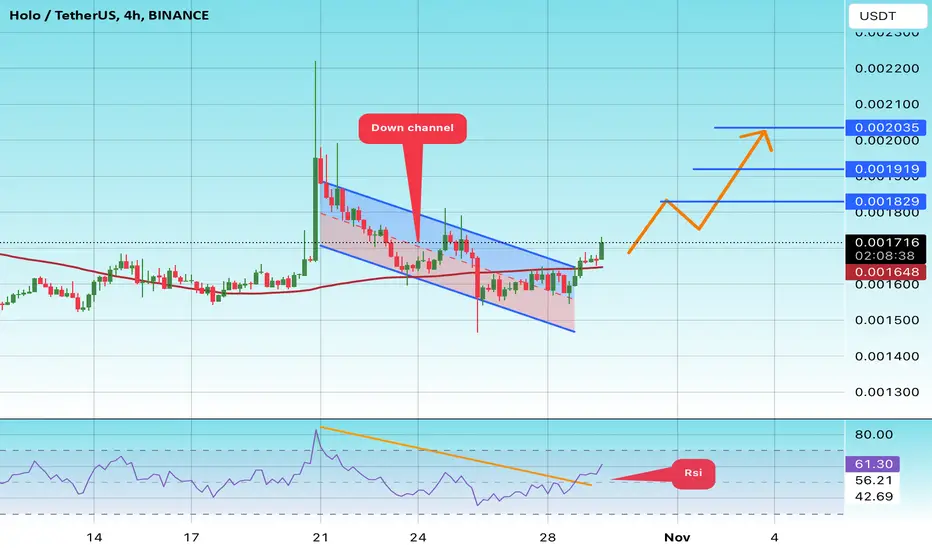
#HOT/USDT#HOT
The price is moving in a descending channel on the 4-hour frame upwards and is expected to continue
We have a trend to stabilize above the moving average 100 again
We have a downtrend on the RSI indicator that supports the rise by breaking it upwards
We have a support area at the lower limit of the channel at a price of 0.001500
Entry price 0.001712
First target 0.001830
Second target 0.001919
Third target 0.002034
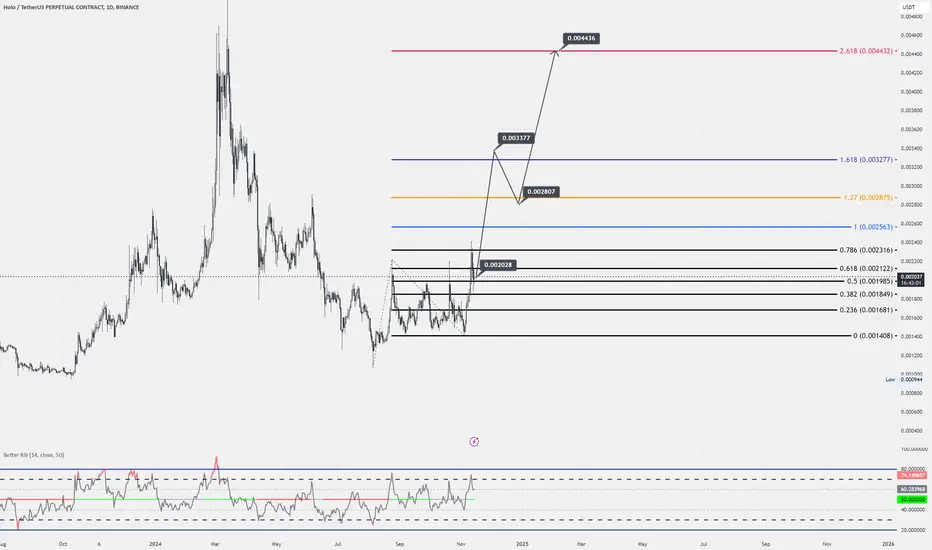
HOT HOLO Price Action SoonFollowing and knowing simple fib retraces are key on both micro and macro levels.
Spot trade idea.
Using simple indicators; 200 SMMA, 50 SMMA RSI - find the bottoms, fib retrace those levels - up or down
Yellow is target, micro and macro levels

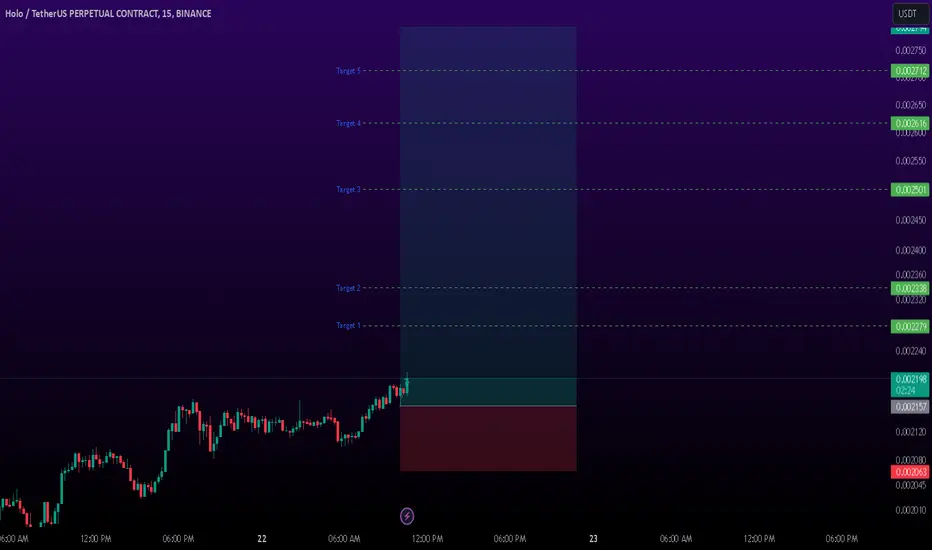
HOT Long 15m Sl -4.3%HOTUSDT Long Setup
Reason:
Broken out of Trend.
Strong Bullish Momentum
Liquidity Sweep already taken.
All Price actions suggesting a bullish wave.
Best Regard,
Crypto Panda
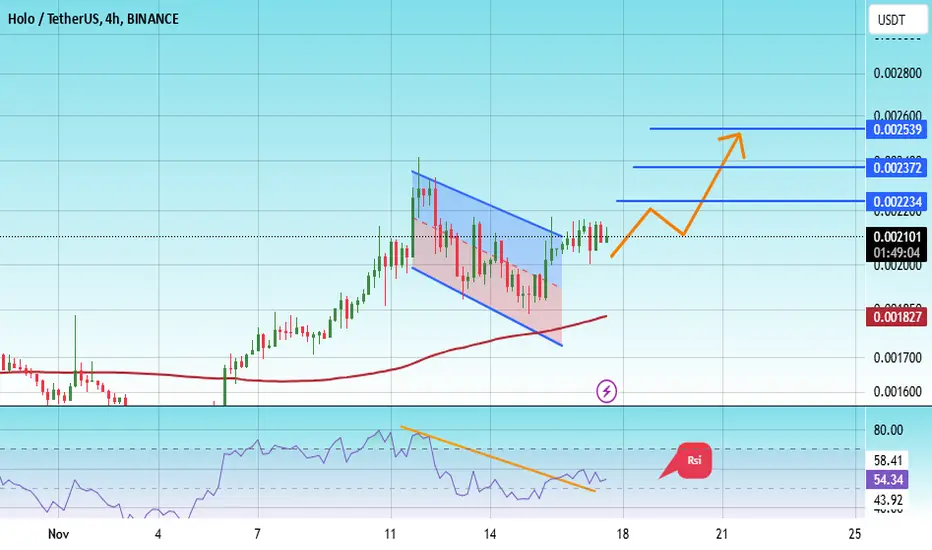
#HOT/USDT Ready to go up#HOT
The price is moving in a descending channel on the 4-hour frame and sticking to it well
We have a bounce from the lower limit of the descending channel, this support is at 0.001880
We have a downtrend, the RSI indicator is about to break, which supports the rise
We have a trend to stabilize above the moving average 100
Entry price 0.002180
First target 0.002234
Second target 0.002372
Third target 0.002540
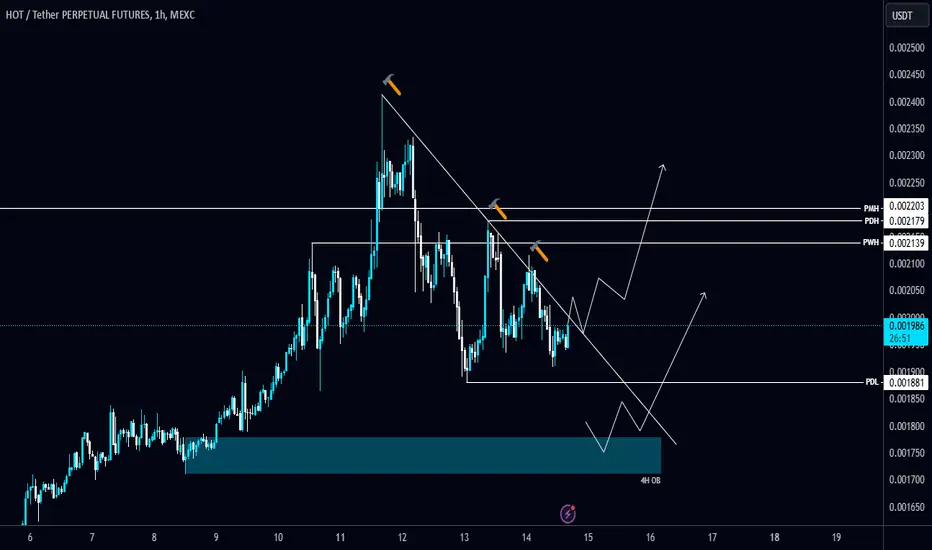
#HOT/USDT is trying to break the Diagonal Trendline in 1-hour TF#HOT/USDT is trying to break the Diagonal Trendline in 1-hour TF!
Wait for BO/retest to long it, otherwise, it can retest the 4H OB in the bottom. The local support level is PDL $0.00188 and the resistance level is PMH $0.002203.
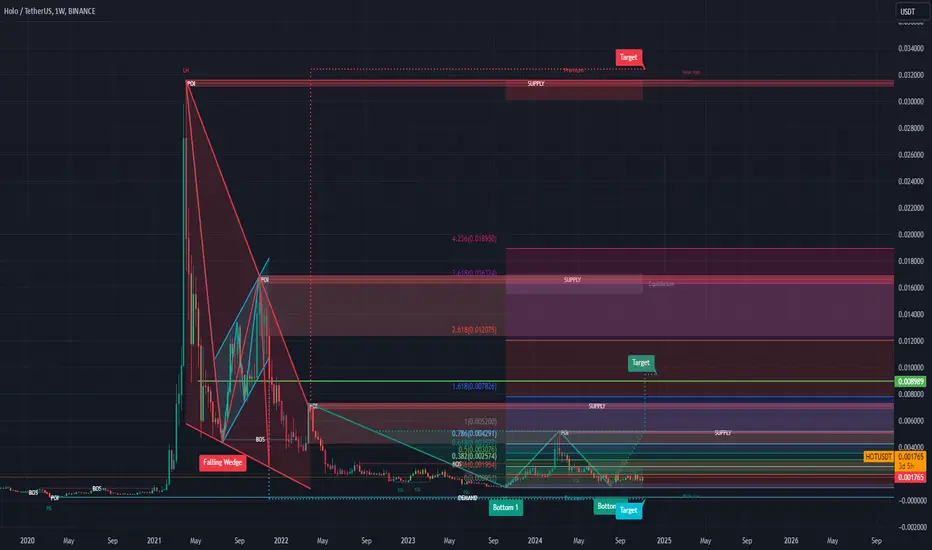
HOT - Target - $0,09 - Double bottom break outHOT looks great on the weekly timeframe. The price has bottomed out and the comming weeks HOT can increase up to $0,09 as first next weekly target.
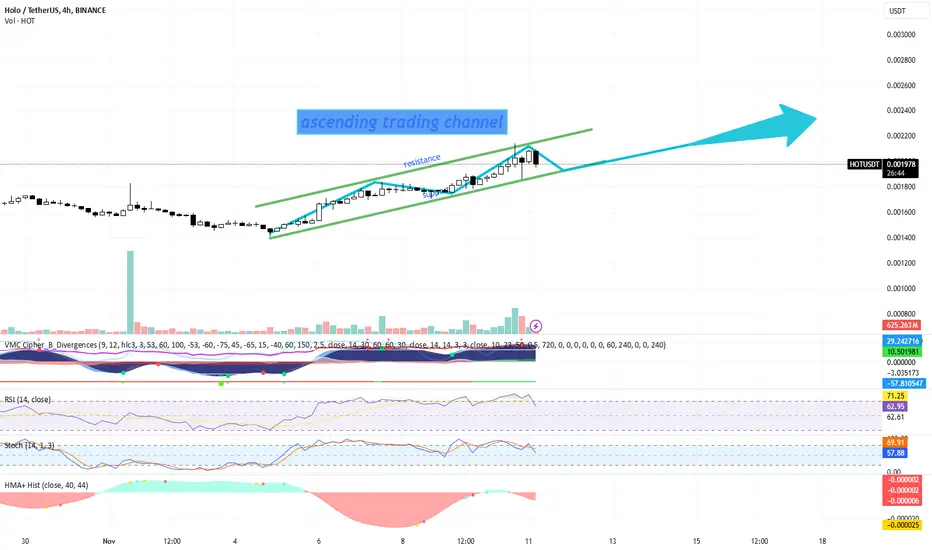
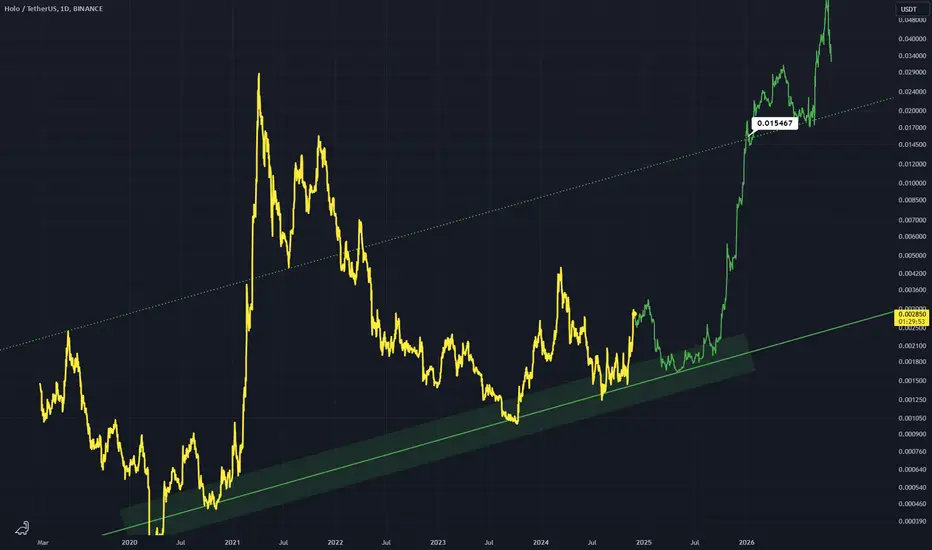
HOLO (HOT) TECHNICAL ANALYSIS + TRADE PLANTechnical Analysis for HOLO (HOT) Cryptocurrency
Chart Overview:
The chart shows HOLO (HOT) trading within an ascending channel, which is a bullish continuation pattern. The ascending channel is characterized by two parallel trendlines: a support line at the bottom and a resistance line at the top, with the price generally moving upwards within these boundaries.
Key Observations:
Ascending Channel Pattern: HOLO (HOT) is trading in an upward-sloping channel, suggesting a bullish sentiment. The price has recently tested the channel's resistance line, facing a minor pullback, but remains within the channel, indicating potential continuation of the uptrend.
Support and Resistance Levels:
Support: The lower boundary of the ascending channel serves as the primary support level. If the price tests this line, it may present a buying opportunity.
Resistance: The upper boundary acts as resistance, where traders may take profit or anticipate pullbacks.
Volume Analysis: The recent volume spike aligns with a test of the upper channel resistance, suggesting stronger interest from traders. A sustained increase in volume on upward movements could confirm bullish momentum.
Technical Indicators:
VMC Cipher B Divergences: Indicates bullish divergences, which may signal a continuation of upward momentum.
RSI (Relative Strength Index): RSI is above 60, but not in the overbought zone, suggesting room for potential upward movement.
Stochastic Oscillator: Shows a minor pullback, with potential for reentry if the oscillator reverses from oversold levels.
HMA Histogram: Momentum appears to be weakening slightly, as indicated by a minor decline in the histogram. Continued monitoring is needed to confirm whether this trend is reversing.
Price Prediction:
If the ascending channel pattern holds, HOT may continue its upward trajectory. The next price targets are:
Short-term Target: $0.0022 - Near the top of the channel.
Medium-term Target: $0.0024 - If price breaks out of the ascending channel with strong volume.
Trading Plan:
Entry Points:
Rebound from Support: Consider entering long positions if the price tests and rebounds from the lower channel support.
Breakout Confirmation: Enter long if the price breaks above the resistance line of the channel with strong volume.
Exit Points:
Take Profit: Near the resistance line within the channel or at $0.0022 to $0.0024 if momentum is strong.
Stop-Loss: Set below the support line of the ascending channel to limit downside risk, around $0.0018.
Risk Management:
Position Sizing: Adjust based on risk tolerance, considering a stop-loss just below the support line.
Trailing Stop: Use a trailing stop if the price exceeds the channel's upper boundary to capture potential upside.