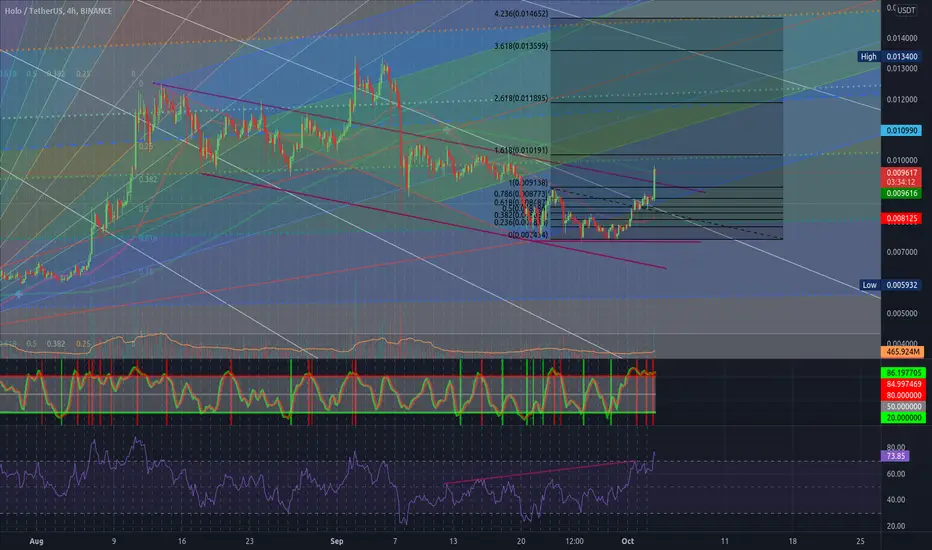
HOT going to the MOON | BREAKOUT Target 30%-300% Hot looks super bullish. Breakout identified in daily and weekly chart pattern in HOTUSDT (HOLO). Target is $0.0133 (30% up from current price $0.0101. Considering current status of holoapps, if it crossed first target then HOT can see new all time high. Holochain Beta might be launching before within next 1-2 months.
HOTUSDT.P trade ideas
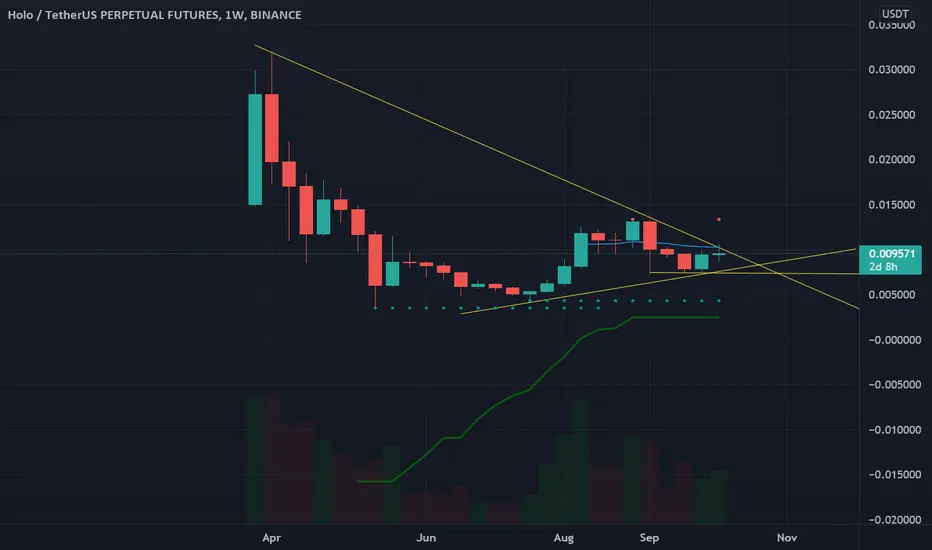
Ready for Sky Rocket | HOTUSDT | Holochain | Weekly Chart TrendComing 1-2 weeks, HOT might be going to skyrocket.
24 hr Volume is very high.
Alpha Testing started from 28th Sept till 11th Nov
Holochain is very close to Beta!! Might be within 2-3 Months.
Soon public users will be able to access holo apps from browser. Holochain is the missing piece of the internet.
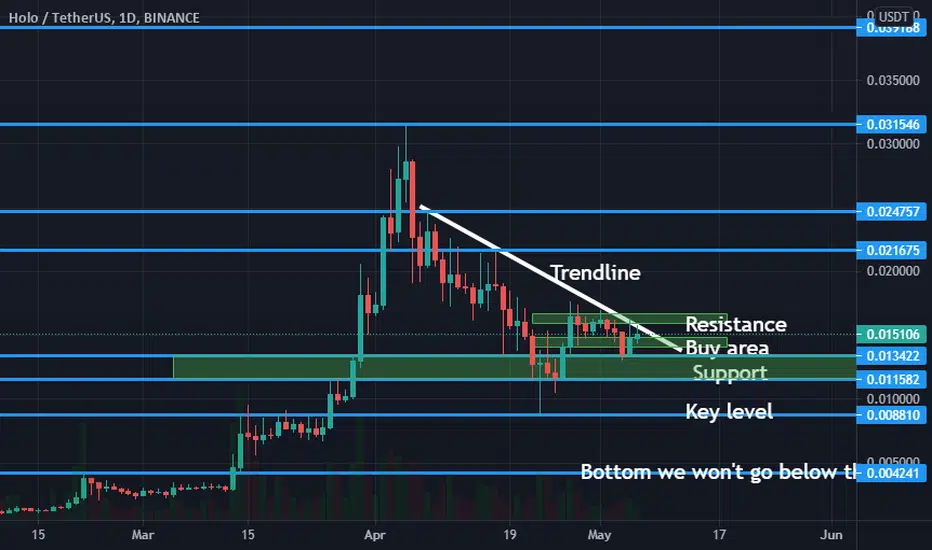
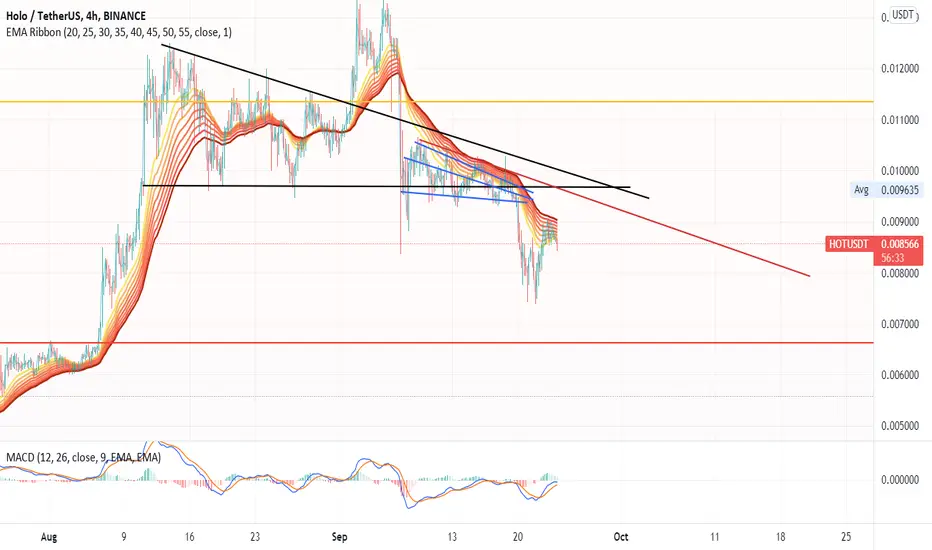
Holo - HOT/USDT - Possible breakout Holo (HOT), Technical Analyses a possible breakout from the trendline.
Only enter if broken through with good volume!
Target point #1: 0.021584
Target point #2: 0.024757
Target point #3: 0.031546 (All time high)
Target points if broken all time high, 0.039188 and 0.045496 (Important Fibonacci levels)
Downside would look like a retest of the support level and maybe a bounce otherwise we'll test the key level
HOTUSDT: BREAKOUT BULLISH CHANNELING, LONG OPPORTUNITY ON HOLO?Hello Enthusiast Coin Traders! Here's medium term outlook for HOLO, Please give us the thumbs up and support the channel by Smashing the FOLLOW button :)
HOTUSDT has broken out of the descending broadening wedge pattern. Breakout of descending broadening wedge pattern indicates the possibility of bullish movement. The momentum indicator crossed above the zero area, it signify the potential upward movement to the target area.
The roadmap will be invalid after exceeding the support/target area.
DISCLAIMER:
This is only an outlook, not a recommedation to buy or sell the cryptocurrency.

HOT/USDT aaaanddd we have a lift off!Take a look at how this beauty breaks resistance. Look at my previous HOT/USDT chart to see what the TP levels are.
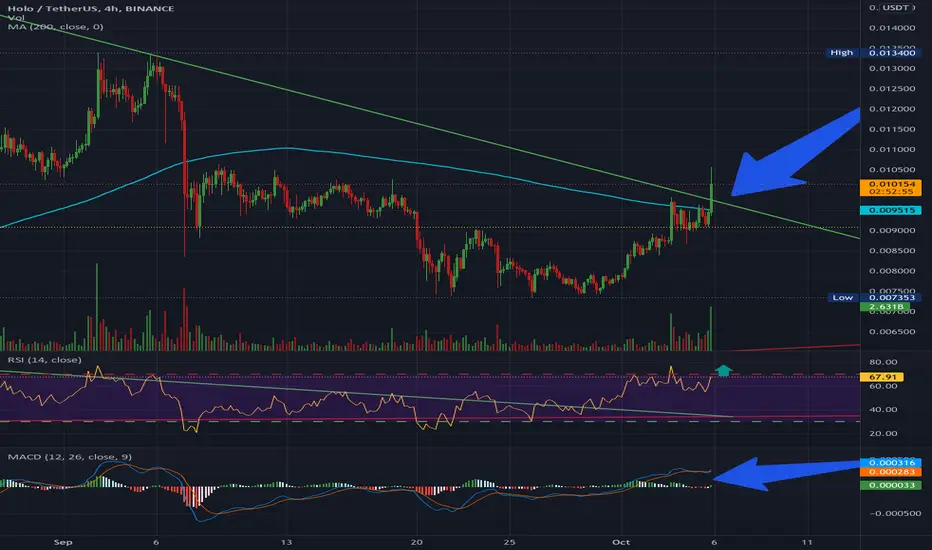
Holo on the verge of making a homerun!The price is going above every indicators (ema's mostly) that I have in the graph which means that there is a lot of confirmation for a bullish takeoff of the price.

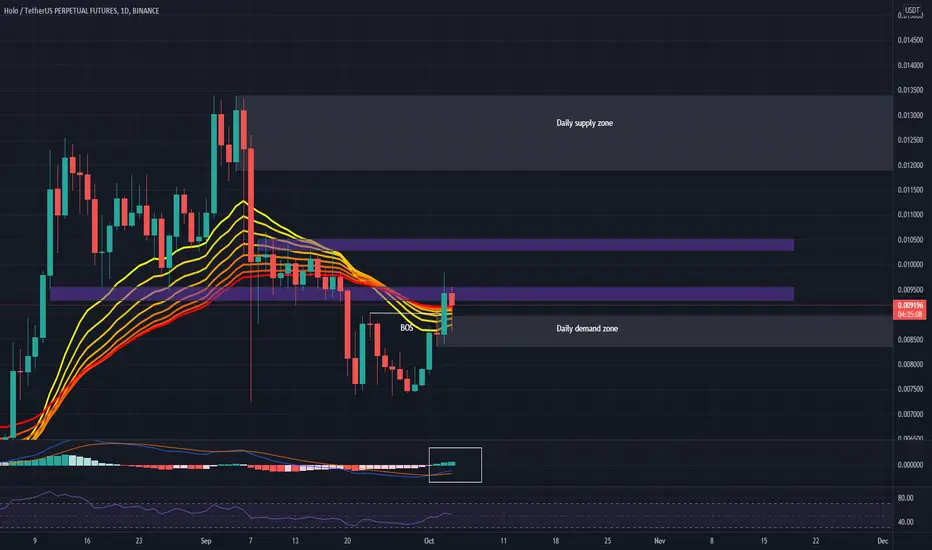
#HOTUSDT Daily Chart update
Price broke structure of the downtrend as it traded above the previous high leaving a Daily Demand zone behind. MACD is bullish, RSI is slightly above 50% and price is sitting on EMA ribbon. We refined our entries on LTF and entered on the demand zone where price got heavily rejected. We are aiming for the daily supply zone.
HOT HOTUSDTBroke into the bottom of an ascending channel from a short lived descending channel.
Looking to hold around .01 until next move up.
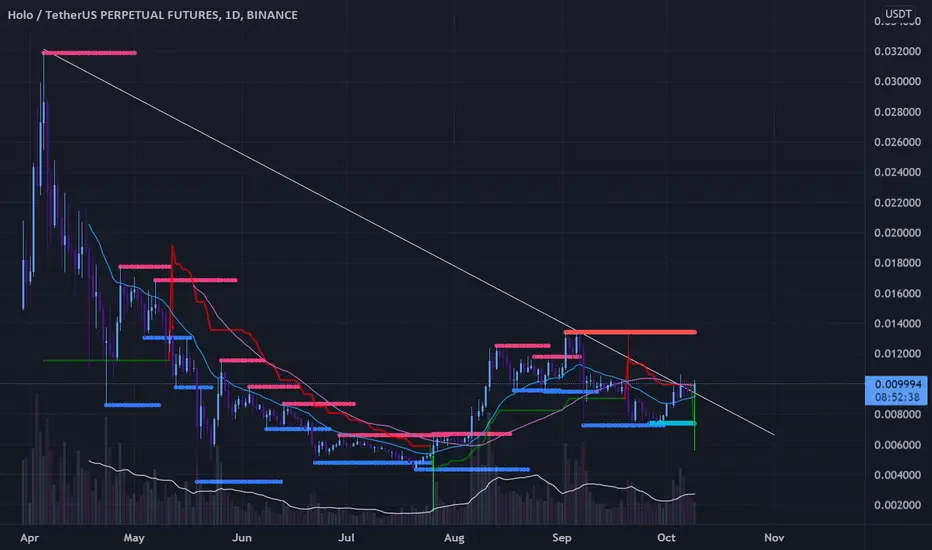
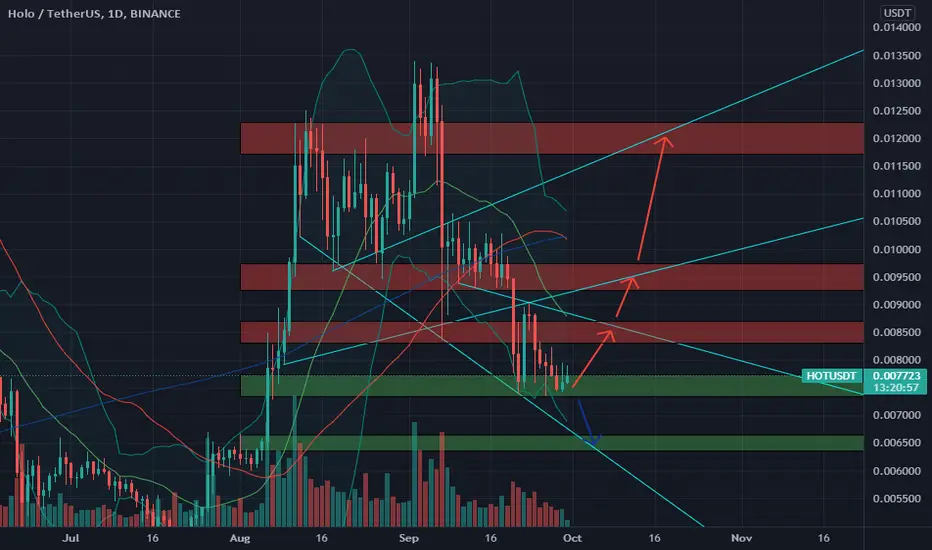
🆓Holo (HOT) Sep-30 #HOT $HOTThe decline was failed in breaking down the 0.0075$ zone and this zone becomes its strong support zone now. HOT could move towards 0.0085$, 0.0095$ and 0.012$ zones in October.
📈RED PLAN
♻️Condition : If 1-Day closes ABOVE 0.0075$ zone
🔴Buy : 0.0075$
🔴Sell : 0.0085$ - 0.0095$ - 0.012$
📉BLUE PLAN
♻️Condition : If 1-Day closes BELOW 0.0075$ zone
🔵Sell : 0.0075$
🔵Buy : 0.0065$
❓Details
🚫Stoploss for Long : 10%
🚫Stoploss for Short : 5%
📈Red Arrow : Main Direction as RED PLAN
📉Blue Arrow : Back-Up Direction as BLUE PLAN
🟩Green zone : Support zone as BUY section
🟥Red zone : Resistance zone as SELL section
🅰️A : The Close price of 1-day candlestick is Above the zone
🅱️B : The Close price of 1-day candlestick is Below the zone
HOT/USDT falling wedge patternGood day ,
as you can see in the chart , falling wedge pattern completed waiting for confirmation and will go up .
Thanks
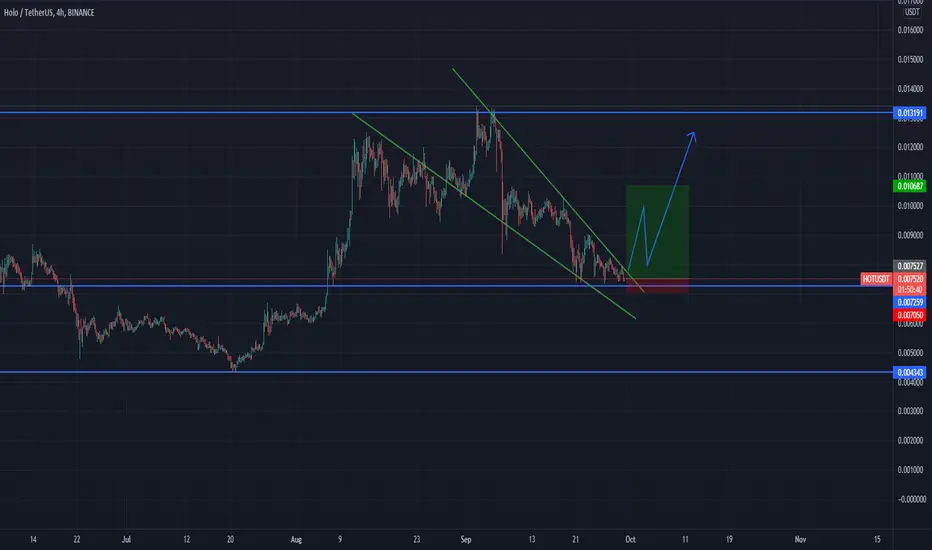
hot usdt 4 h charthot usdt 4 h chart
descending wedge formed
good support at blue box
you can enter after break the trendline

HOTSDT: BREAKOUT RISING WEDGE AGAIN, ANOTHER SHORT OPPORTUNITY?Hello Fellow Traders, here's your free outlook for HOTUSDT! Don't forget to smash the LIKES, COMMENT, and FOLLOW button to support the channel :)
HOTUSDT already brokeout from the rising wedge pattern. Breakout of rising wedge pattern could indicate the possibility of bearish movement. The momentum indicator crossed downward below the zero area, it signify the potential downside movement ahead.
The roadmap will be invalid after exceeding the resistance/target area.
DISCLAIMER:
This is only an outlook, not a recommedation to buy or sell the cryptocurrency

HOTUSDT: RISING WEDGE, BEARISH BIAS/MEGASIDEWAYS AHEAD?Hello Fellow Traders, here's your free outlook for HOTUSDT! Don't forget to smash the LIKES, COMMENT, and FOLLOW button to support the channel :)
HOTUSDT already brokeout from the rising wedge pattern. Breakout of rising wedge pattern could indicate the possibility of bearish movement. The momentum indicator starts crossing downward to the zero area, it signify the potential downside movement ahead.
The roadmap will be invalid after exceeding the resistance/target area.
DISCLAIMER:
This is only an outlook, not a recommedation to buy or sell the cryptocurrency

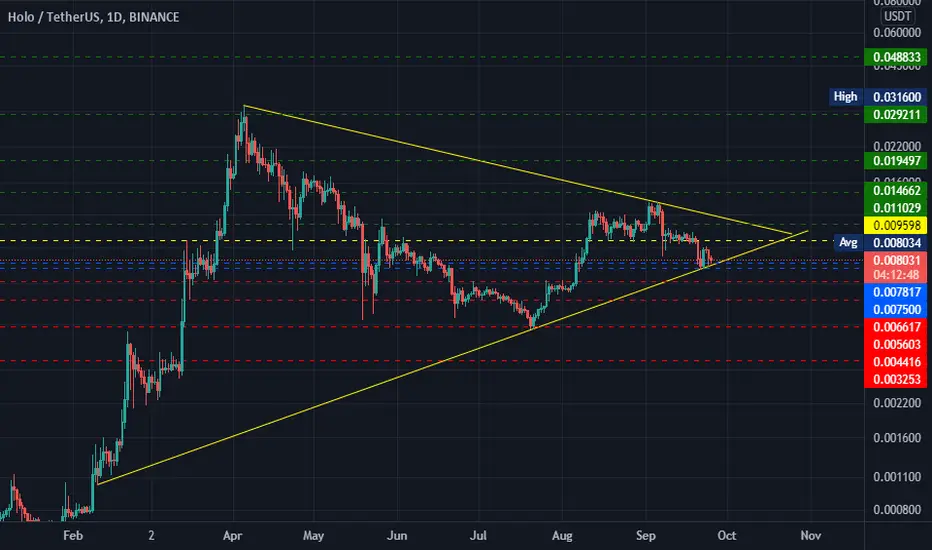
HOTUsdt (Buy HODL Wins)When this triangle BREAK??????!!!
you can buy this and save last wins good profit
this coin have good chanse for big profit
good fundamental and can move up big
remember BTC can 1 time more Dump but after that Holo move up fast.
Again, China caused a slight downfall with its outspoken news about the ban on cryptocurrencies, but those like me who have known for a long time, China gives this fake news every year.
So do not worry novices, we will go back up.
GL
EntryPoint:
0.007817
0.007500
Supports:
0.006617
0.005303
Resistance:
0.009598
Trgets:
0.011029
0.014662
0.019497
0.029211
0.048833
For HODL:
0.093838
0.131958
0.215232
GL
remember should patient rashppl lose money to patient ppl
GL
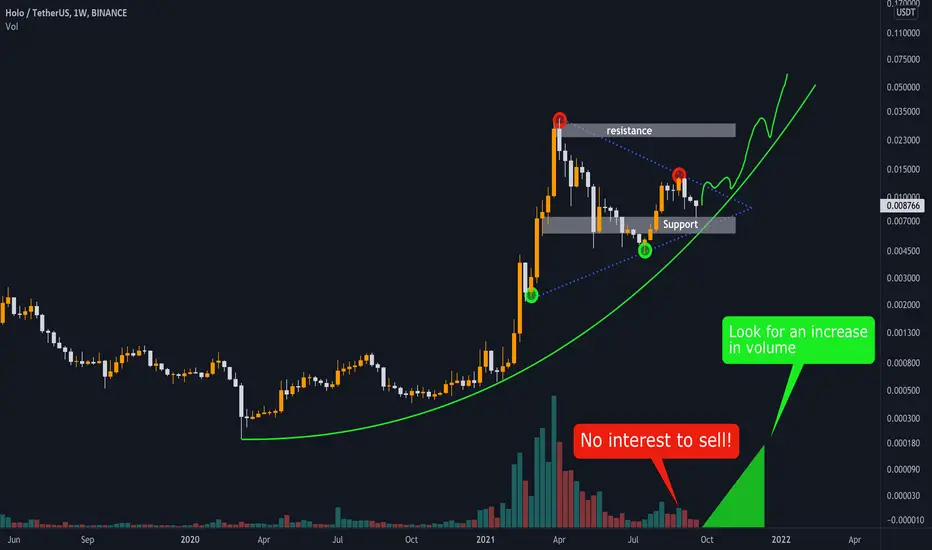
Holochain Looks Bullish!is consolidating inside a Symmetrical Triangle. The low volume on the recent dip is bullish. It indicates that holders are not interested to sell at these prices. I believe this one will follow the green parabola next months. Look for INCREASING VOLUME to buy
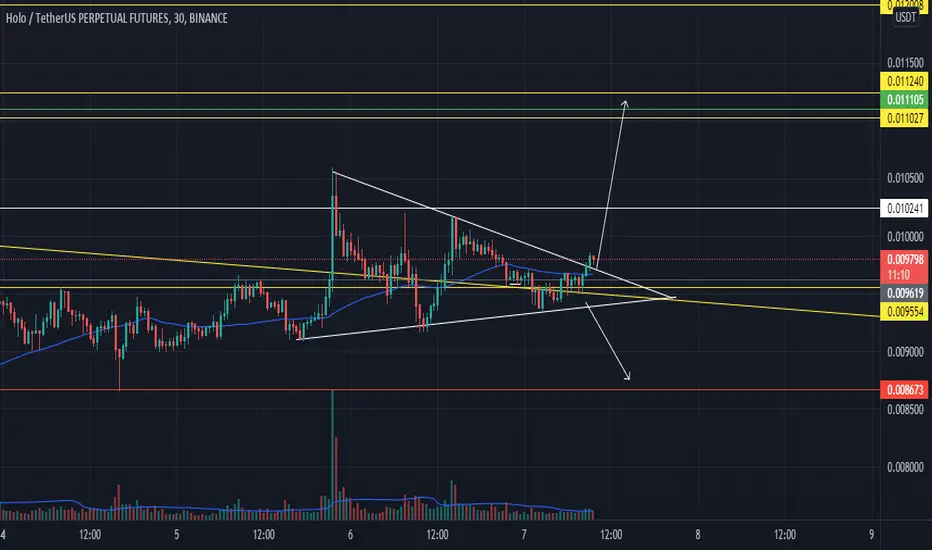
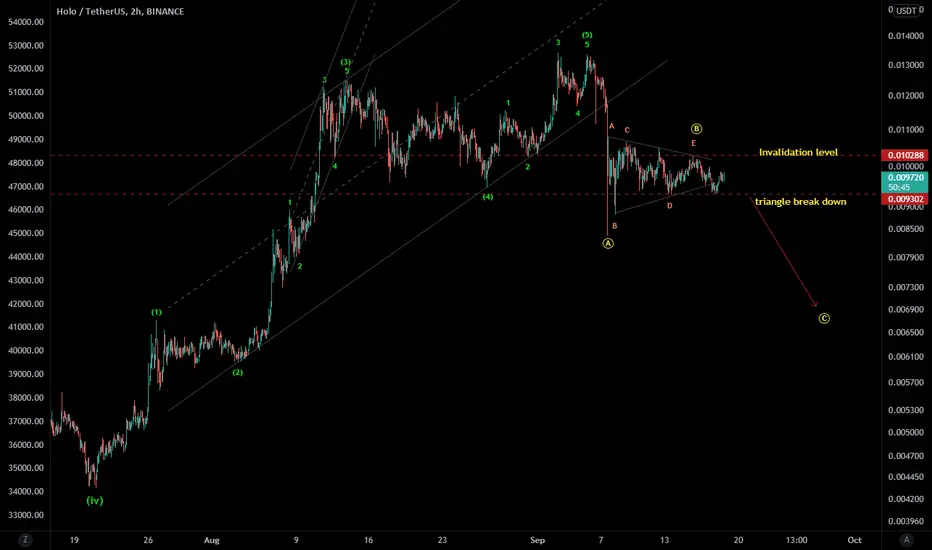
HOTUSDT - EW analysis - triangle in correctionExpecting triangle to break down and will start C. It will confirm the pattern below 0.0093. If it breaks below 0.0093, then only it should go down with invalidation level above 0.01029. But in case of it breaks above 0.01029 without breaking below 0.0093, then it can extend higher in abc pattern within B wave up before turn lower again.
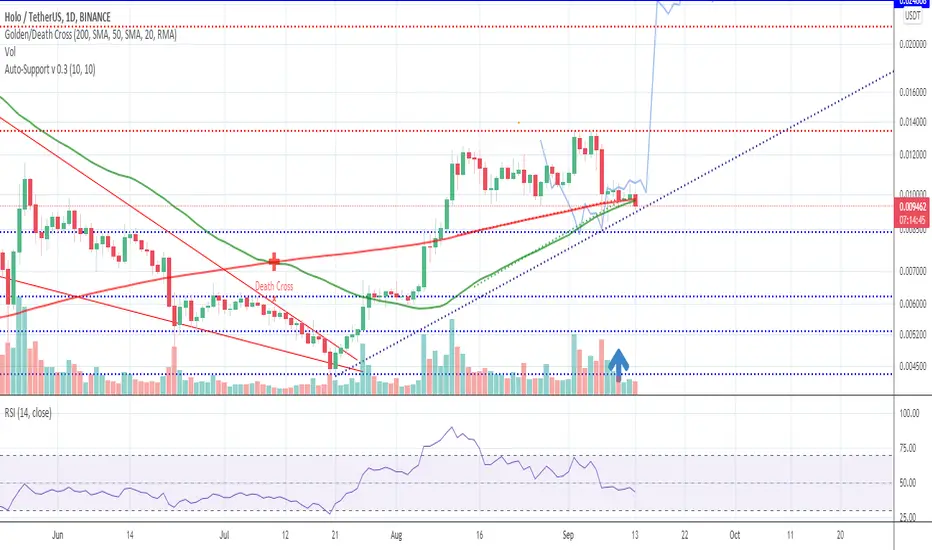
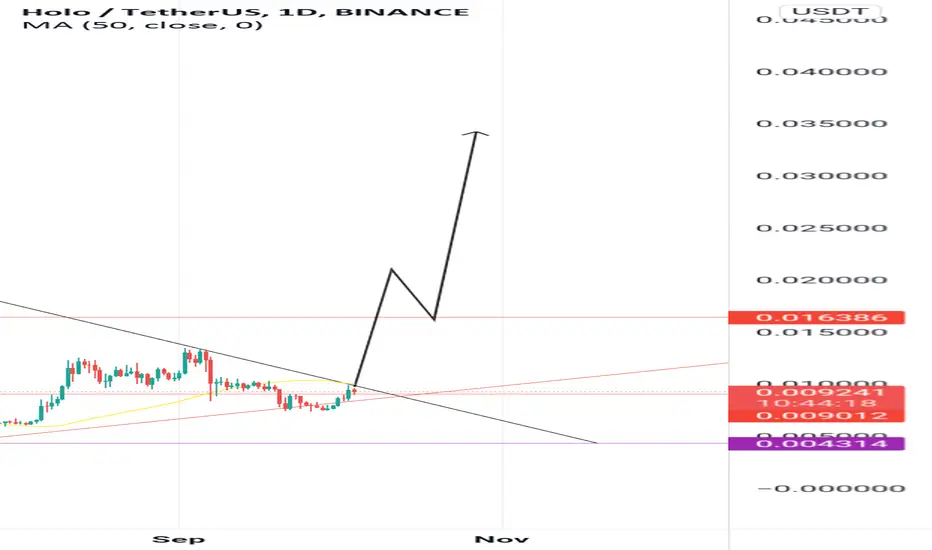
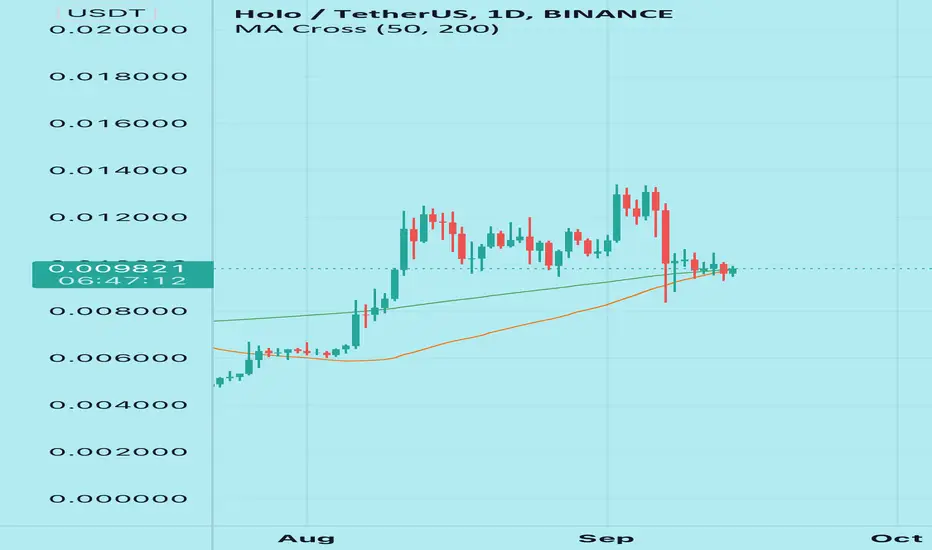
HOTUSDTHOT broke downtrend now retesting, golden cross is forming on the daily. Buy and hold, wait for 0.03-0.05-0.10 to take profit!
HotUsdt rdy for goingup break resistancHolo can going up soon and break area resistance
you can see hard resistance area on chart need break that for start moving and you can ente rposition on entry point can got good prfit but little need patient and wait
GL
Supports:
0.009221 >>> EntryPoint
0.008215
0.007315
0.006202
Resistance Area can see on chart that is hard resistance but can break this on this week and move up but we should wait see BTC Move.
Resistance:
0.010638
0.010919
Targets :
0.012864 > This is last Resistance
0.014686
0.016763
0.020238
0.025707
0.034850
0.040847
0.051294
Rememebr this is your choise but for profit need little wait
GL

24h till liftoffHolo (HOT) sideways movement has put it in a position of hitting a golden cross on the daily.
If it can push past resistance @ 0.0133, it has a clear route back to ATH