HOTUSDT.P trade ideas
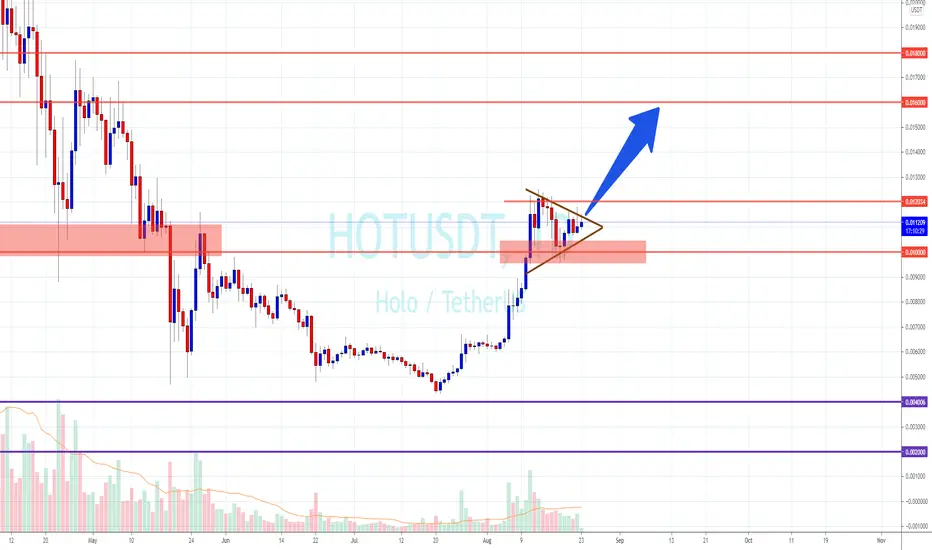
HOT , ready for a breakout?had a good rally back to July and August,
currently looks like going into consolidate with pennant alike candle.
pending for breakout above 0.012. next level would be 0.016 , 0.018
HOT UPDATE - Reasons to be more than bullishHOLOCHAIN EFFECT - Google the 1T+ company adopts Holo's strategy when 98 Chrome vulnerabilities hit headlines
-Google adopts persona's as buffers to identity to keep pace w/ a rapid shift in industry practices & standards... they are shifting away from servers because of Holochain. Expect more companies to follow suit in switching to serverless reduced attack surfaces.
-HOLO is unique because they represent a quantum leap in innovation... if the rest of the world follows suit. In 6-24mos the world could be free of malware, and significant cyber threats. Companies are actively checking their systems for spyware. eg. I've alerted 1 top 10 trading platform about kaseya... I've also alerted an Indonesian exchange about "unusual behaviours" observed in their app during 6 month dormancy oberservation... Even state actors like China are getting desperate
-Spain shifts 3000-6000 workers to a 4 day work cycle... if #Holo ends up at peak hype cycle, expect part of the adoption strategy to encompass intersectionalities of interest in Spain. Where the Gov. is investing 50M Euro's to cover the transition at no loss to the employer. In 3 yrs I predict we see a boom in Spains economy when they adopt France's strategy


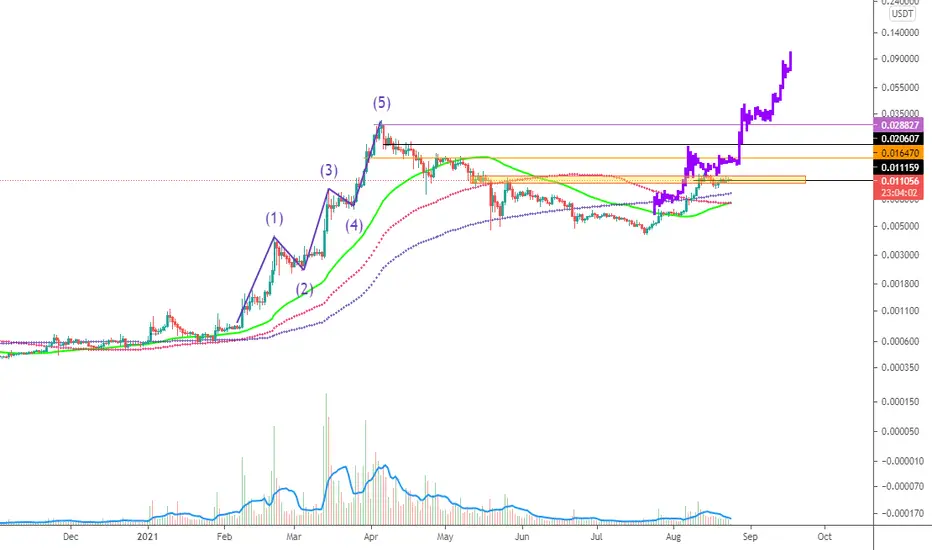
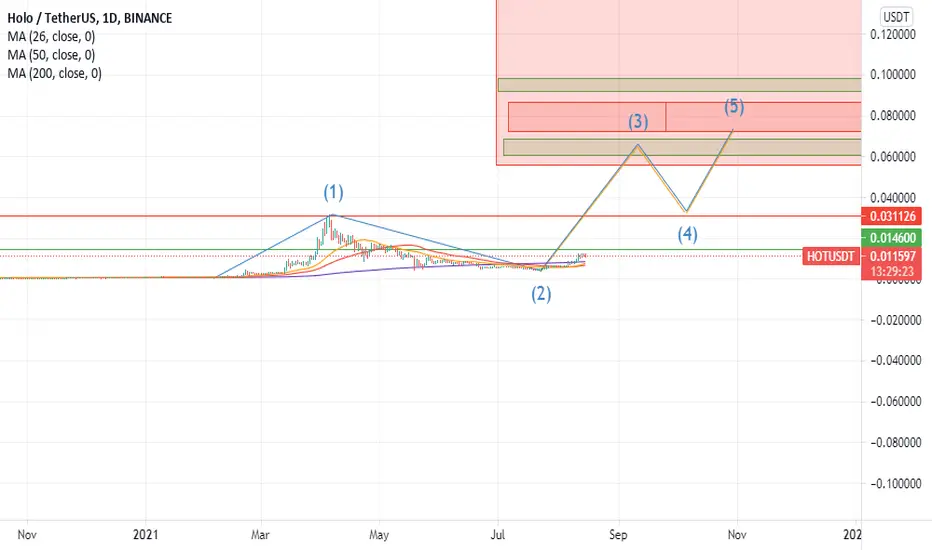
HOT set for potential breakout!Please refer to chart for analysis. Based on the % gain during the last bull run, we can expect to go up to the 70 cents.
Buy between 0.0118 and 0.015
Leverage 20x
TP 1 - 0.144
TP 2 - 0.157
TP 3 - 0.171
Additional confirmation:
1. Fibonacci time zone
2. Trading above 20 day EMA on current uptrend.
3. Buyer VOL has been low the past few days, yet Seller VOL is not dominant.
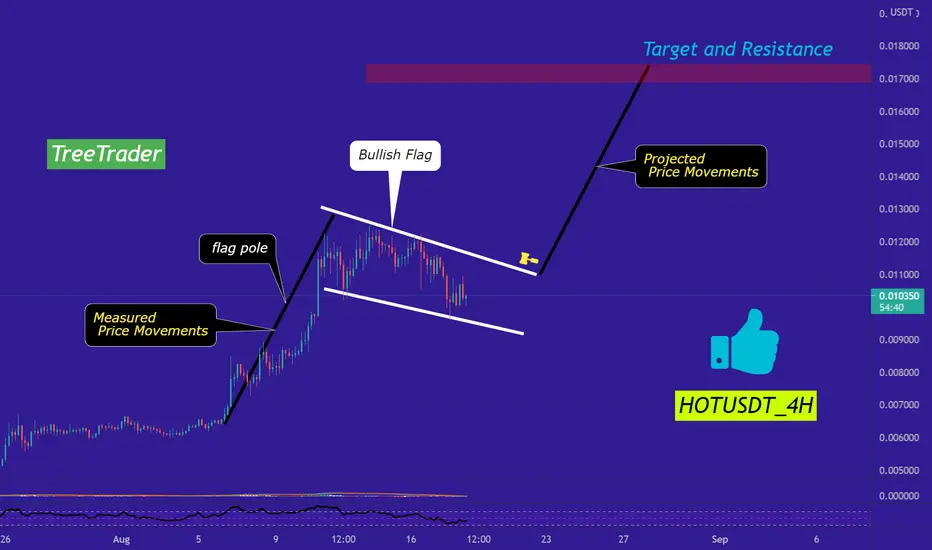
Holo flies with the bullish flagThis chart has been created for education & entertainment and this is not a trading advice
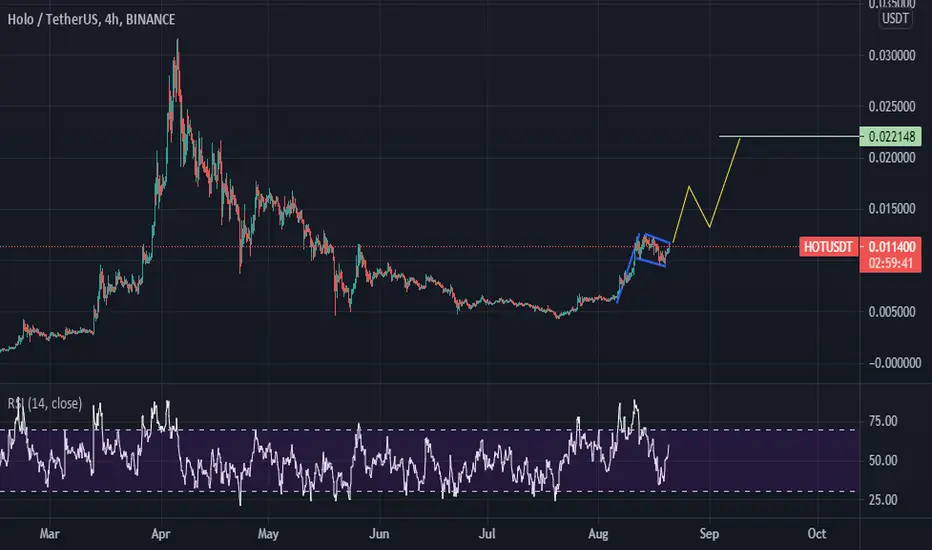
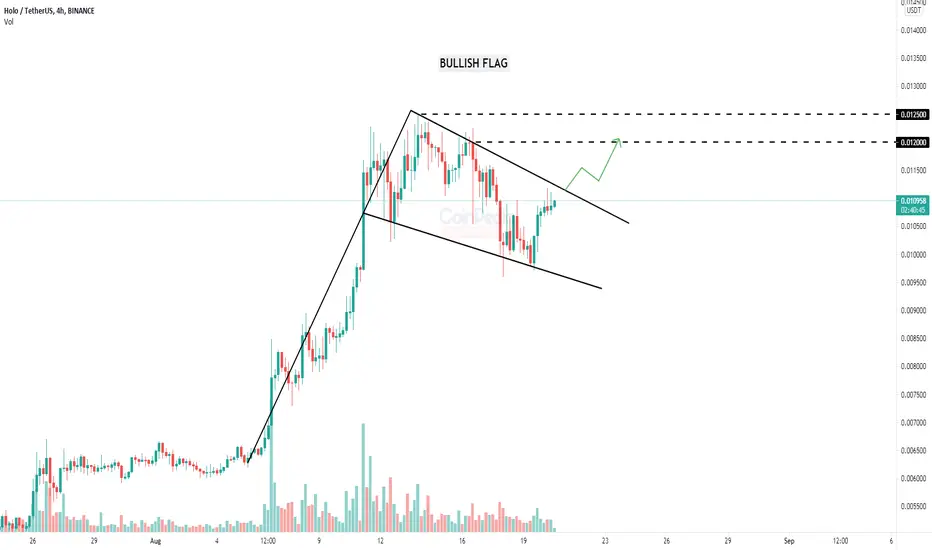
Bullish pattern in Holo* Holo in 4H time frame forms a Bullish flag pattern, which is a trend continuation pattern.
* Bullish flag occurs during the bull run when the price consolidates between two parallel trend-lines opposite to each other for a period of time before it continues it's rally.
* If the price breaks the upper trend-line of the pattern we can see a rally till $0.012500.
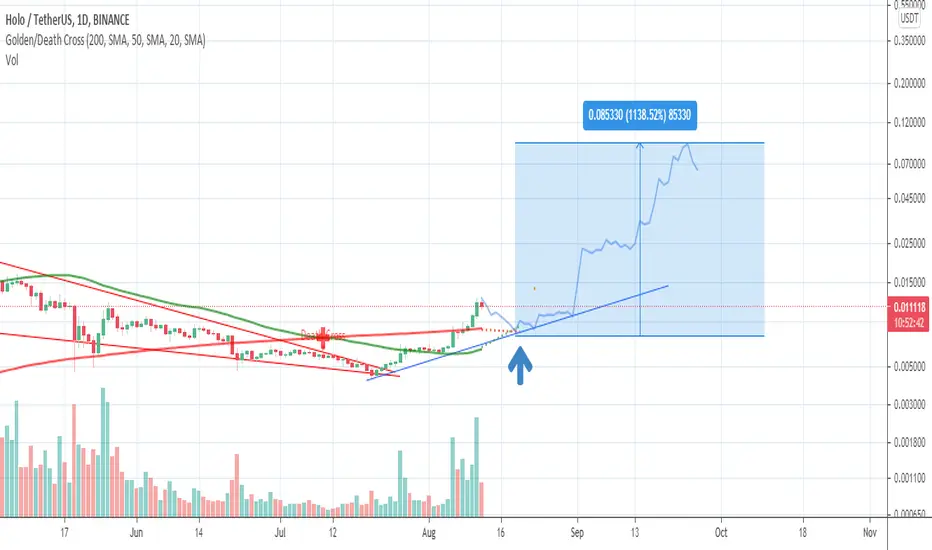
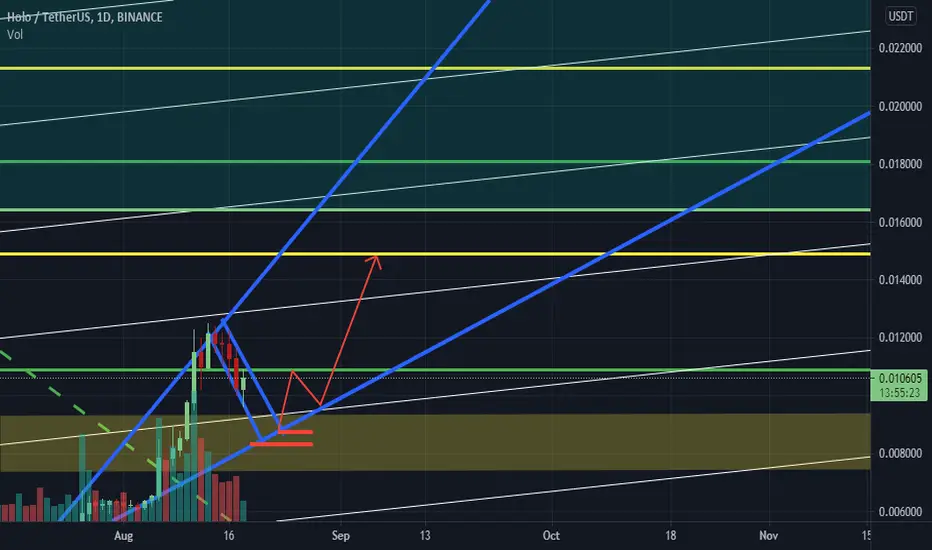
Small Pull Back and 1000% pump possibility Holo has recently pushed out of the huge falling wedge since the push from the patent announcement and is showing very bullish signs.
Now hitting a key resistance level and could fall to meet uptrend and the 50/200 MA, bouncing off the MA and forming a golden cross
This should create momentum to just shy of the heavily speculated 0.10 mark giving a 1000% gain
HOTUSDT Technical Analysis
Welcome back Traders, Investors, and Community!
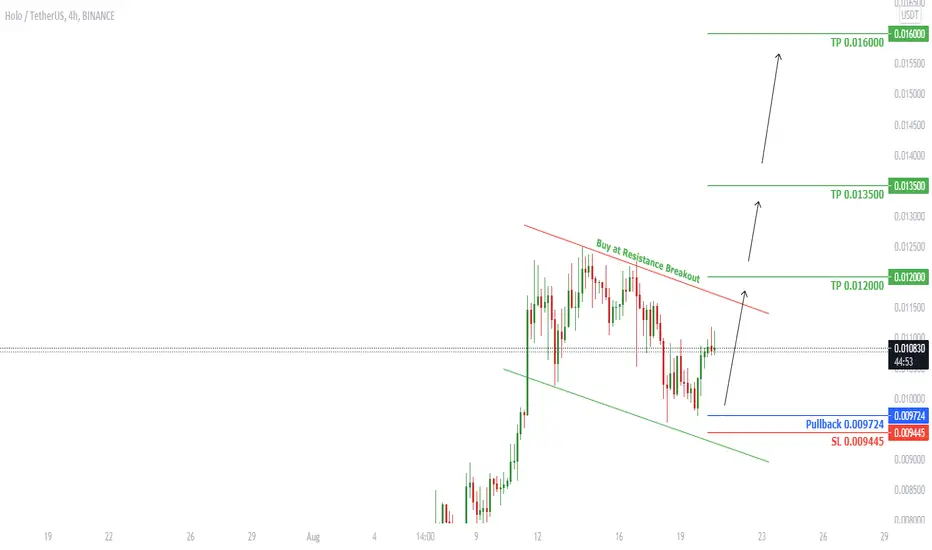
HOTUSDT on h4 has formed a Flag. After breakout we can expect the price to go higher. There might be a Pullback before it goes up.
⬆️Buy at Resistance Breakout or Buy at 0.009724
⭕️SL @ 0.009445
✅TP1 @ 0.012000
✅TP2 @ 0.013500
✅TP3 @ 0.016000
Check the Links in Description and If you LIKE this analysis, Please support our page and Ideas by hitting the LIKE 👍 button. ❤️ Your Support is really appreciated! ❤️
Traders, if you have your own opinion about it, please write your own in the comment box. We will be glad for this.
Feel free to request any pair/instrument analysis or ask any questions in the comment section below.
We will have more FREE forecasts in TradingView soon
Have a Profitable Day
HOTUSDT see and watch :)
Pulbeck has reached the desired support area and is ready to go to the next goals ...

HOTUSDT Flag Pattern waiting for breakout.as we know that the new FLAG pattern is confirmed if there is a breakout of the upper resistance of the created channel pattern, if there is none, the flag pattern is invalid, so patience is needed.
HOT's Gonna Increase soon.Hi every one
HOLO / TETHER
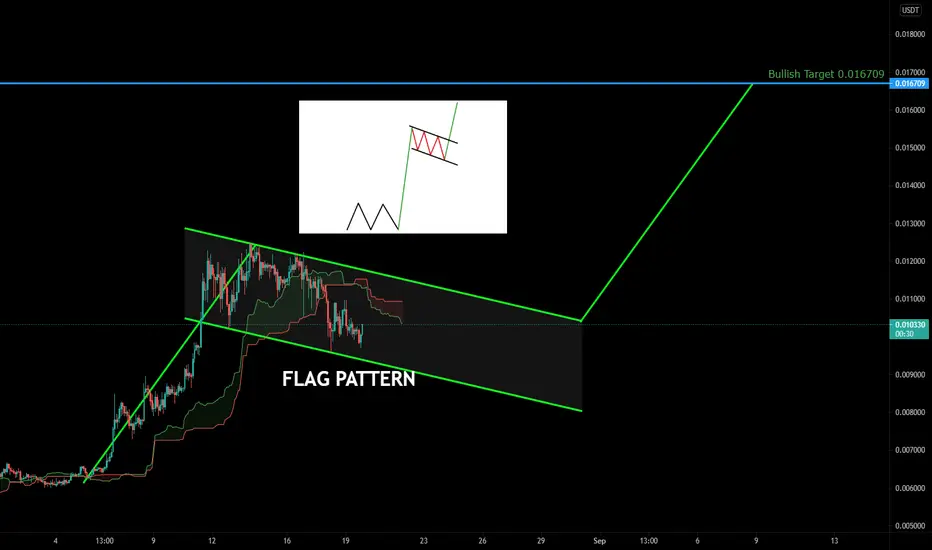
HOT/USDT is In a Bullish Flag! the pattern has not been Broken by the Price yet but when It happens The Price can Increase as much as the Flag Pole!
summery:
-HOT's Bullish Flag can Increase the price as much as the Flag Pole.
Things can change...
The markets are always changing and even with all these signals, the market changes tend to be strong and fast!!
💎Traders, if you liked this idea or have your opinion on it, write in the comments, We will be glad.
Thank you for seeing idea .
Have a nice day and Good luck
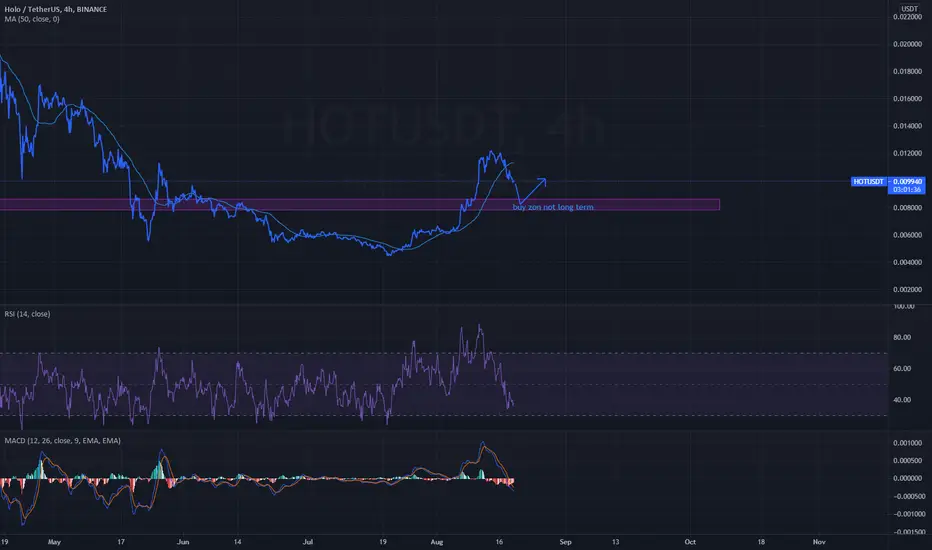
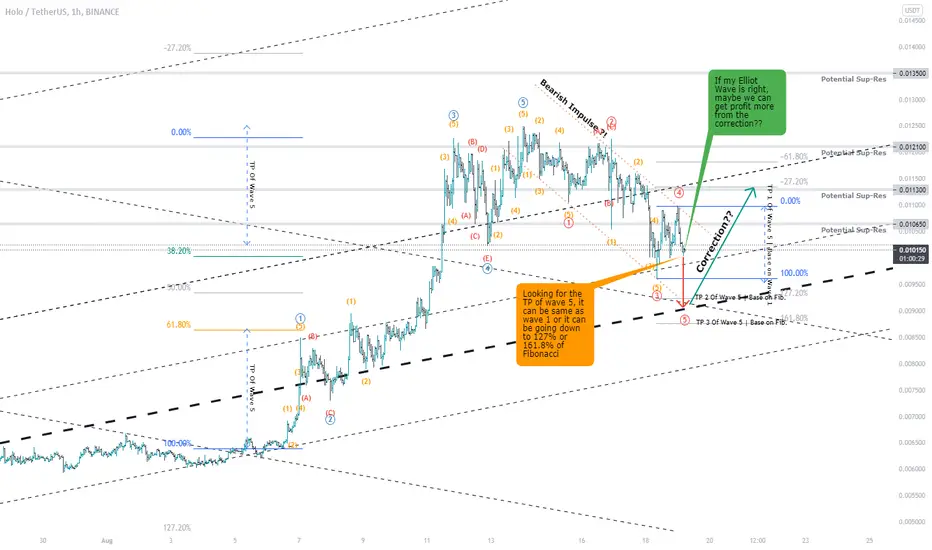
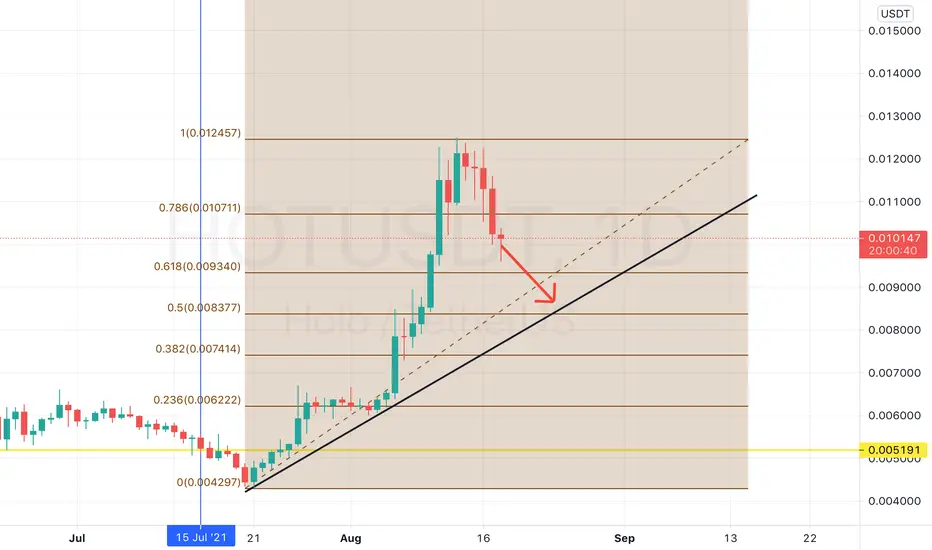
HOTUSDT Become Bearish Impulse ??!!
I try to read the chart with EW pattern and I get like what you see on my analytic, if I'm right, maybe we have to wait until the chart pullback and make a profit from the correction part, and the pullback i think happens at level 0.009 which is on my big trendline area.
Disclaimer ON
this chart is not a signal you should follow, I just want to share what I think, if I made a mistake please let me know in the comments section
hot/ usdt trend new updateit seems that correction will continue till 008-009 then impulsive wave gonna be rise again.
"not suggested to buy or sell"
HOT USDT pair Thought Process 25% Gains Coming?This is my thought process on HOT.
I think Price Action (PA) should move to the up side.
25% Possible
This is not financial advise, this is for entertainment purposes only.
Thank you,
Trade Intuition

Hotusd ,this is the time for jumpAll wavs shows jumping is coming,i personally believe hot can go for 0/2 by end of the year
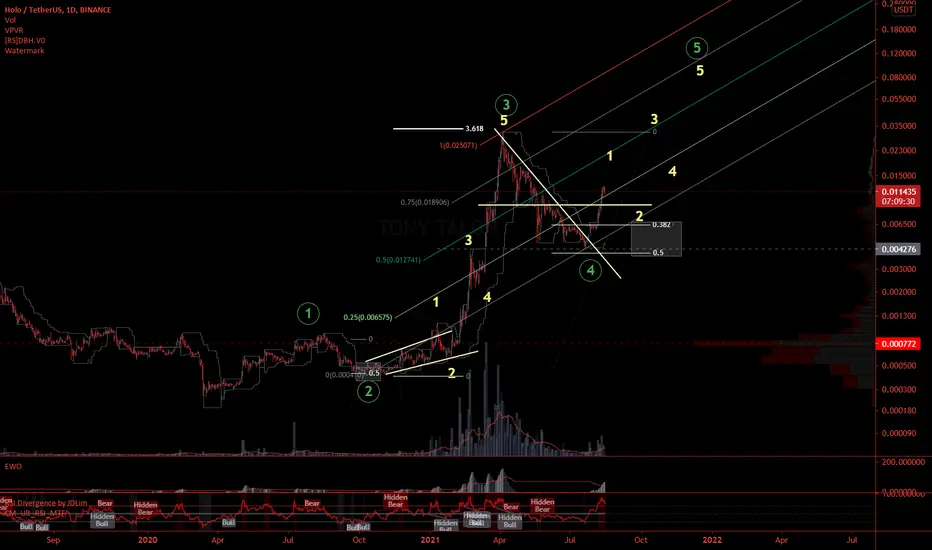
$HOT #HOT #Holo quickie chart by @cryptoKnee TonyTalonQuick look at Holo log. Will be watching to see if these supports hold. Looking good for an impulse in the works, could be an A , could be a 1 of the wave 5 if it completes as an impulse.
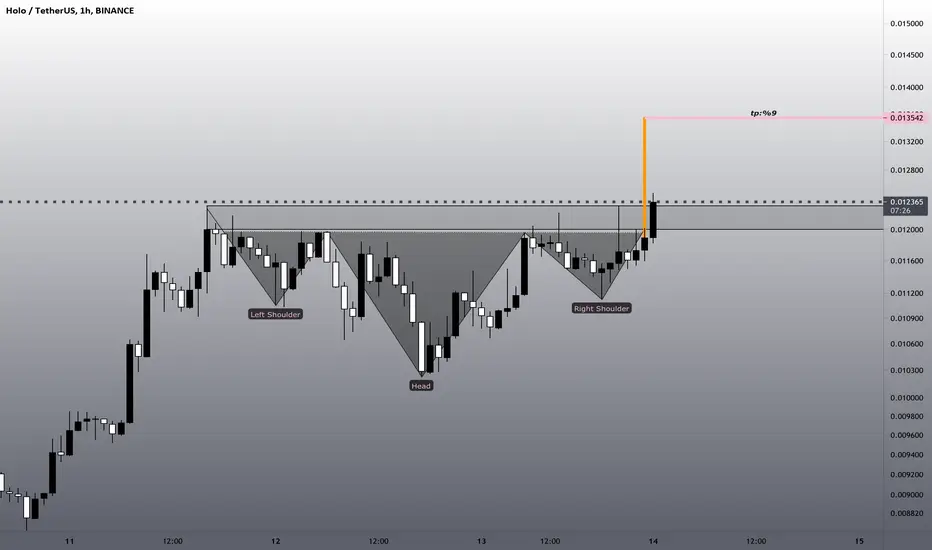
hotusdtaave from my trades today.. there is a nice tobo formation. i think you will get the target.. i always keep an eye on btc, if btc breaks, i will terminate my position no matter what.. good luck..
please increase my motivation with likes or comments.. let me share my trades
Hot is ready to go higherHot is ready to go higher due to the fact that price reached resistance zone and consolidating there, price can break it later and go up to resistance level.

$HOT/USDT Symmetrical Triangle PRIME FOR PUMPHOLO / TetherUS looking primed for a breakout in this symmetrical triangle. My SWRSI showing great signs.
