HOTUSDTAccording to the situation of the chart, it can be predicted that if the resistance is broken, it is ready to reach the target of 0.1
HOTUSDT.P trade ideas

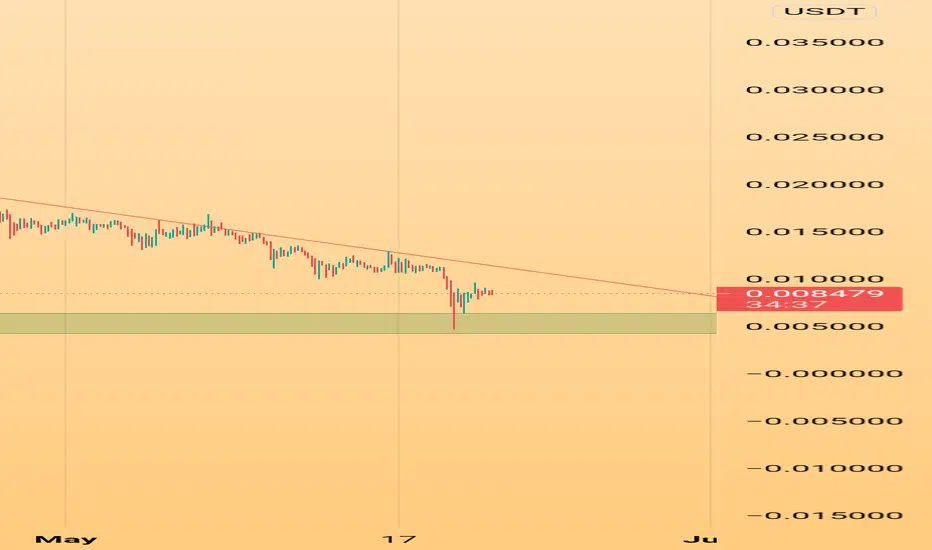
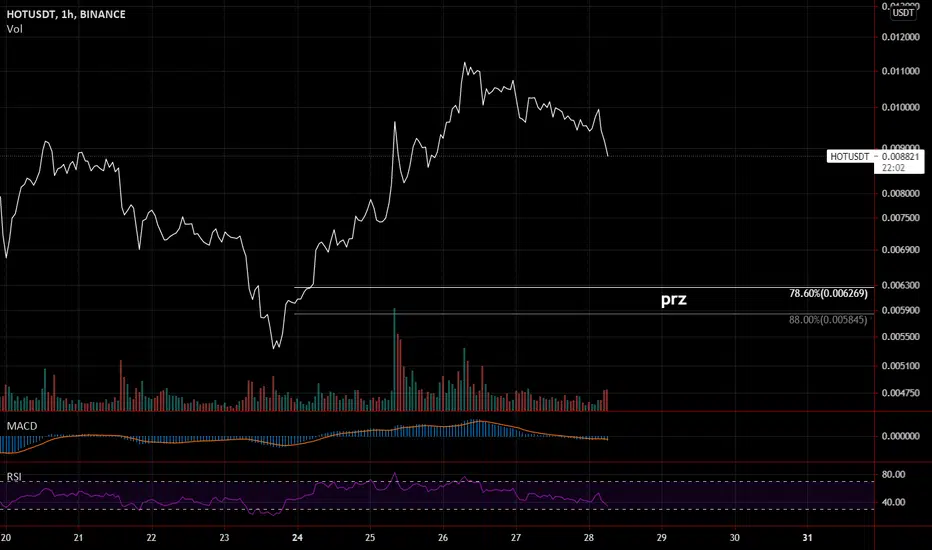
New update for HOTBreak minor resist for bullish continuation in short term + Forming bullish pennant. Goodluck traders #nfa
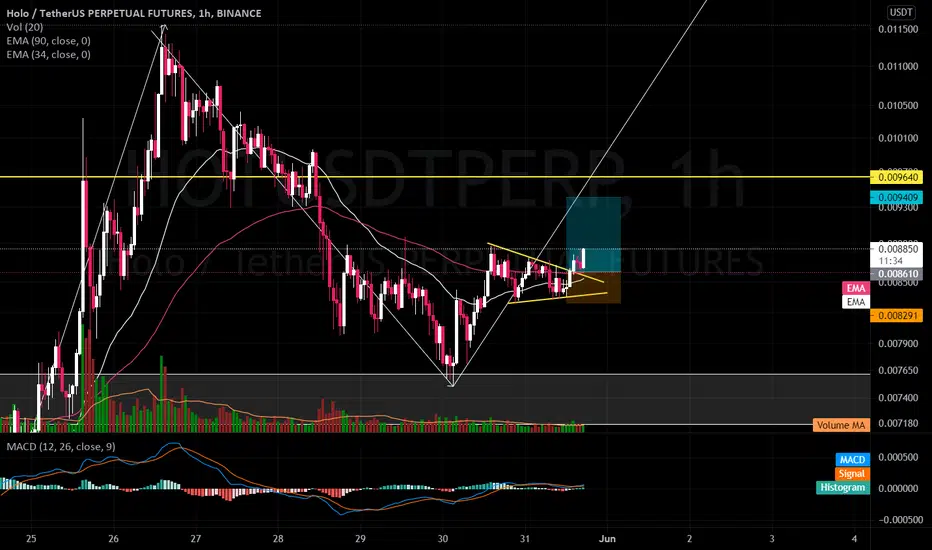
HOT POTENTIAL QUICK GAINDepends On Fed BTC ready to recover . Also Hot broke downward trend and ready to fly .
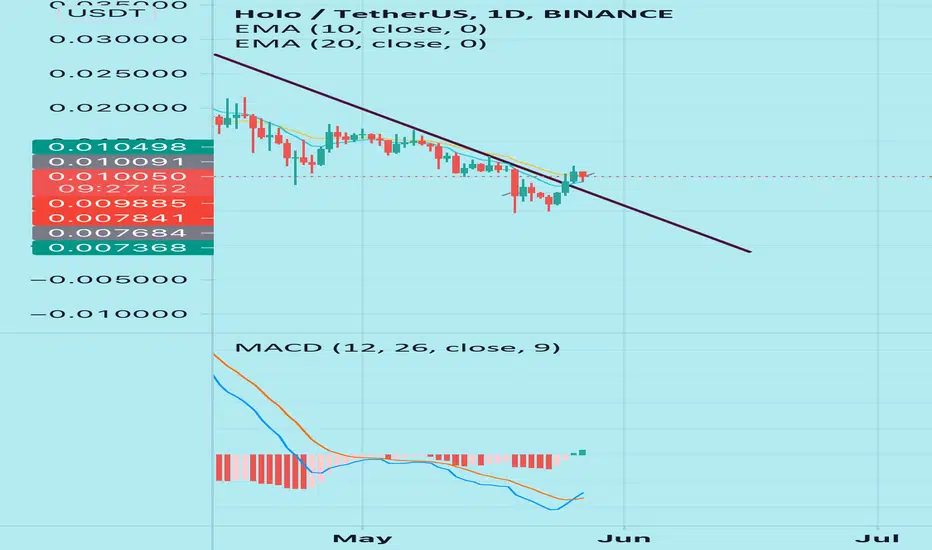
HOTUSDT TREND BROKEN & MACD CROSSHolo broke up from the downtrend, and a bullish cross on the MACD! Buy.
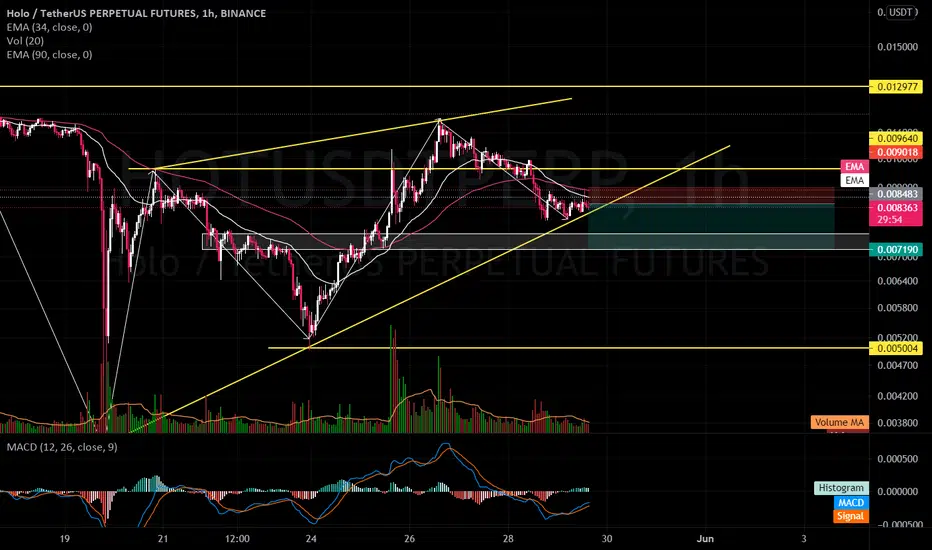
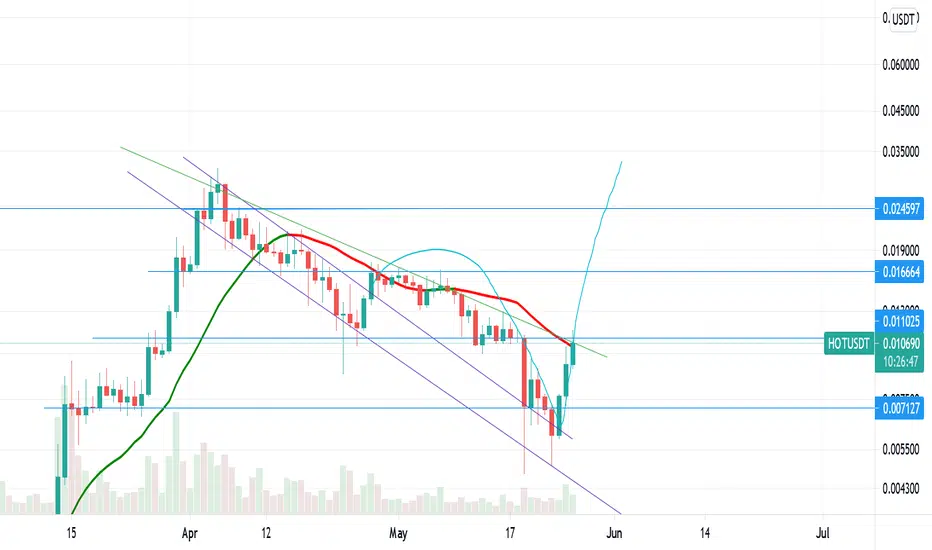
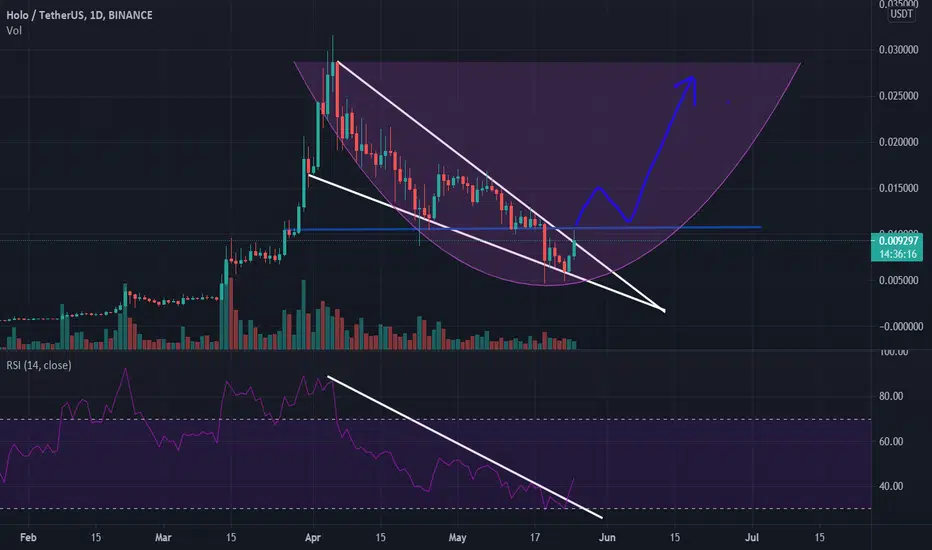
Holo turning possitive Holo is very close to breakout and as soon as it does that it will go directly up to re test its previous high
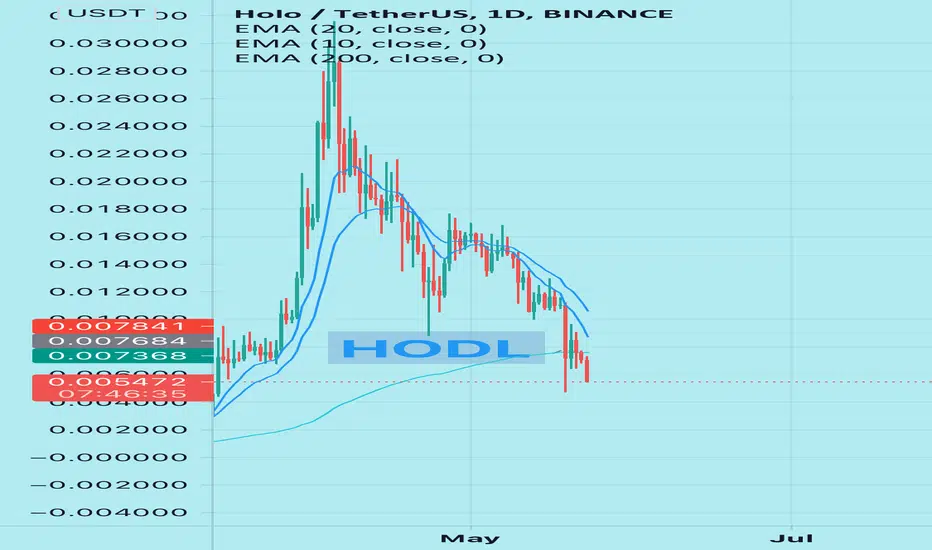
After breakout & retest is confirmed, on the way to new highsAs seen in the daily chart HOTUSDT broke out of the tunnel and yesterday and today it retestet and confirmed it. The way is clear for new highs.
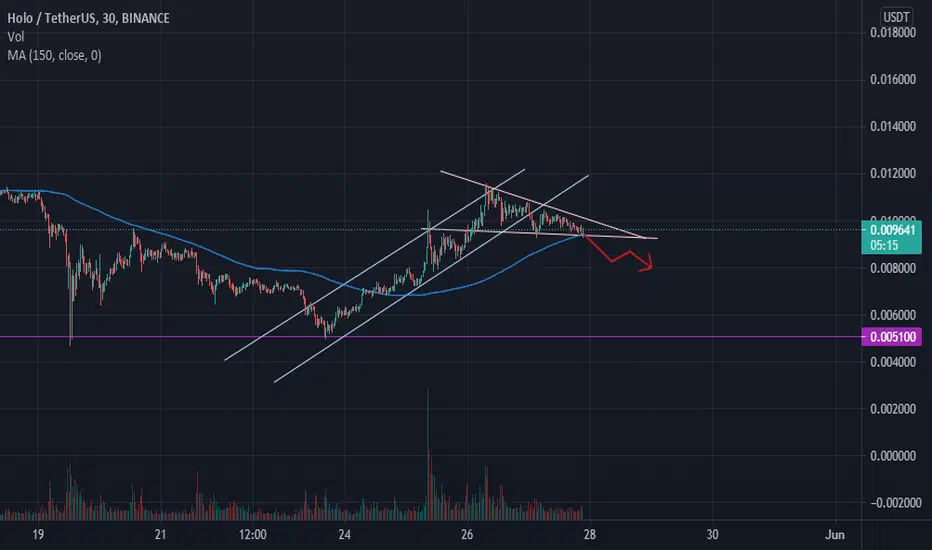
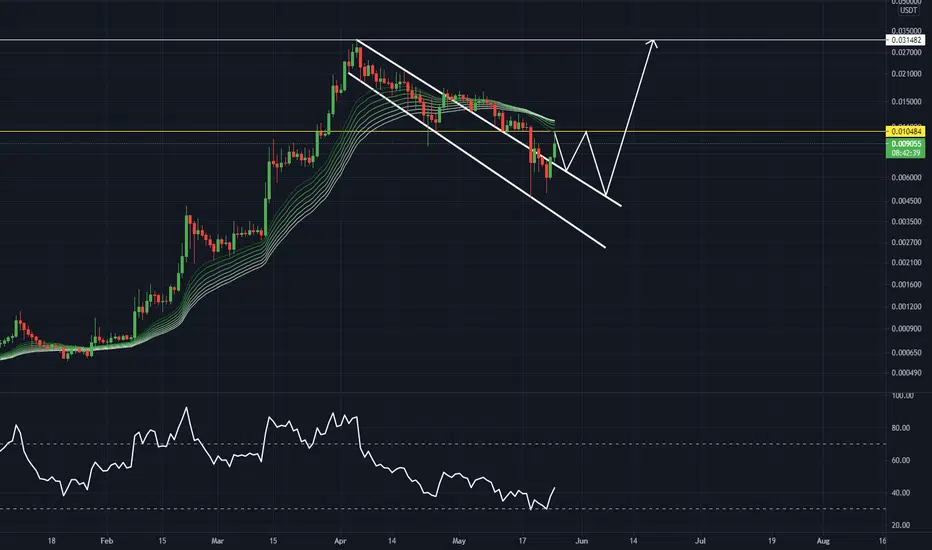
I expect something like the drawn line for the future.
HOTUSDT - Perfect breakout, 0.02 incoming Long falling wedge and breakout. Price target around 0.02$
HOT AT THE END OF FALLING WEDGE?!Hello, I am back with another idea on HOTUSDT pair, 2h time frame. BTC has really messed the market a bit, but HOT looks strong in the area between 0.0075-0.0092. Every time btc drops, HOT seems to hold strong. However, I will state two scenarios here, due to the fact that I am not very bullish on BTC yet.
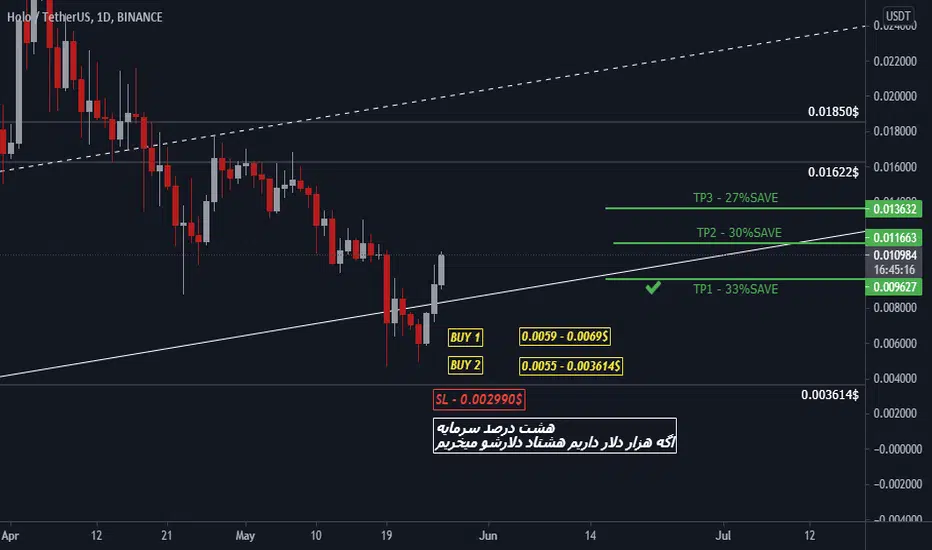
FIRST SCENARIO- We are seeing a falling wedge movement from HOT. According with the movement of BTC, it is forming a quite strong bullish scenario if BTC gets stable, starts to accumulate. However, it needs a breakout in the orange lines for a bit, and the moves straight up, to the ATH probably. However, TP1 for me is 0.011, TP2 is 0.016, so I can call it ready to move to another very bullish move to the ATH and more and complete it finally.
SECOND SCENARIO- If BTC drops to 35k and lower, I guess we will go straight to the black circle in the chart, and hopefully bounce back there, as long as it still remains in my chart, AREA WE MUST NOT CLOSE UNDER. It has been effective and I still think we can form a bottom there. However, be careful with your trading. Keep a close eye on BTC. And be smart and patient. Hopefully, HOT will bounce back strong. If you have any comment, you feel free to add anything. :)


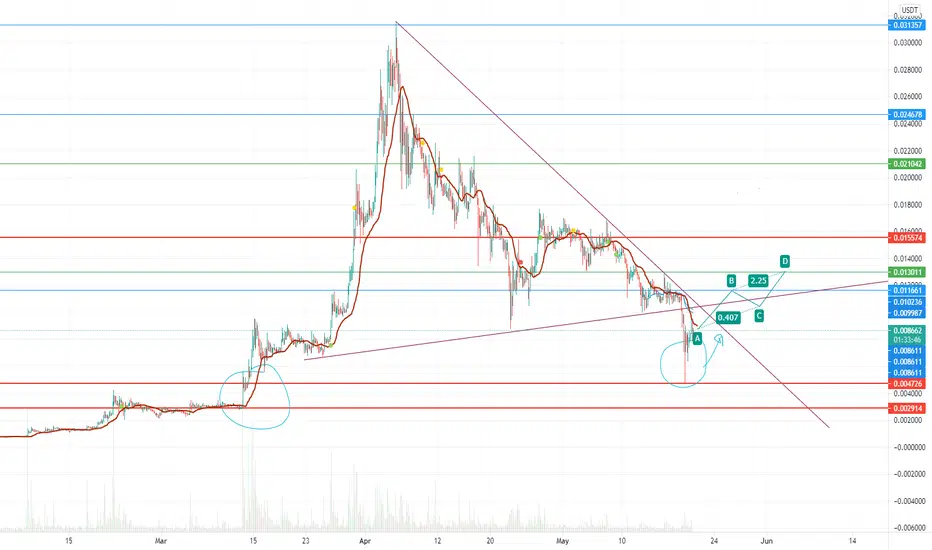
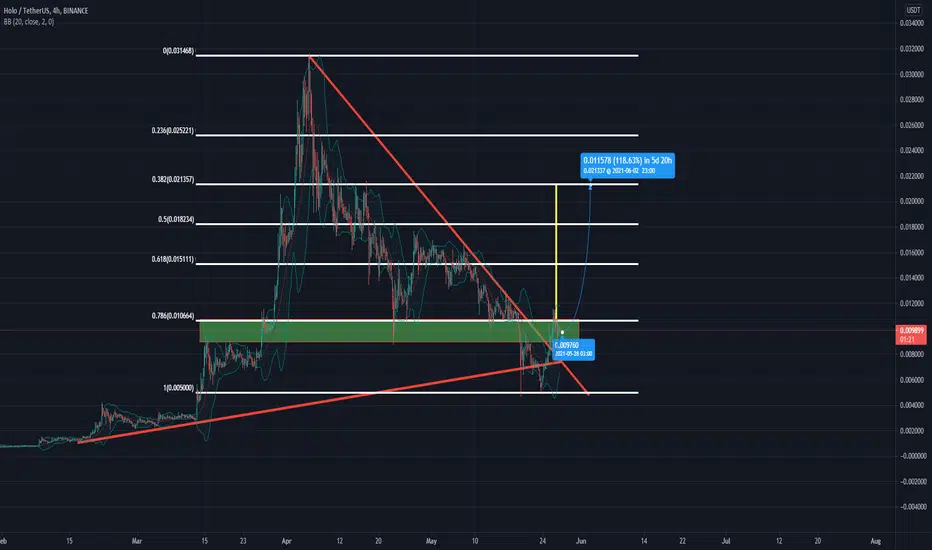
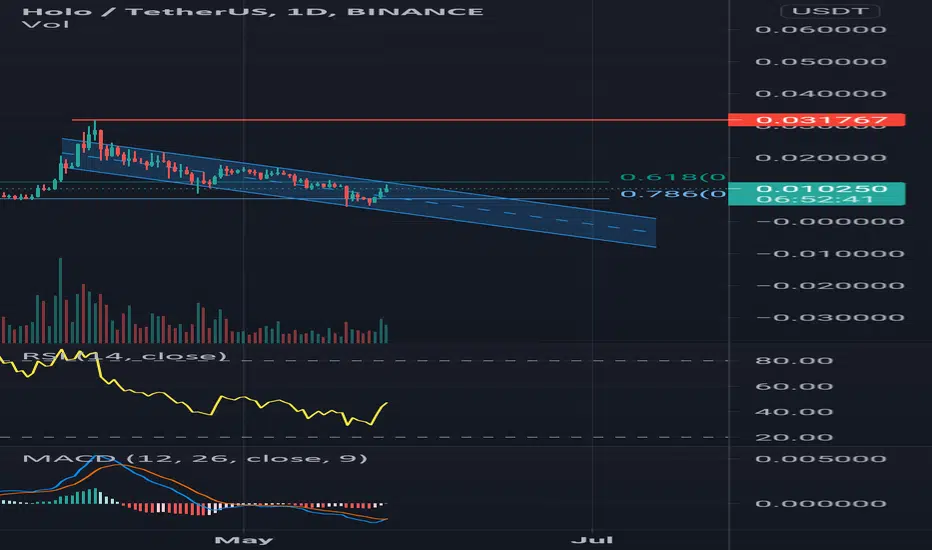
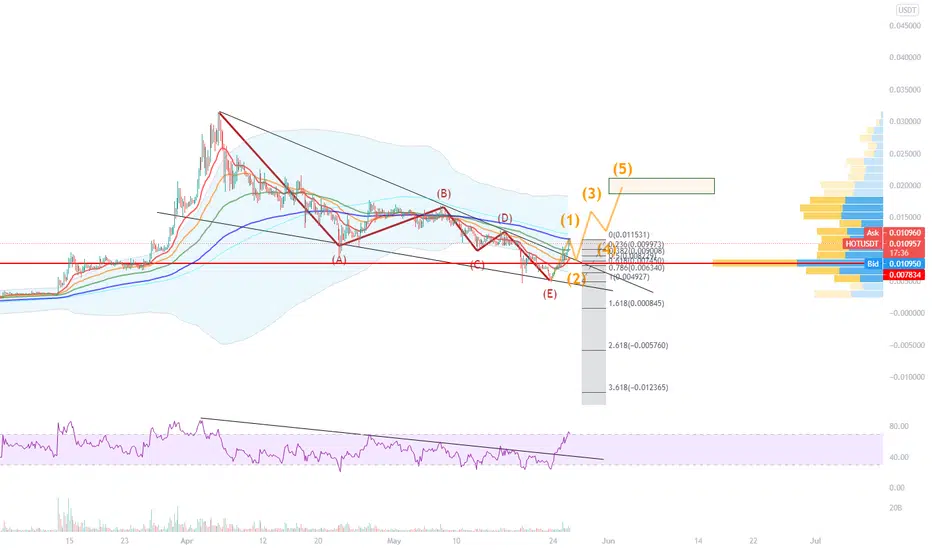
HOT possibly starting wave 5HOT seems to have finished the ABC correction of wave 4 and starting subwave 1 of wave 5 here. surely all depends on BTC to hold above previous low and HOT to to hold above previous low as well...
My reasoning behind this is that the correction has been deeper than the 0.786 fib level and that it has managed to not form a lower low during the last BTC dip. the correction on HOT is longer than most other coins that could still be forming wave B of the correction...
would wait for a pullback before longing here, because SL would have to be placed below swing low

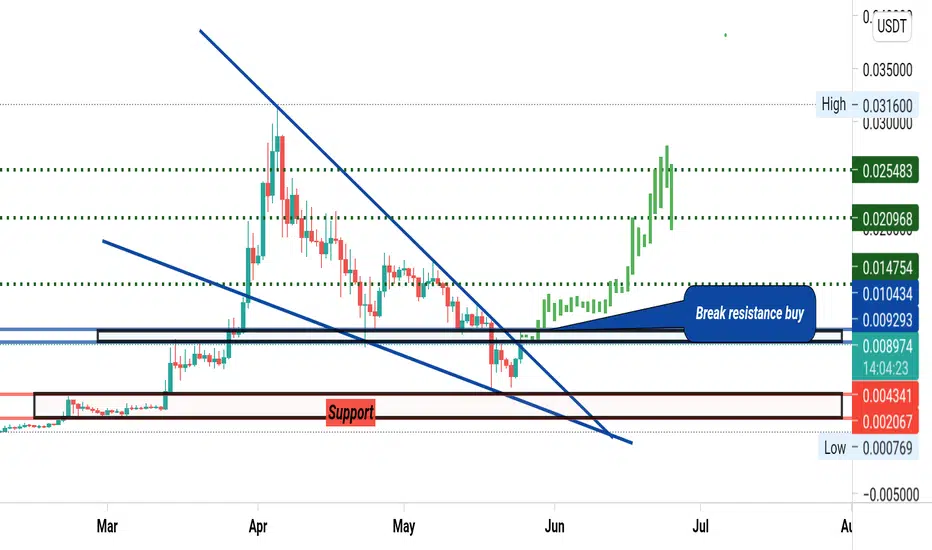
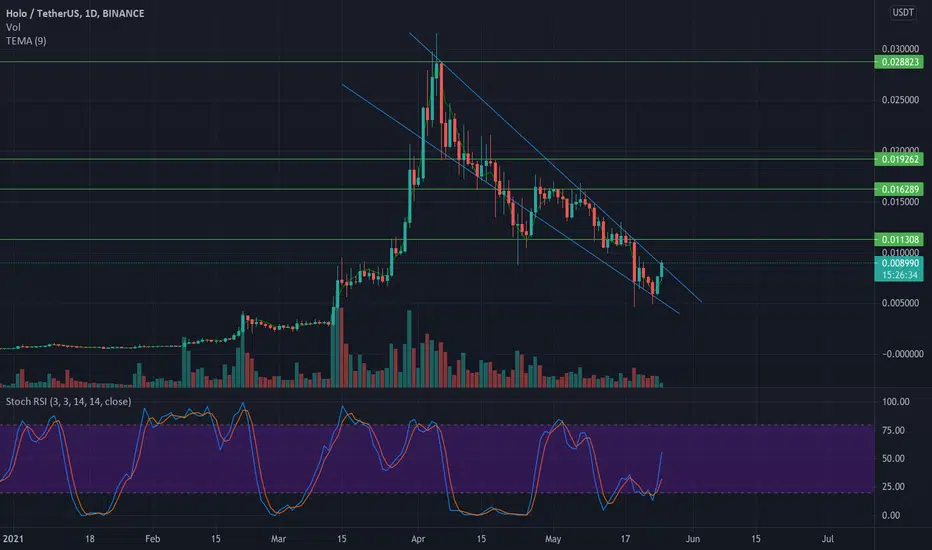
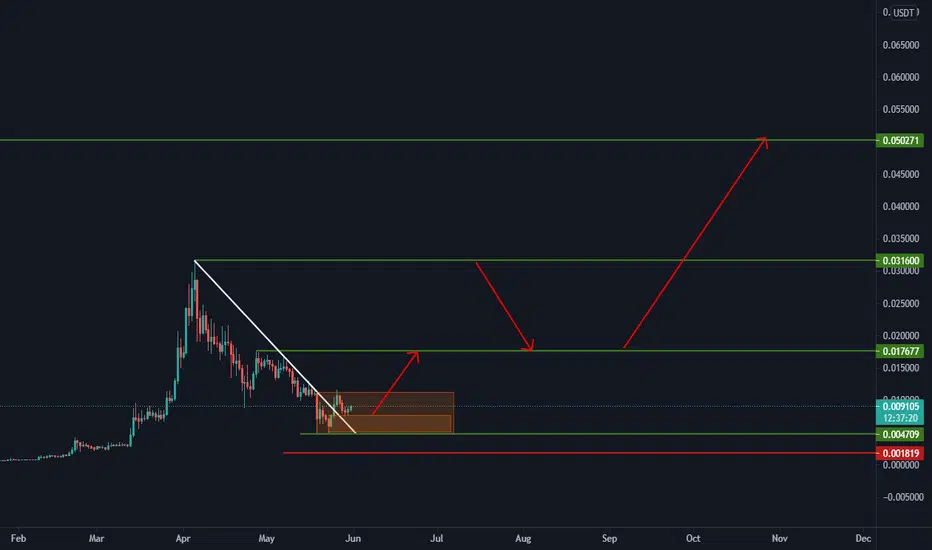
¿start of uptrend?As you can see in the white lanes there is a broken trend and it could be considered the start of a new trend.
The blue lane is a resistance lane that I hope it becomes in a lane support.
The RSI is increasing.
In 4 hour period we can see that SuperTrend determines a new buy zone.
Lets see whats going to happen.
If you liked the analysis leave a like it is free.
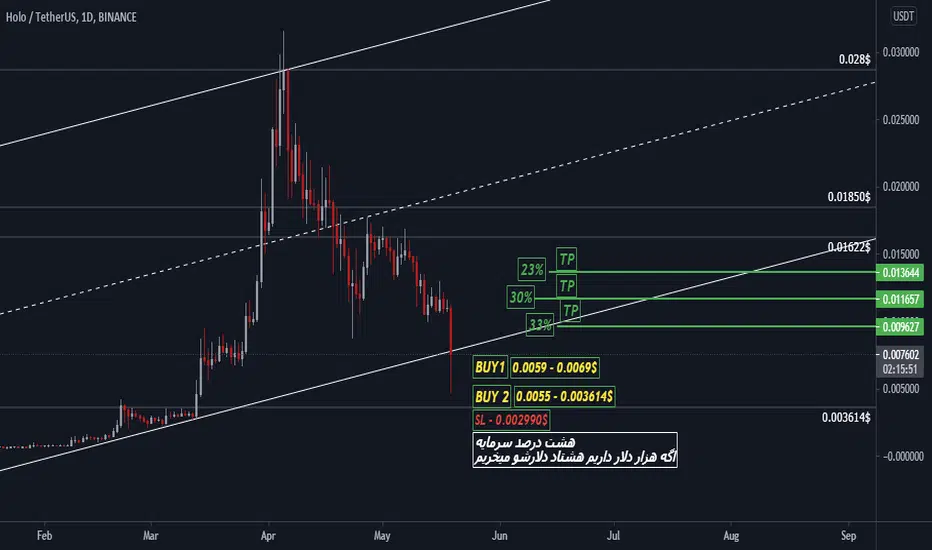
HOTUSDTHOTUSDT 1 DAY CHART!
GREEN = RECISTANCE POINTS!
CHECK ON THE 4H CHART THE CONFIRMATION FOR GOING UP!