HOTUSDT.P trade ideas
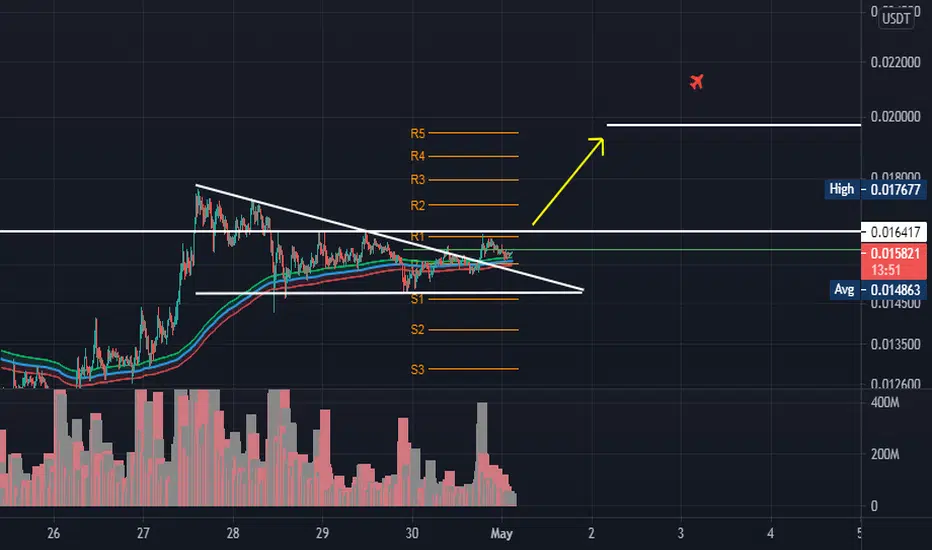
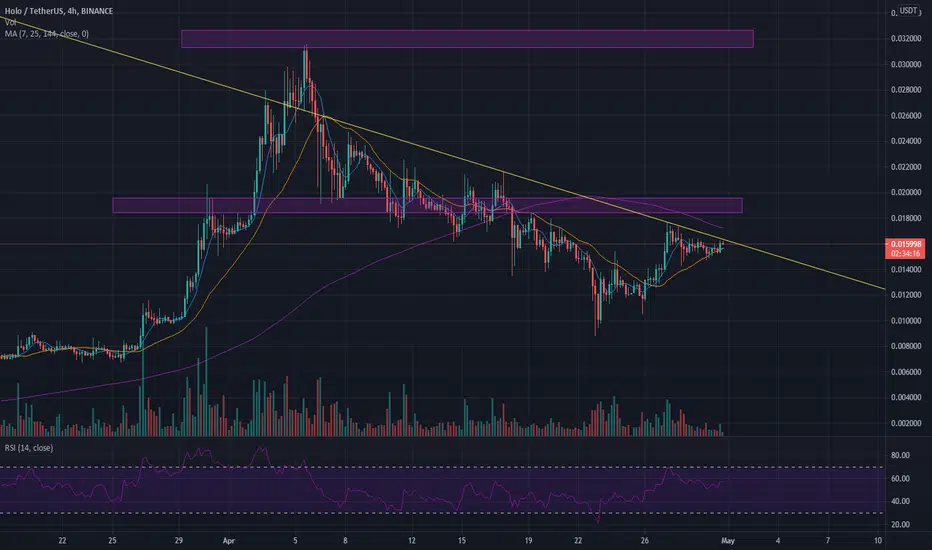
HOT/USDT TRENDLINEHi there
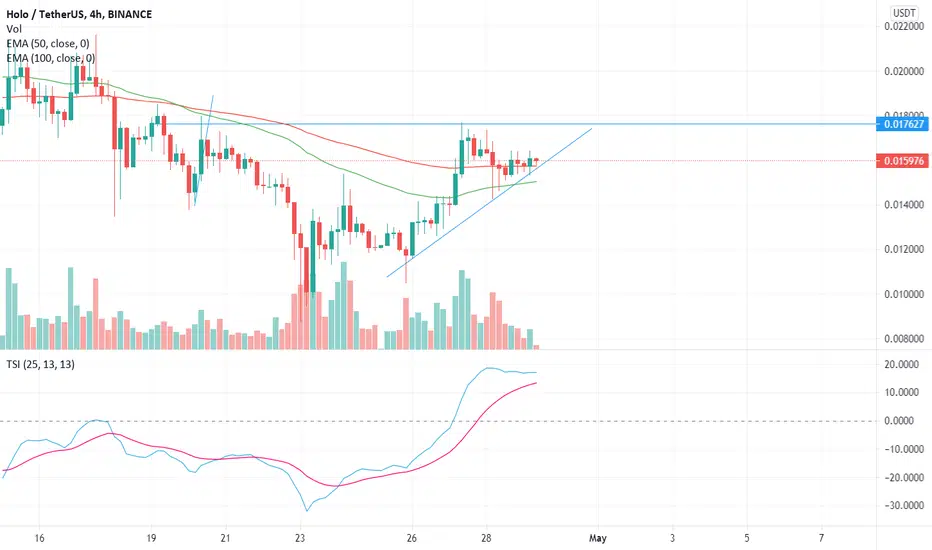
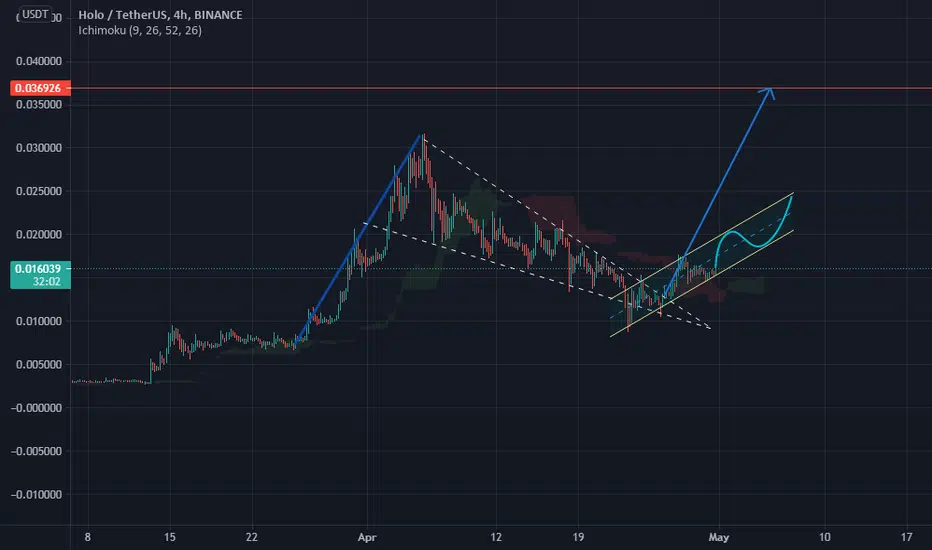
i am watching hot/usdt banace chart on 4h timeframe that might do something intersting
Apparently it broke the downward trend but its Not enough for me cause
this coin raised a lot and its very risky in my opinion and im gonna wait to see a significant volume
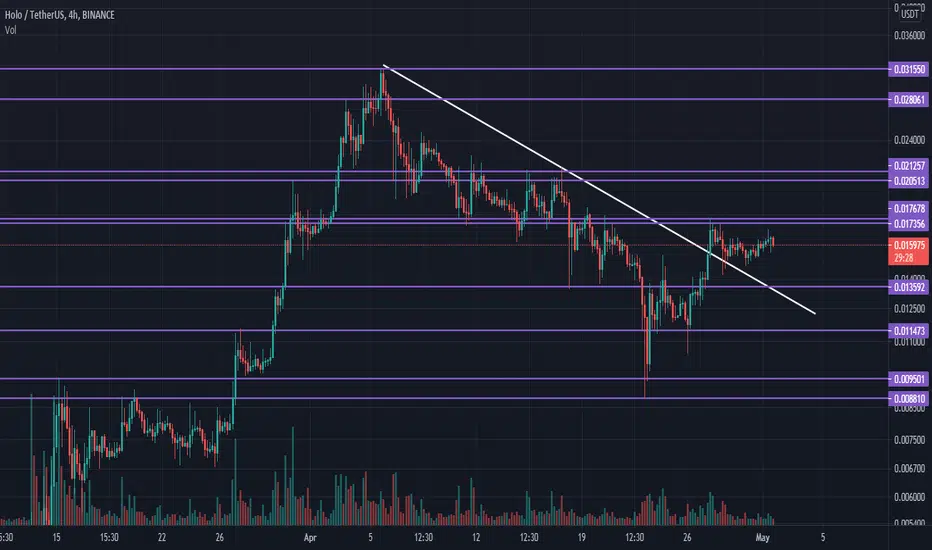
so the support and ressistance lines are visible in the chart
and i will be happy to read your opinion and if you enjoyed mine like it please
hope you earn the best profits
bb
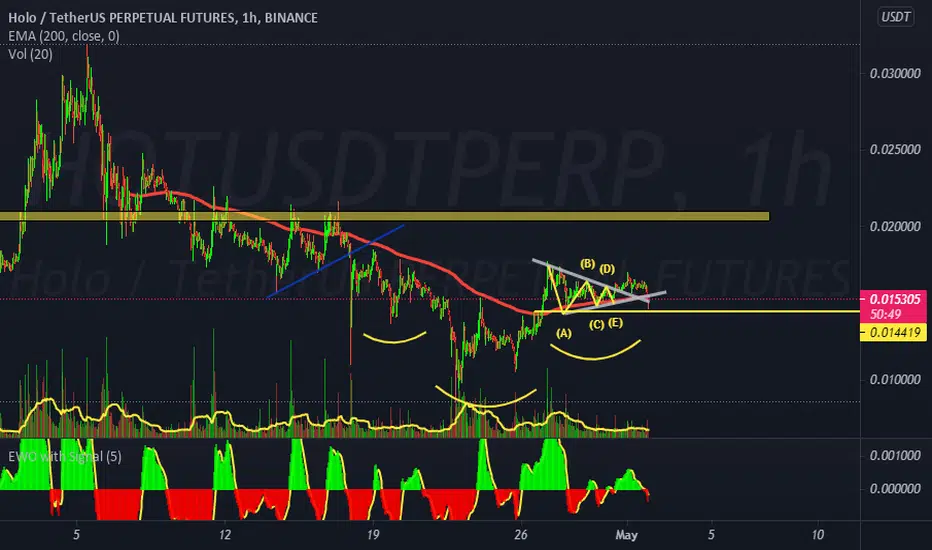
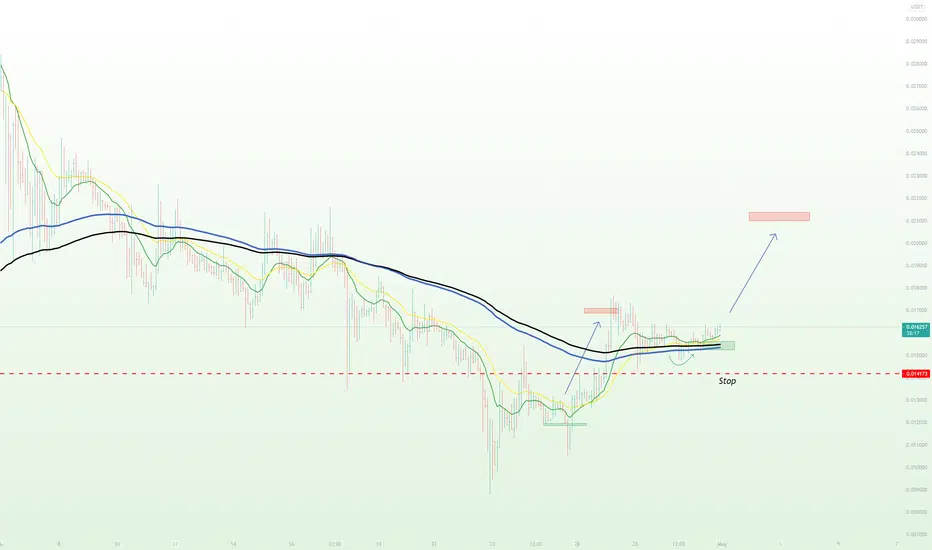
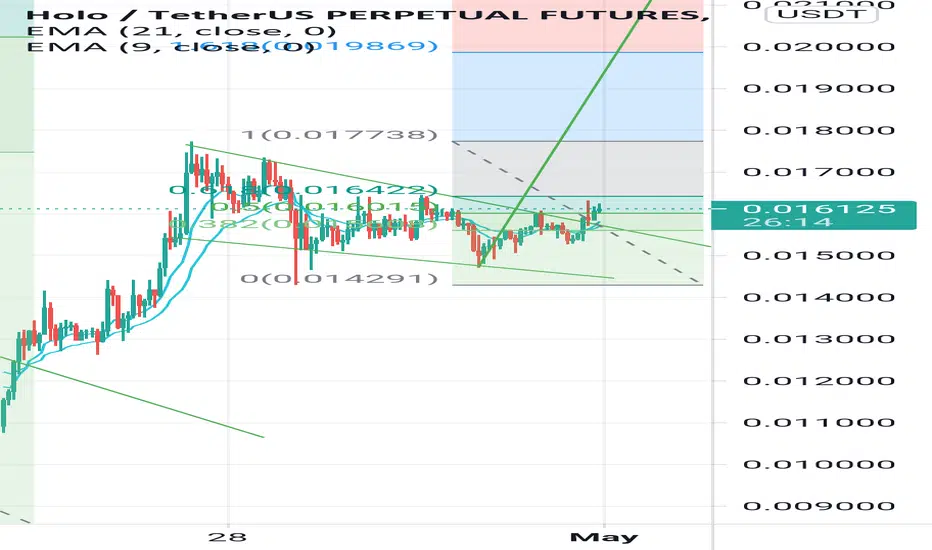
HOTUSDTthis alt is in bearish bias in this view and similar time frames but when you check lower time frames you can obviously see an unfinished triangle formed and also you can realize that bears lost their control and the bulls are getting in control so we enter from right here and head for our aims and targets
👉this idea has the confirmation of advanced price action
👉for more information about our services contact me via trading view private chat
👉hit share and spread these information for everyone and help us benefit others too

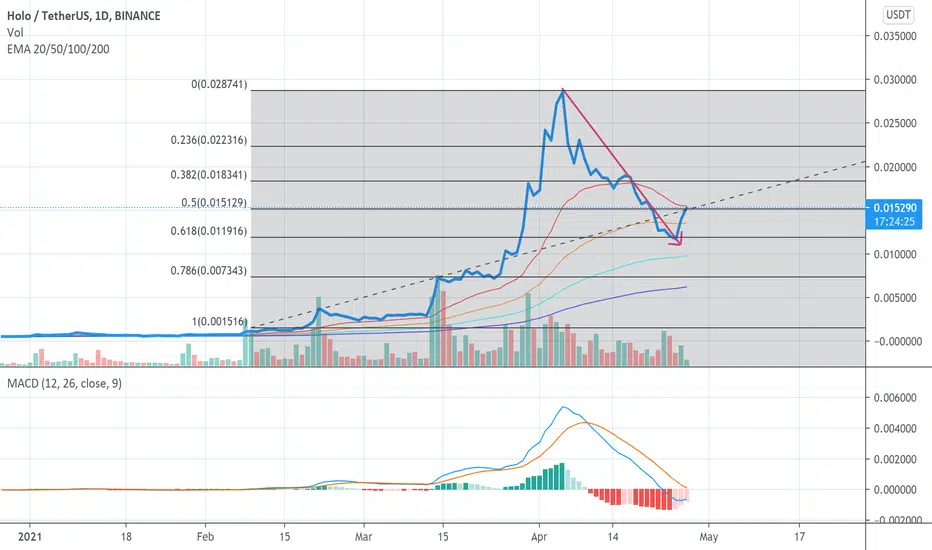
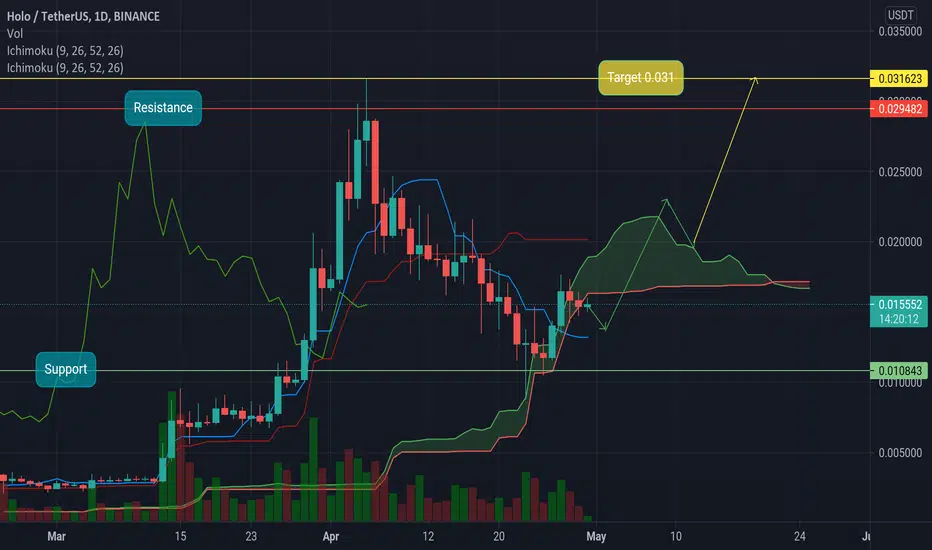
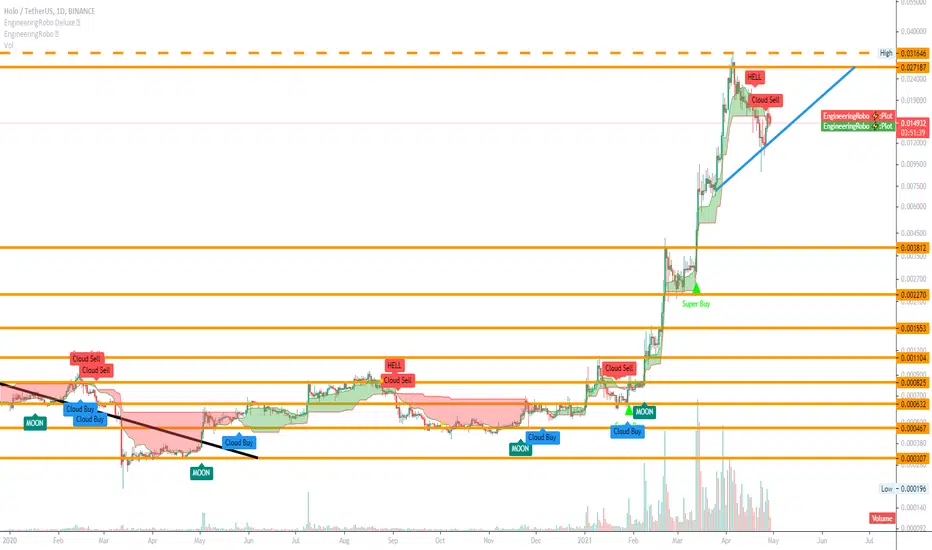
Very bullish signals for HOT on the daily!!Bullish signals:
MACD almost green
Almost crossed all the 20/50/100/200 moving averages
Broke upwards the downward trendline
Target .03 (plus 100%:)
hotusdtBINANCE:HOTUSDT
hi.
The chart says it all, do you agree?
I'm bad with a lot of lines.
Please support the idea by clicking the like button and expressing your opinion in the comment box.
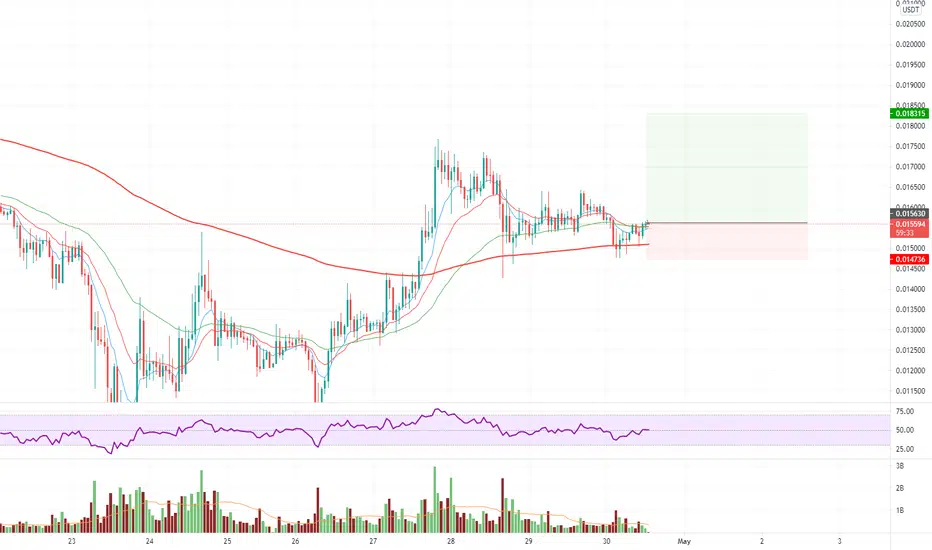
Hotusdt Good Entry After BreakoutIt has broken the downtrend channel now waiting for breakout of the resistance after that a good long entry would be profitable
Like and follow me for more idea
Let me know your ideas in comments
Thanks 👍
HOT in attemp to reach 100% profit...According to ichimoku cloud and support and resistance
also by using macd we can realize that it is buy zone and our target is about 0.03...
But I think we have a trim to 0.0135
You can buy at that price
I bought at 0.015 and i think that it will be double.
If it break resistance our second target is 0.05
See ichimoku
Price is going to move our the cloud...
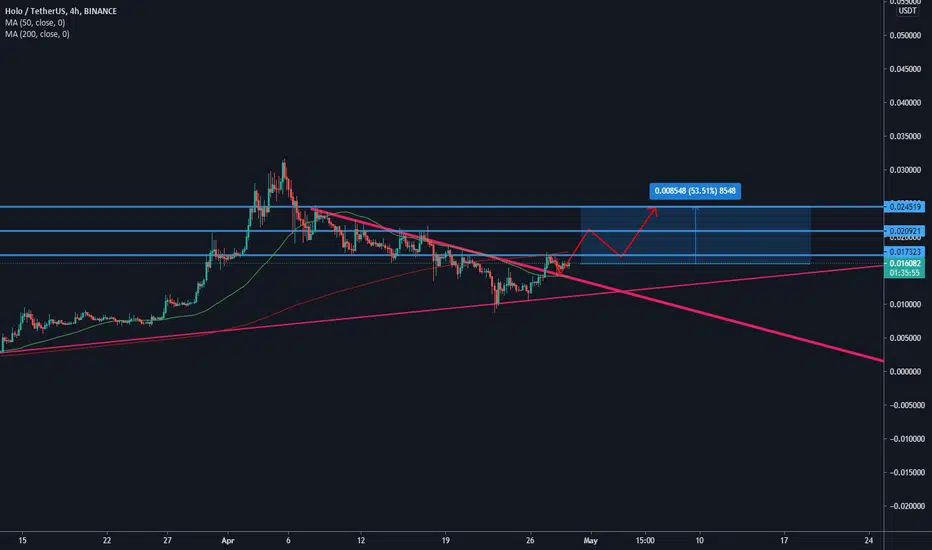
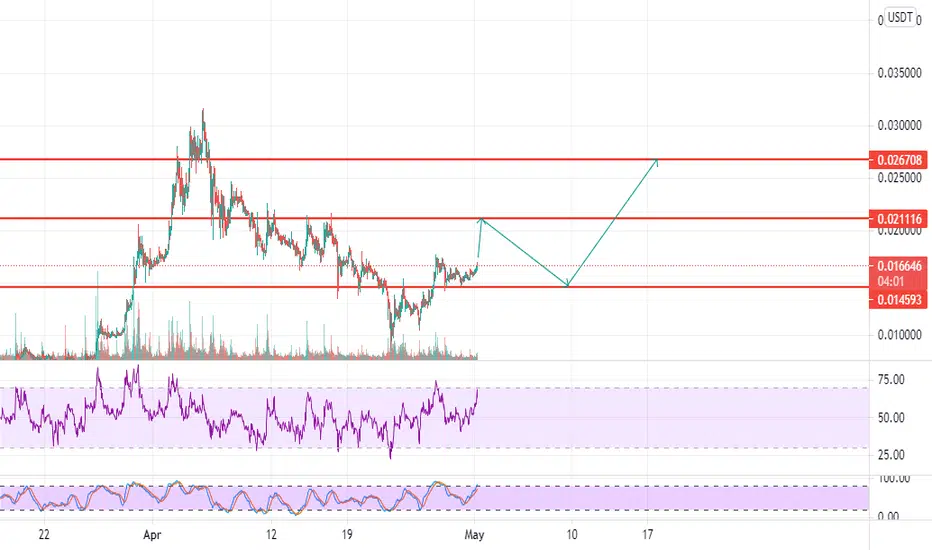
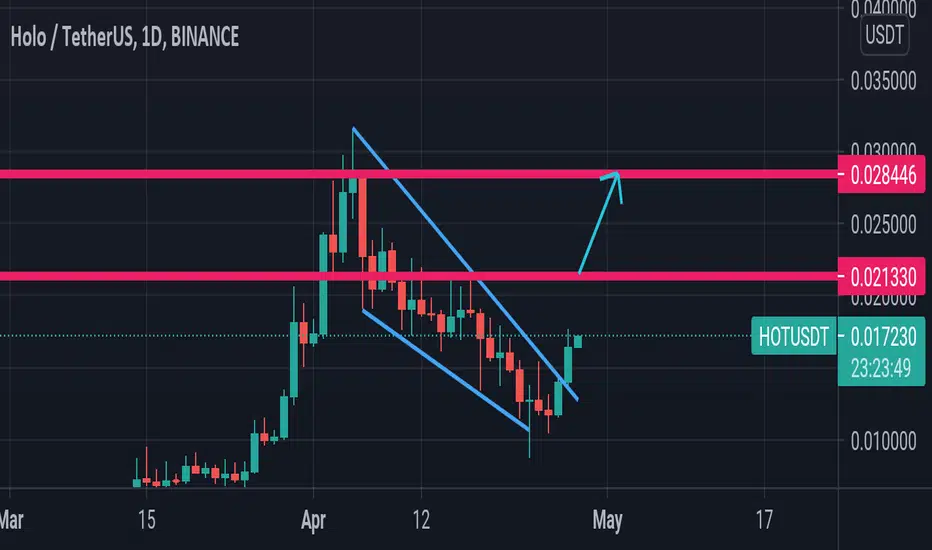
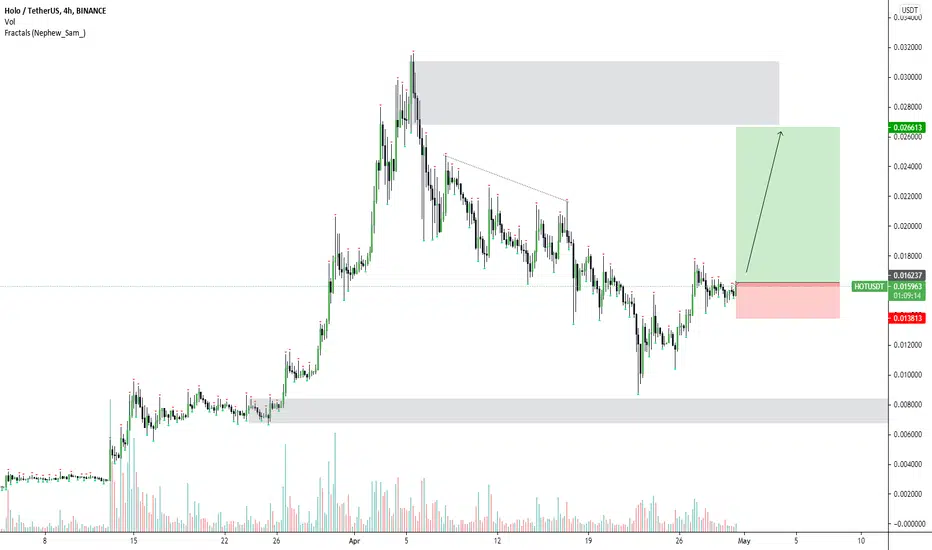
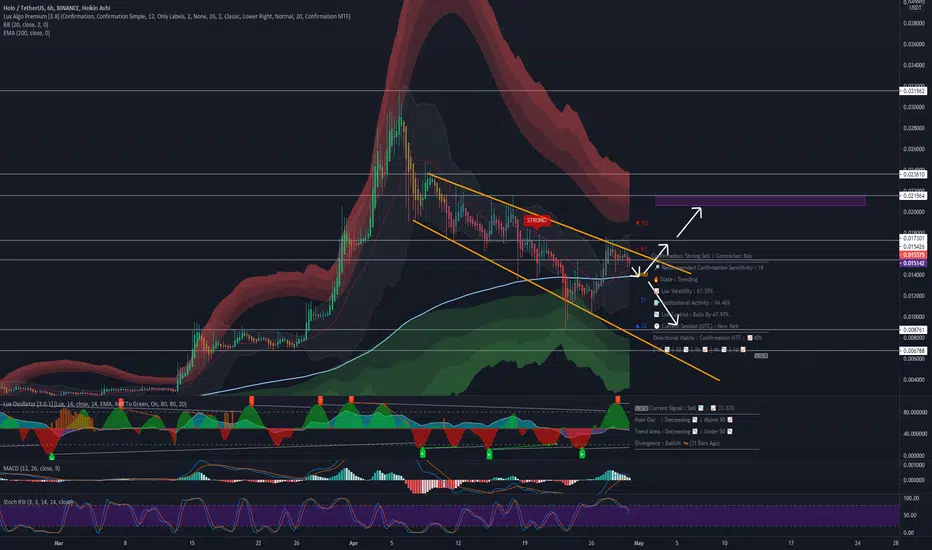
🆓Holo/USDT Map (30/4) #HOT $HOTHOT is recovering quite strong so we can accumulate it for targets at 0.021$ or even 0.034$ zone in May
📈BUY
-Buy: 0.0136-0.0144$. SL B
-Buy: 0.0156-0.0164$ if A. SL B
📉SELL
-Sell: 0.0215-0.0225$. SL A
-Sell: 0.0333-0.0347$. SL A
♻️BACK-UP
-Buy: 0.0136-0.0144$. SL B
-Sell: 0.0097-0.0103$. SL A
❓Details
🕯Timeframe : 1 Day
📈Red Arrow : Main Direction as BUY & SELL section
📉Blue Arrow : Back-Up Direction as BACK-UP section
🟩Green zone : Support zone as BUY section
🟥Red zone : Resistance zone as SELL section

HOTUSDT - AnalysisFollow the signals. Bearish on HOTUSDT at the moment. Wait for breakout above resistance or a buy signal.
ITS ABOUT TO GET HOTNice reversal from Btc dump earlier in the week, chart looks good ready for the 0.02 region soon if btc stays stable
HOLO next price target 0.048$Holo has two key resistance levels to break before we can actually see a rally up to 0.048$


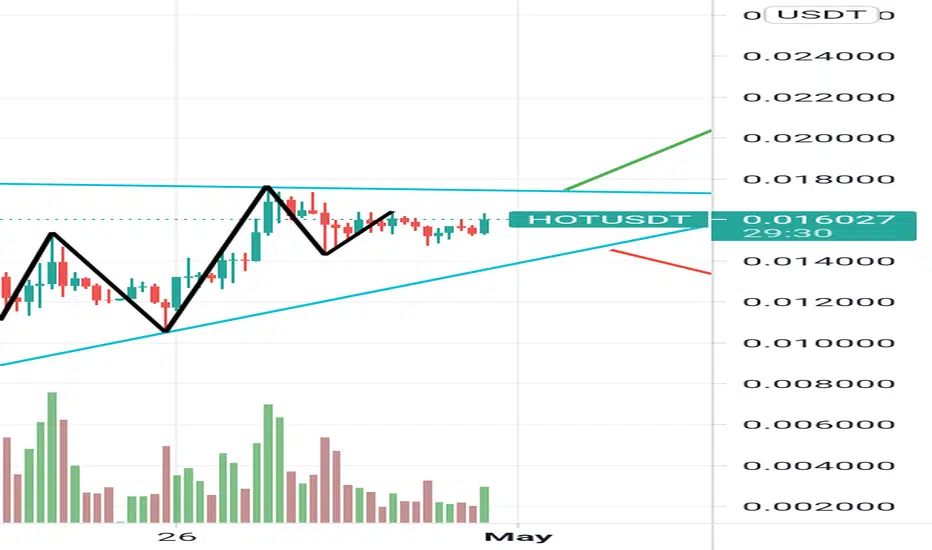
hot to the moonacending triangle if btc goes bullish hot is going to do bullish so we can see a new all time high soon i aspect